


Hello.
I’ll lay out my trading scenarios for the coming week.
I publish this “Trade Scenarios” blog every Sunday.
And every Saturday I post a “Weekly Trade Report” where I explain how I actually thought about the market and executed my trades during the week.
By reading this trading-scenario blog together with the Weekly Trade Report, I think you’ll be able to use my process as a practical reference for how to think ahead of time, what to wait for, and how to execute in a consistent way.
For the underlying strategy, please refer to my blog posts on Dow Theory and multi-timeframe analysis.
A “scenario” is not a forecast.
It is not a prediction, but my personal plan that says, “If the market does this, I will do that.”
I don’t try to predict the market, and this is not intended as such, so please keep that in mind.
Nor is this a set of instructions telling you what to buy or sell, or a service providing trading signals.
It does not guarantee any future profits; it is provided purely for educational purposes, using my own consistent process as the example.
I cannot take responsibility for any outcomes of the trades you place, so please trade at your own risk.
With that, let’s start with USDJPY.
(On my charts, the colors of the lines I draw represent each timeframe: orange for the daily, red for 4h, blue for 1h, and green for 15m.)
〜・〜・〜・〜・〜・〜・〜・
USDJPY
Daily
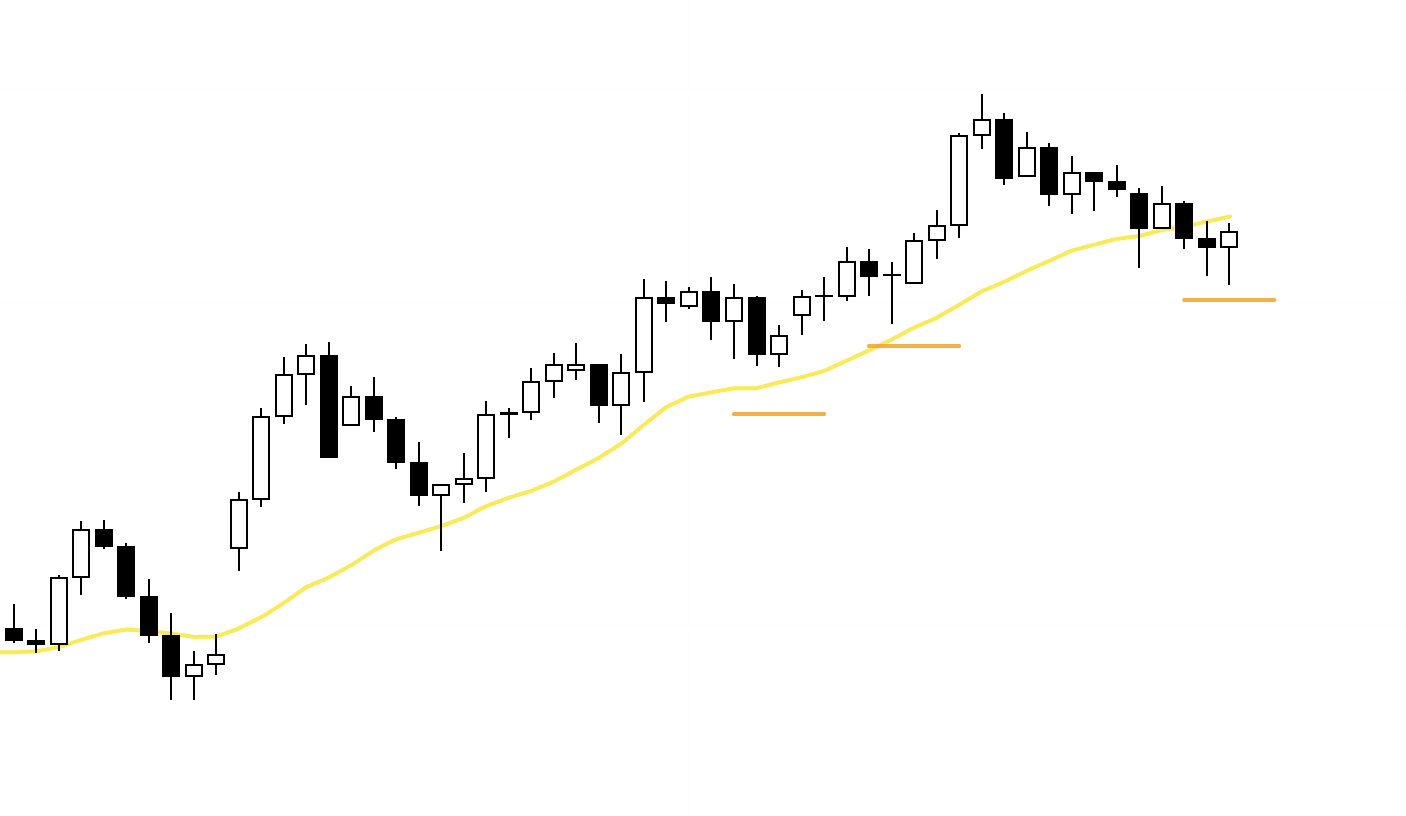
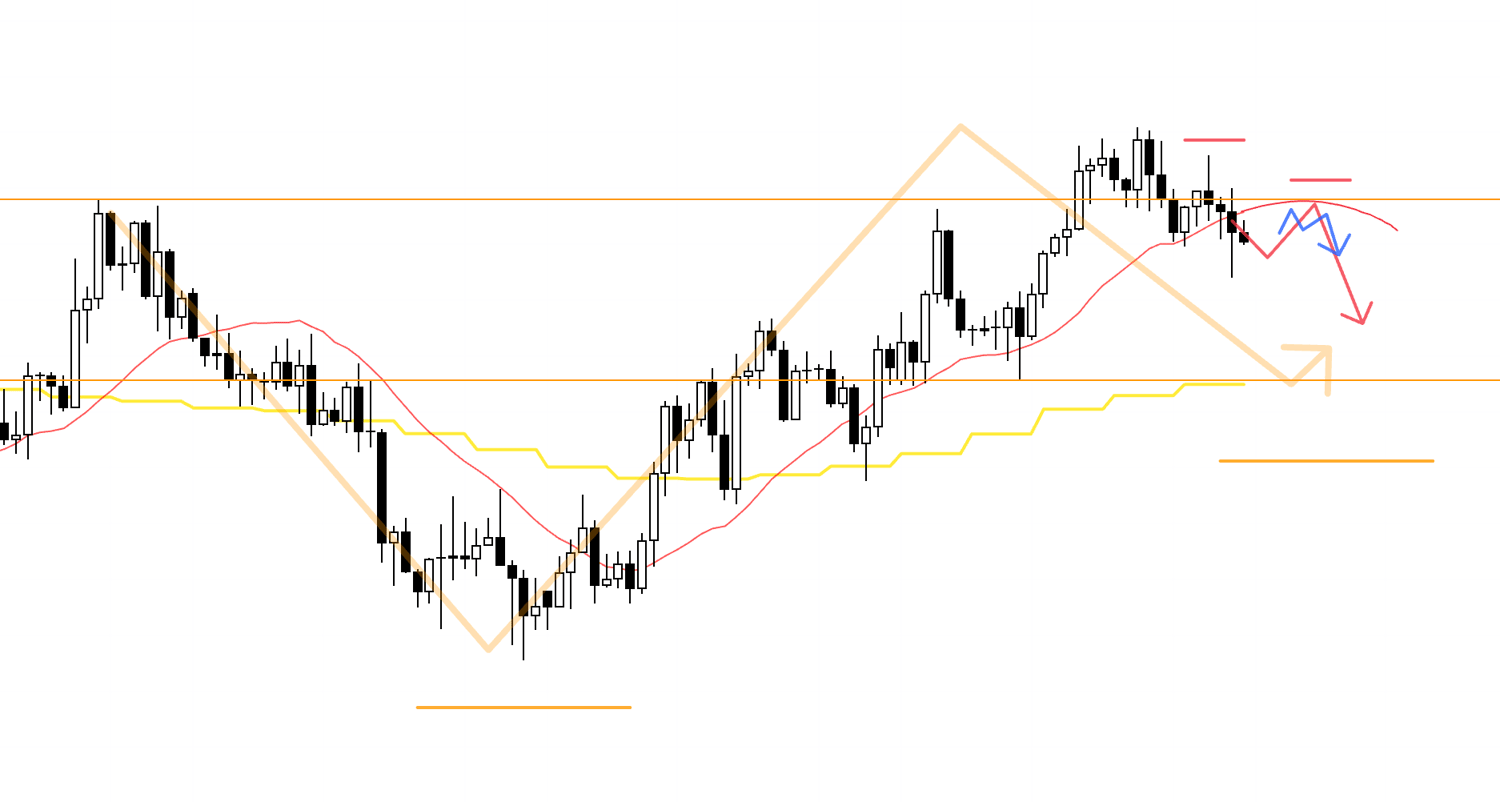
On the daily chart we are putting in higher lows while taking out the highs, so there appears to be a camp that views this as a dip-buying opportunity, but at the same time the market is also making slightly lower highs, which makes it look as though there is also a camp positioning for sell-on-rally setups.
Daily
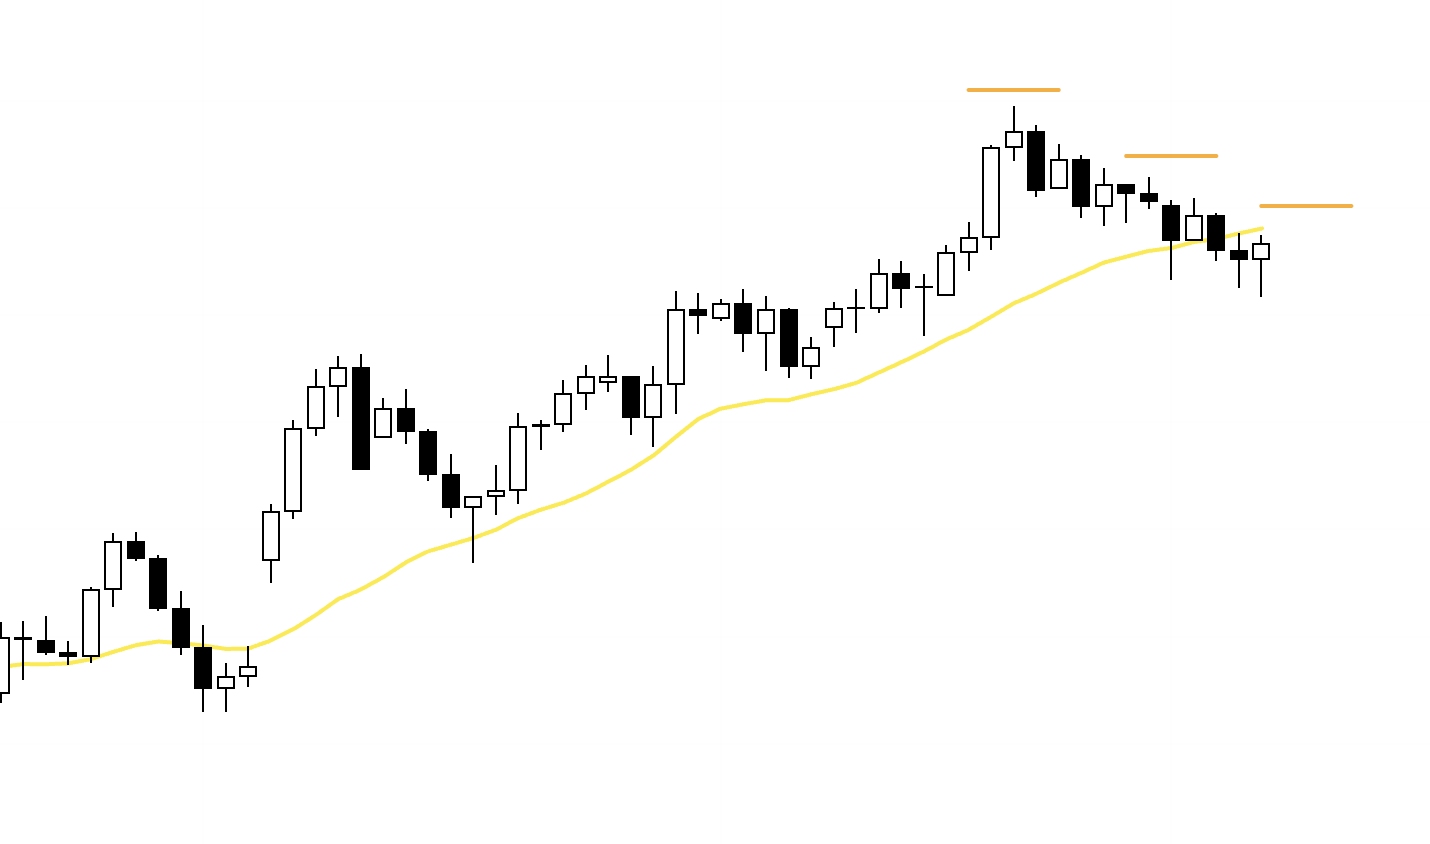
Looking more closely like this, the daily chart can also be seen as making lower highs, and price action is showing moves that slip back under the moving average.
Daily
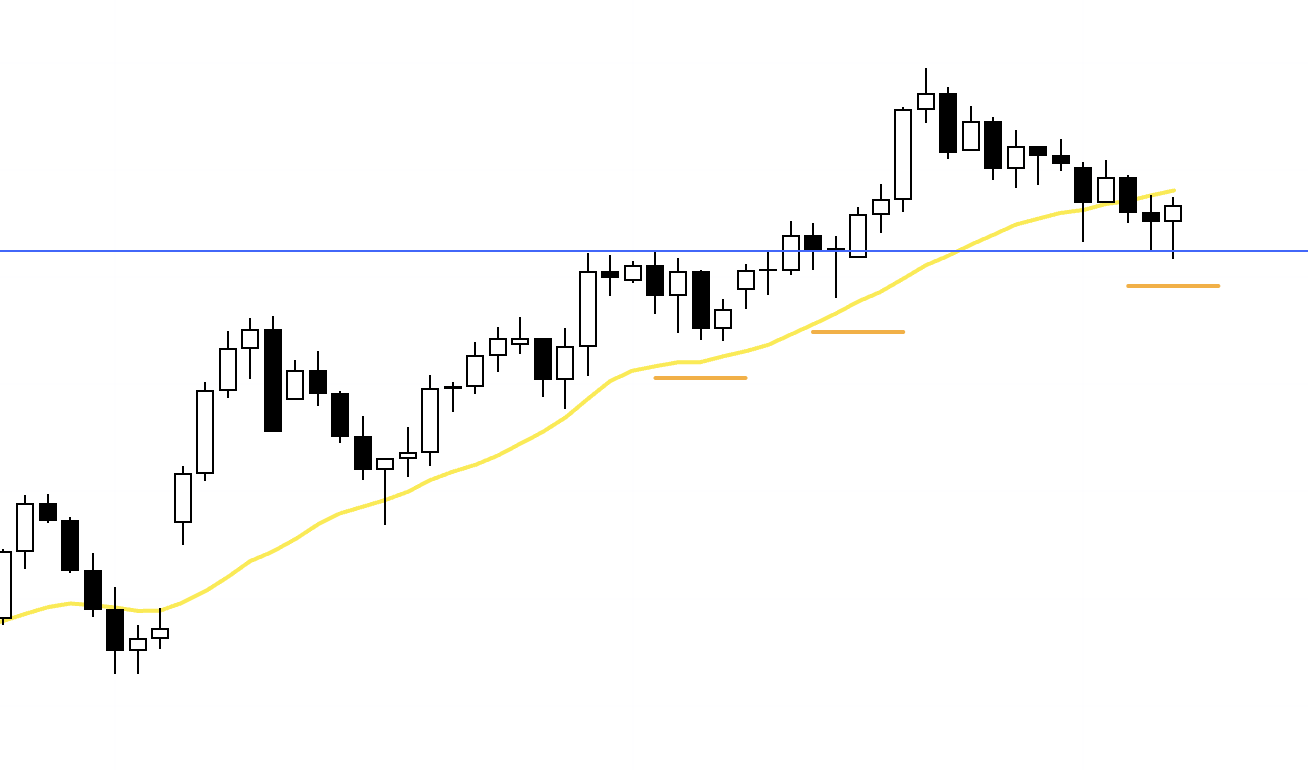
However, we have not yet broken below the low that served as the starting point for the most recent swing high, and price also looks to be supported at the moment by this blue line drawn from the previous high, so if I am going to sell I am not looking to short immediately; instead I am thinking about sell-on-rally setups only after we first break down through these lines.
On the other hand, if I am going to buy, price is currently trading below the moving average, so I would like to consider longs only once we are in a situation where price is being supported from underneath by the moving average.
With that in mind, let's look at the 4h chart.
4h
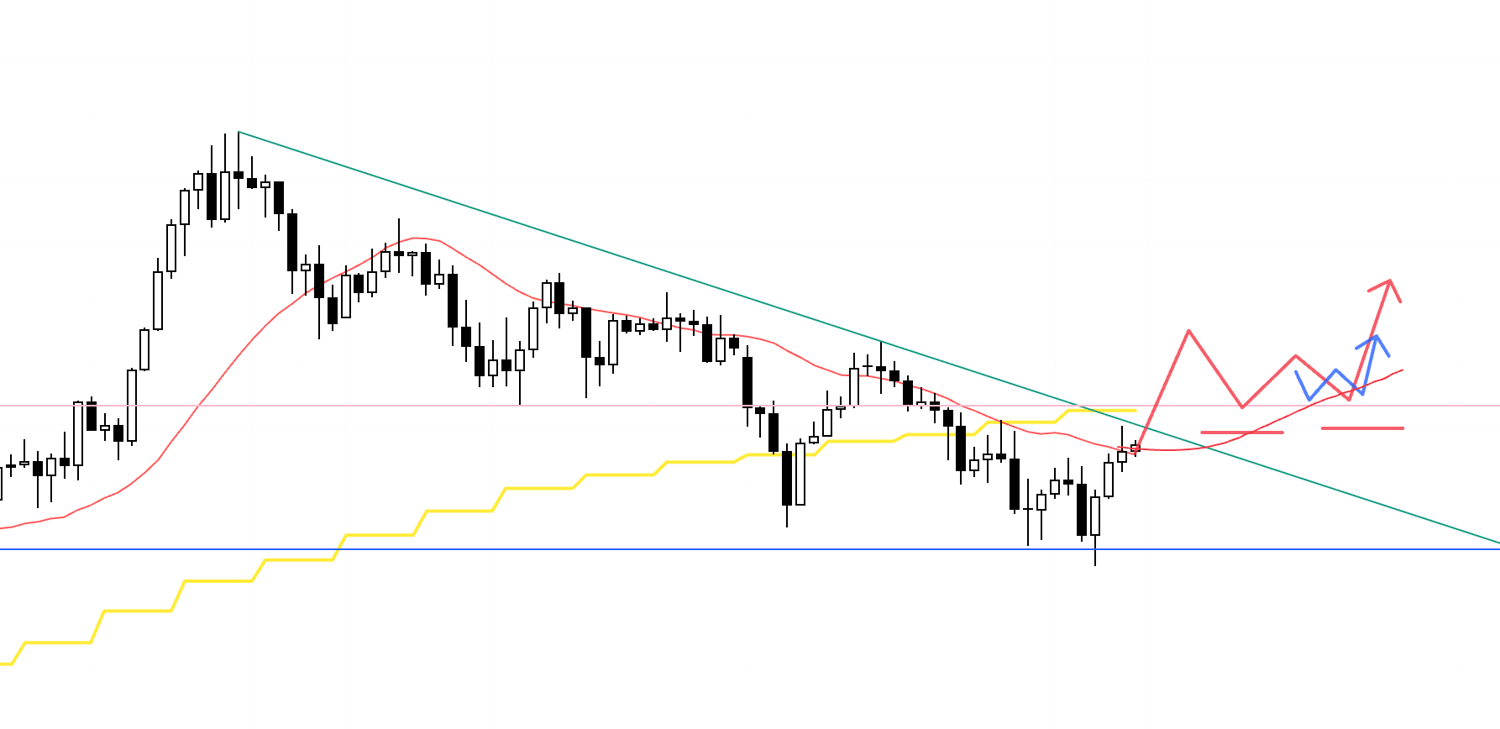
Right now price is also being capped from above by the daily moving average, so I cannot buy immediately; for example, if we first break above the daily moving average and the green trendline and then form a higher-low point on the 4h again, I will look to consider longs on the lower timeframes.
4h
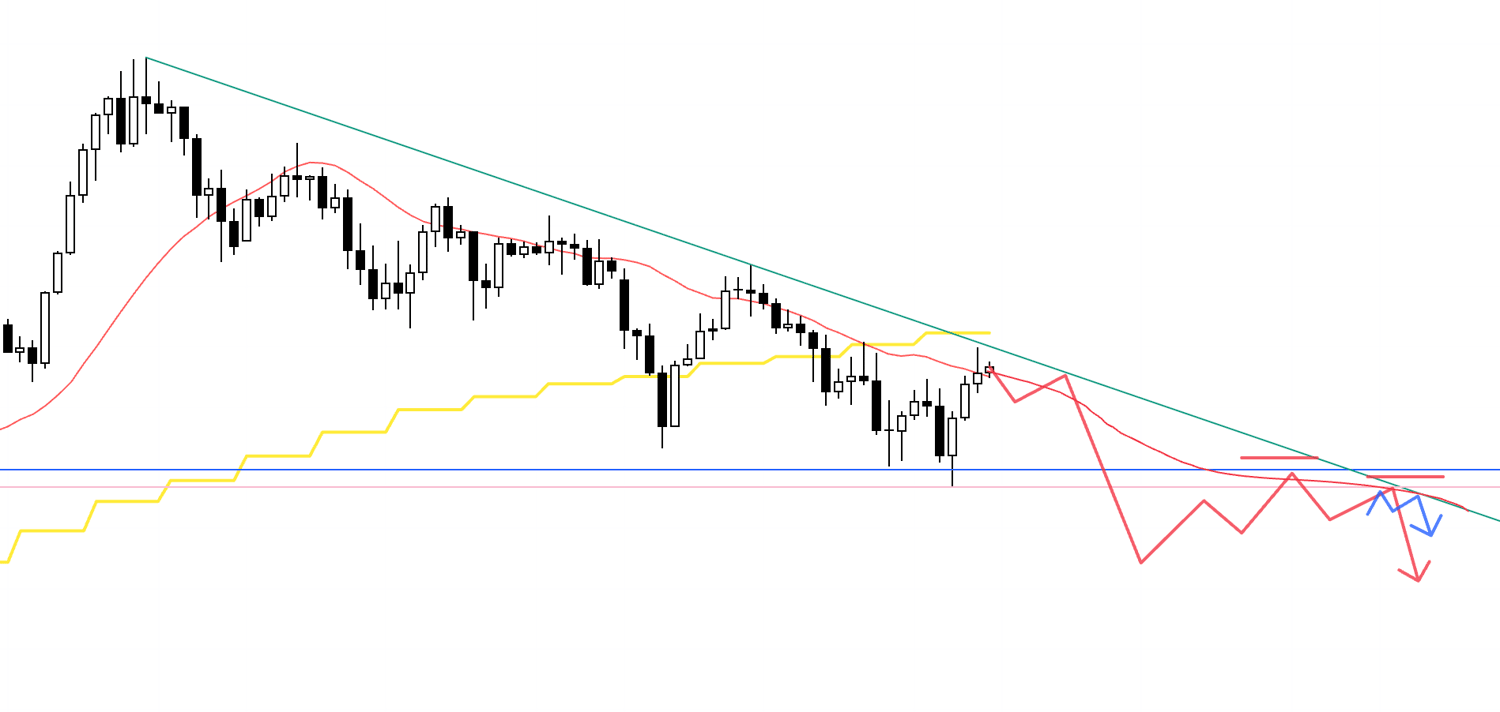
For shorts as well, I would first like to see price break below the blue line underneath, and then, once the 4h forms a lower-high point again, I would look to sell on the lower timeframes.
Now let's move on to EURUSD.
〜・〜・〜・〜・〜・〜・〜・
EURUSD
Daily
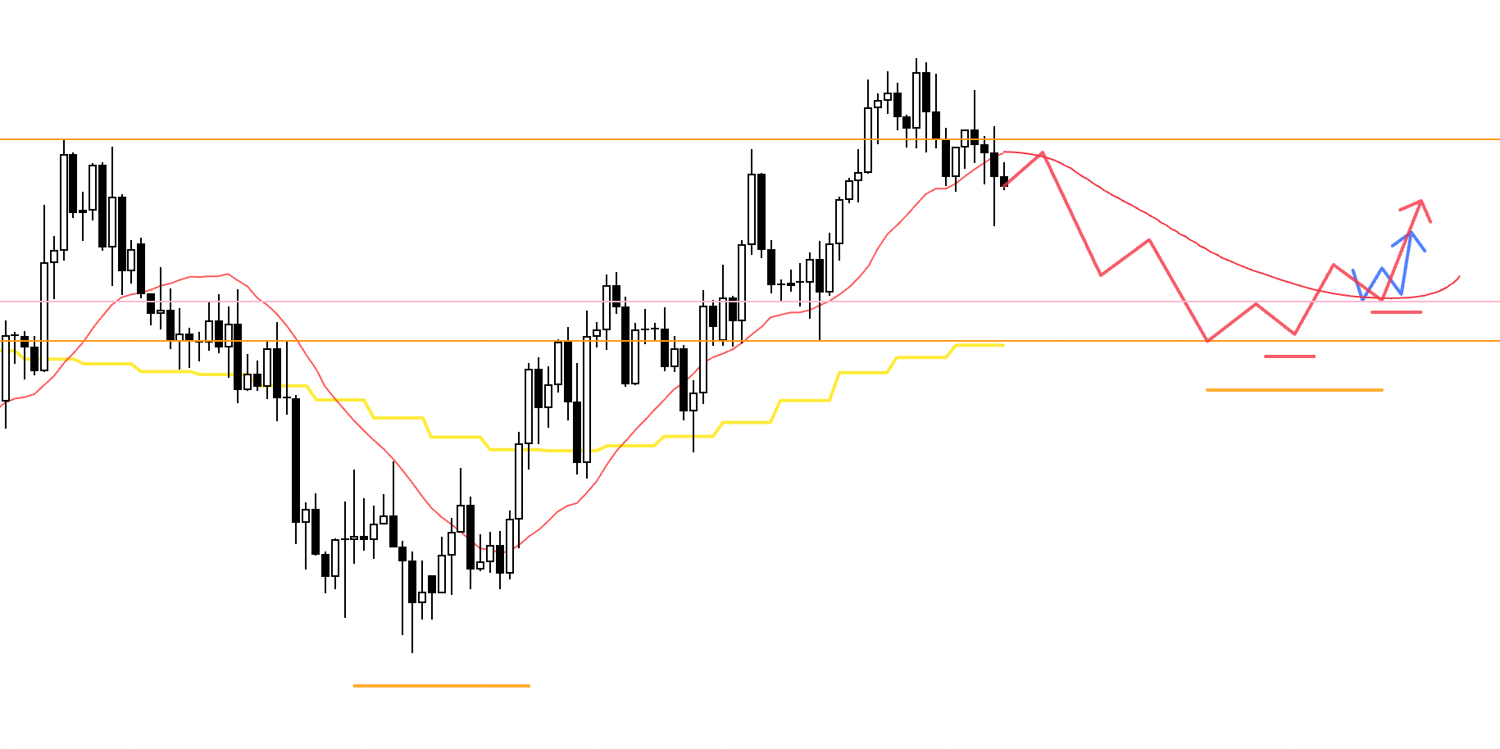
On the daily chart, the market is putting in higher lows and has just slightly broken above the previous high, so it looks like a phase where the trend may have flipped into an uptrend.
However, on the weekly it also looks like a potential sell-on-rally zone, so if I am going to buy I would like to see clear support.
Daily
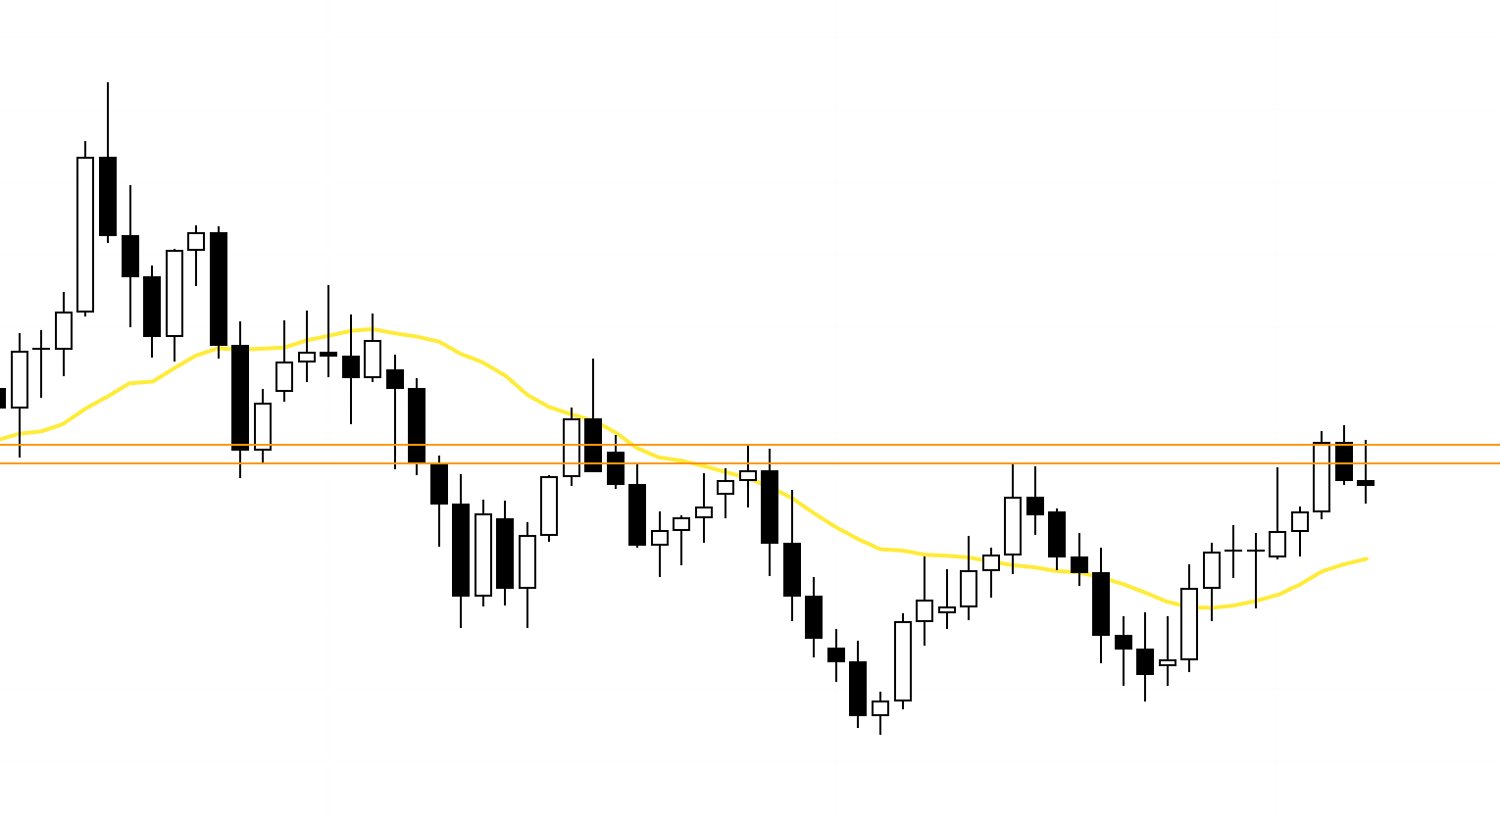
I am focused on this orange line, so if I am going to buy, I would like to consider a dip-buying entry if we can buy in a way where price is being supported by these lines.
Let's look at the 4h.
4h
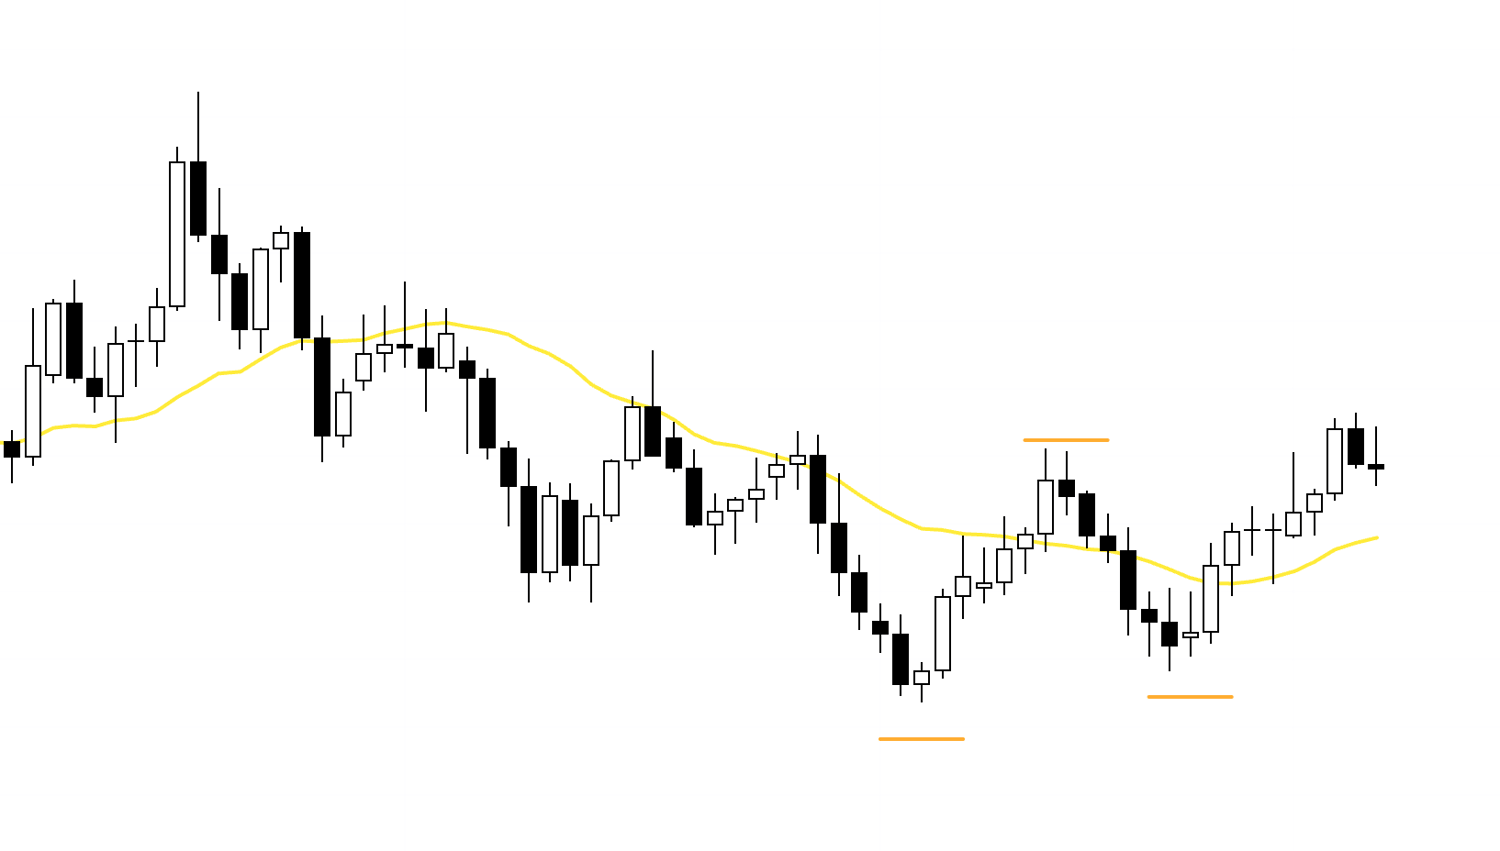
For example, if the 4h forms a higher-low point in a way that is supported by the orange line, I will look to buy on the lower timeframes.
4h
Conversely, if the 4h forms a lower-high point that suggests price is being capped from above by this orange line, I could also look for short setups, but in that case there is the risk that the lower we go, the stronger the daily dip-buying pressure becomes, so I will be watching whether any entry appears with a risk-reward profile that makes sense and, if I do take a position, I will manage it by, for example, taking profits on half the position around the lower orange line.
4h
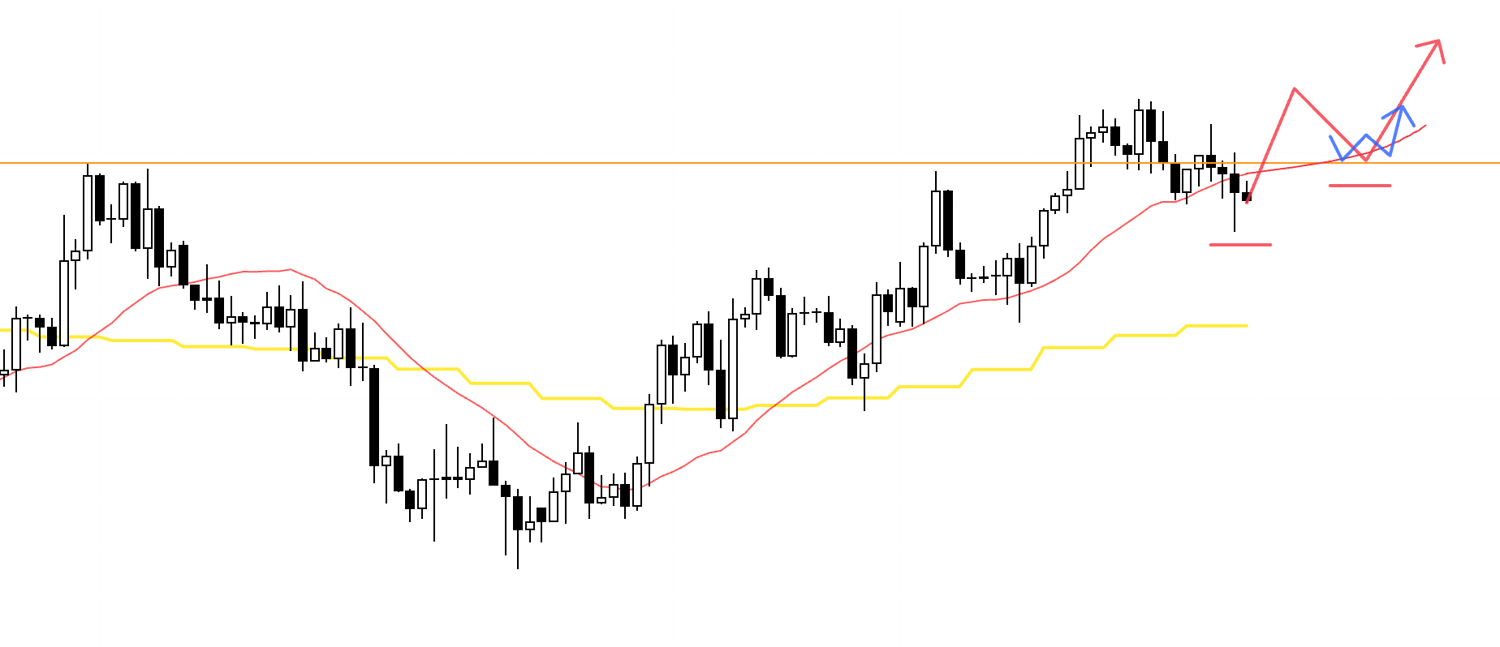
After that, if, for example, the 4h reverses trend around this orange line, I will look for buys to ride the initial leg of the daily move that would be driven by dip-buying.
At that point, on the 4h I will also check whether price has already broken back above the moving averages, or whether we are breaking above moving averages whose slope has started to flatten out, and so on.
4h
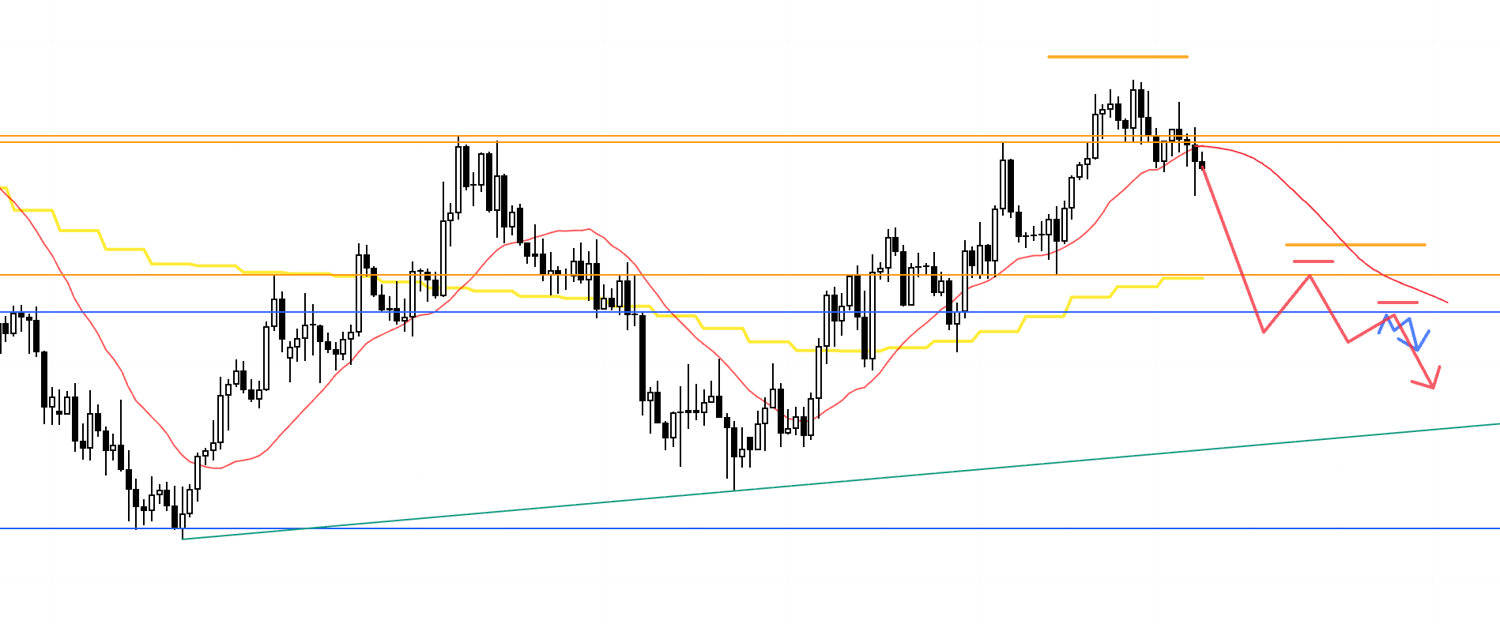
Just below the orange line there is a prominent weekly support line (blue), so if I am going to sell I would want to see price break below this blue line as well and then form lower-high points with this blue line acting as resistance; however, beneath that there is an ascending trendline (green) drawn through the higher-low points on the daily, so the key will be whether an entry appears with a risk-reward profile that makes sense.
〜・〜・〜・〜・〜・〜・〜・
That's all for now.
These are scenarios as of now, and once the week actually starts I plan to watch how price moves and update or build out the scenarios each time as we go.
It is easier to win, and easier to grow capital, when you trade in a market environment that is well set up.
That is exactly why you need to trade "only" when the market environment is in your favor.
For that reason, you need to build scenarios in advance and have a prior grasp of "what conditions would create an edge" and "what risks are lurking where".
And for that, you will not learn anything by looking at a single timeframe in isolation.
The reason is that even if you are trading off just one timeframe, there are many others trading off different timeframes, and ignoring their perspective simply puts you at a disadvantage.
I trade off the 1h and 15m, but that does not mean I am only looking at the 1h or 15m.
It is extremely important to think about what traders holding positions on the daily are thinking, and what traders holding positions on the 4h are thinking.
No matter how much the 1h is in a downtrend, if that decline is simply a pullback forming on the 4h, the lower we go, the greater the risk that buy orders will start to come in from the 4h.
In other words, it is crucial to understand what the current downtrend means from the perspective of the higher timeframes.
So for me, when the 4h is in an uptrend and the 1h is in a downtrend, that 1h downtrend is not a downtrend for selling but a downtrend "for waiting to buy".
The point at which the 1h stops falling and starts to put in higher lows and break to new highs becomes an excellent buying opportunity, and that is what I am waiting for.
You cannot see any of this by looking at a single timeframe; it is precisely by looking across multiple timeframes that you can target the moments when orders from traders on different timeframes line up in the same direction and concentrate at a single point.
Areas where sellers' stop-loss orders and fresh buy orders cluster will naturally be points where price is temporarily more prone to move.
A chart is not something a computer is generating automatically; it is the trace of actual trades placed by traders, and those traces provide the information that shapes traders' motives for the next round of buying and selling.
What matters is whether a trader can make good use of that, whether they can interpret it, whether they can "read" the chart as the language of traders.
What I am doing is nothing more than the absolute basics: just Dow Theory and Granville's rules, applied across multiple timeframes, but how deeply you refine and internalize those basics is extremely important.
The core of Dow Theory is the progression of highs and lows, and Granville's rules describe how price behaves in relation to the moving averages.
All I am doing is applying this simple way of looking at the market across multiple timeframes.
Of course, it may look simple, but it takes a very long time to truly master.
That is not unique to trading; in any field, becoming a professional in that field is something that takes a great deal of time, and something you should be prepared to spend time on.
So rather than constantly flipping from one strategy to another, it is crucial to acquire a simple, "essential" way of looking at the market and then spend time honing it.
These trading scenarios are nothing more than my own plan, so if you have not yet settled on a way of trading, you are welcome to use them as a reference when building your own strategy; but if your own trading style is already established, please do not let my trading plan distract you—stick to your own rules.
Thank you for reading to the end.