

Hello.
I’ll lay out my trading scenarios for the coming week.
I publish this “Trade Scenarios” blog every Sunday.
And every Saturday I post a “Weekly Trade Report” where I explain how I actually thought about the market and executed my trades during the week.
By reading this trading-scenario blog together with the Weekly Trade Report, I think you’ll be able to use my process as a practical reference for how to think ahead of time, what to wait for, and how to execute in a consistent way.
For the underlying strategy, please refer to my blog posts on Dow Theory and multi-timeframe analysis.
A “scenario” is not a forecast.
It is not a prediction, but my personal plan that says, “If the market does this, I will do that.”
I don’t try to predict the market, and this is not intended as such, so please keep that in mind.
Nor is this a set of instructions telling you what to buy or sell, or a service providing trading signals.
It does not guarantee any future profits; it is provided purely for educational purposes, using my own consistent process as the example.
I cannot take responsibility for any outcomes of the trades you place, so please trade at your own risk.
With that, let’s start with USDJPY.
(On my charts, the colors of the lines I draw represent each timeframe: orange for the daily, red for 4h, blue for 1h, and green for 15m.)
USDJPY
Daily
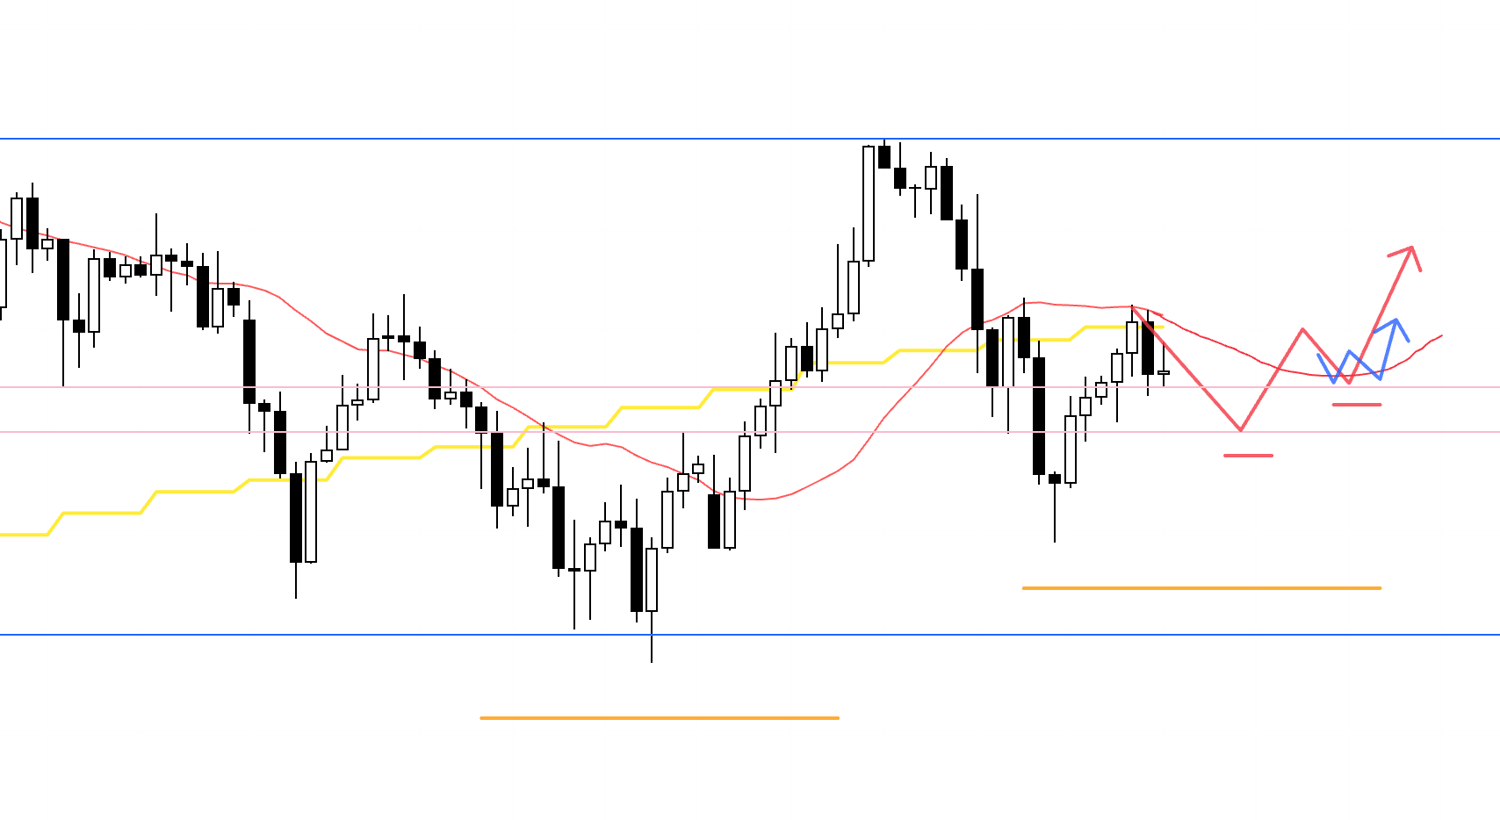
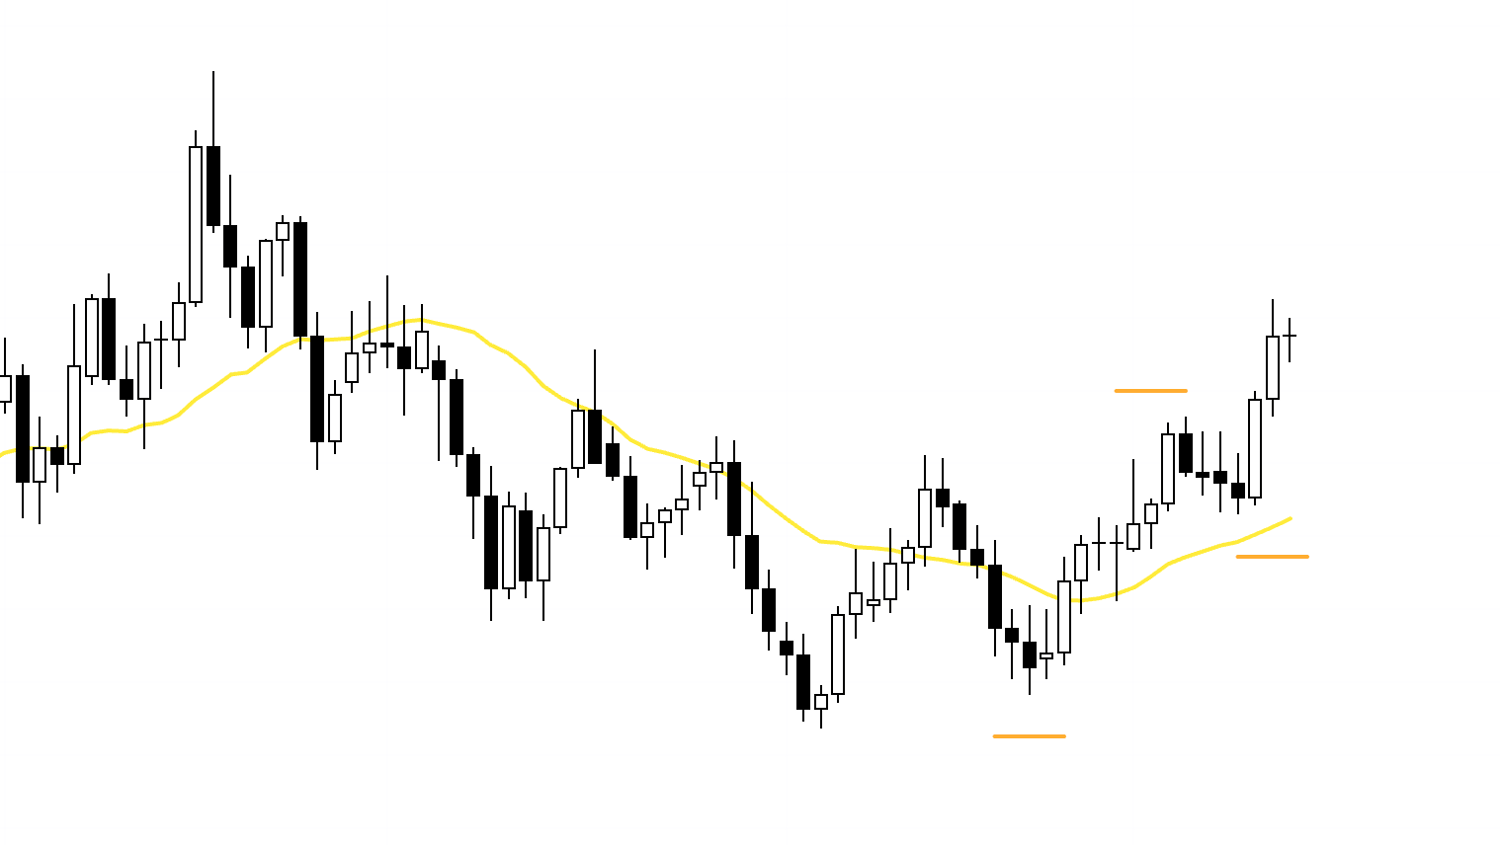
On the daily chart, price is in an uptrend, forming higher lows while pushing to new highs.
However, the most recent high failed to break above the previous high, and price is now slipping back under the moving averages as though being capped by the blue line drawn from the prior highs that can also be seen on the weekly chart.
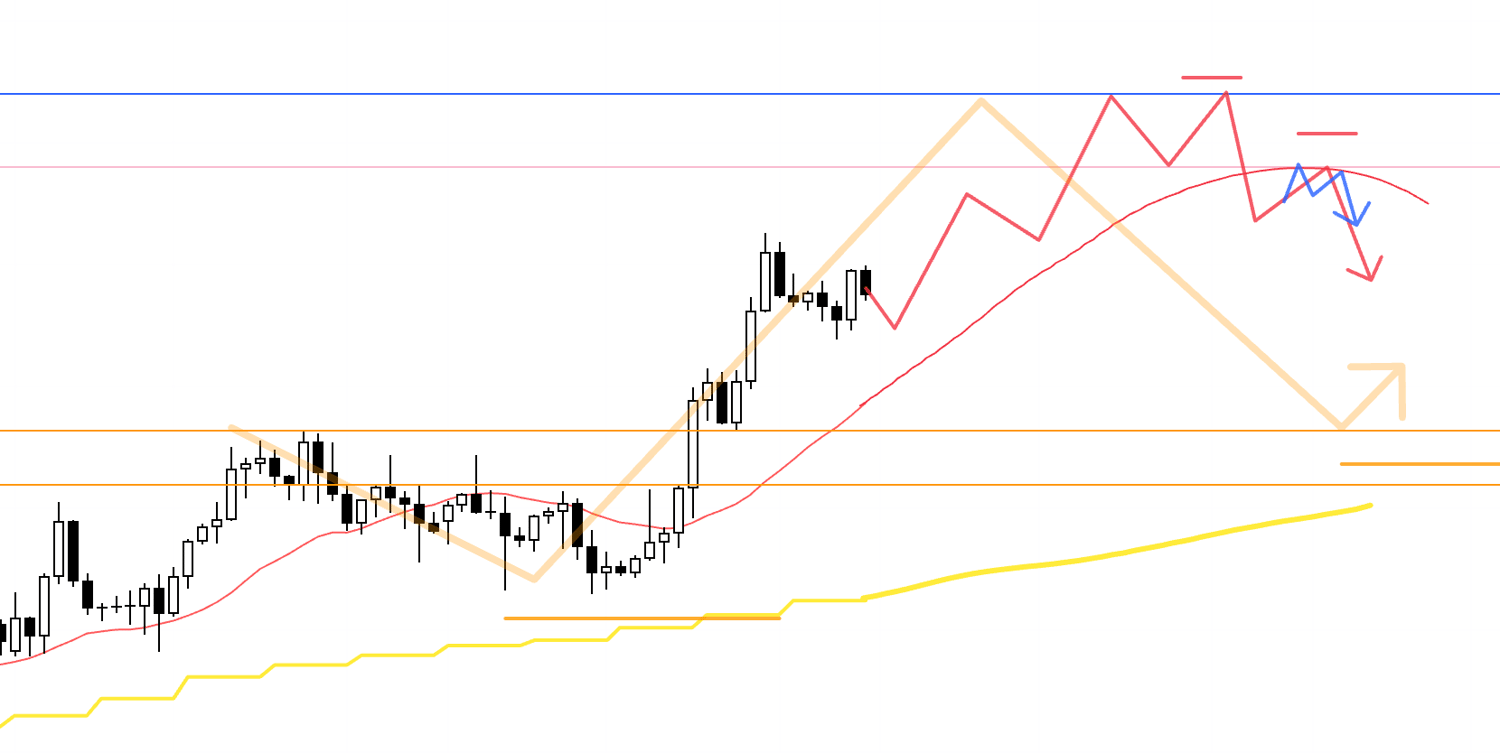
Traders who are focused on the series of lower highs marked in red are looking for shorts, while at the same time traders who still see this as an uptrend are looking for longs.
If you sell, you need to be cautious until price has broken below the lower blue line, and if you buy, you likewise need to pay attention to the upper blue line.
With that in mind, let’s look at the 4h chart.
4h
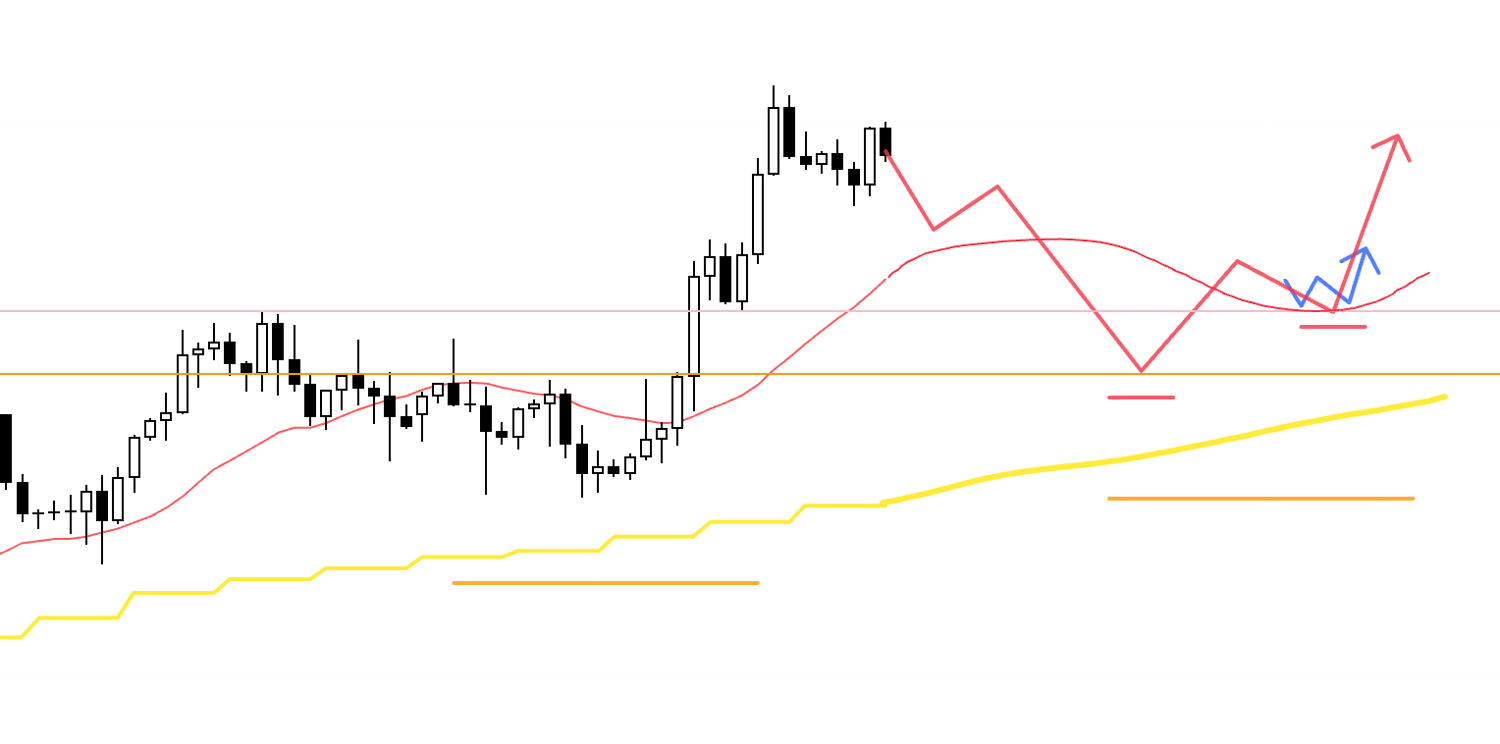
On the 4h chart, if price continues to form lower highs and, within that structure, the lower timeframes start to print lower highs and break to new lows, I will consider short setups.
That said, there is a risk that any downside simply increases buying pressure, and the previous low is supported by the prior daily highs (orange line), so I want to judge based on whether an entry appears that offers a risk–reward profile that makes sense down to that level.
If I do take a position, this will be a trade where I need to manage it by, for example, taking half the profit off at key levels.
4h

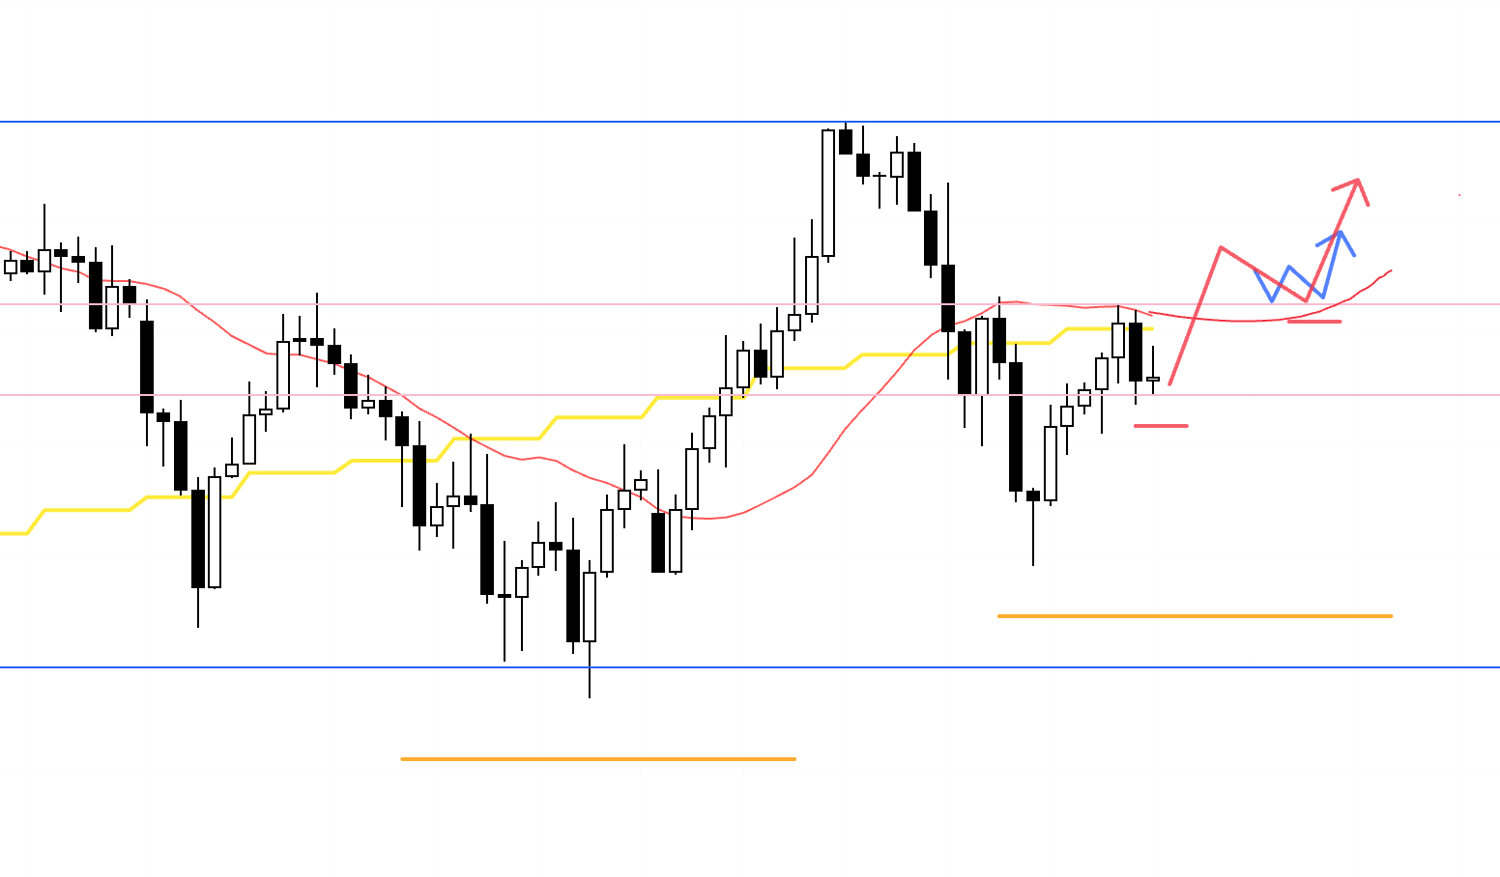
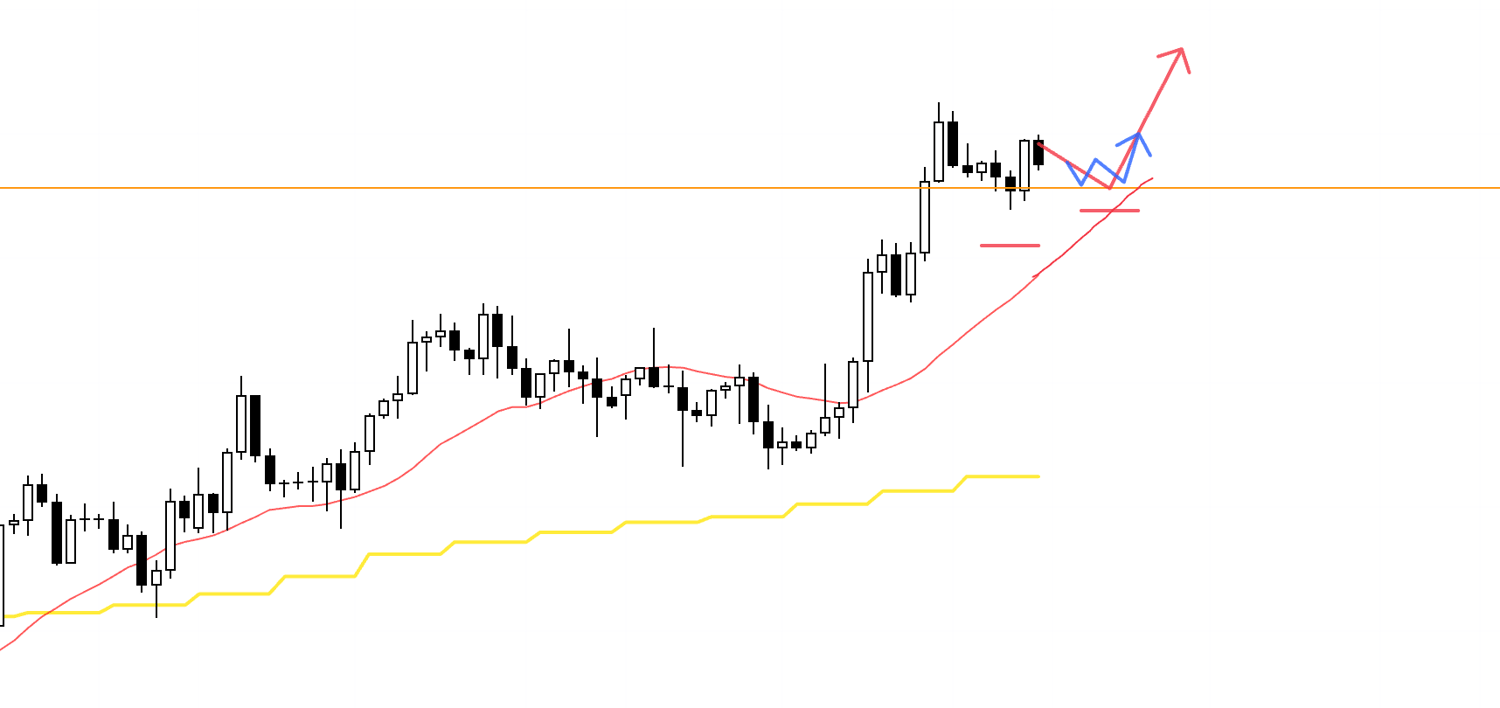
If, instead, the 4h chart starts to form higher lows like this and price begins to look supported by the moving averages, I will look to follow the move up as a pullback buy on the daily chart.
Even in that case, I still want to see whether an entry appears that offers a reasonable risk–reward up to the upper blue line, and if I do take a position, my plan is to manage it by taking half the profit before price actually reaches the line.
Now let’s turn to EURUSD.
EURUSD
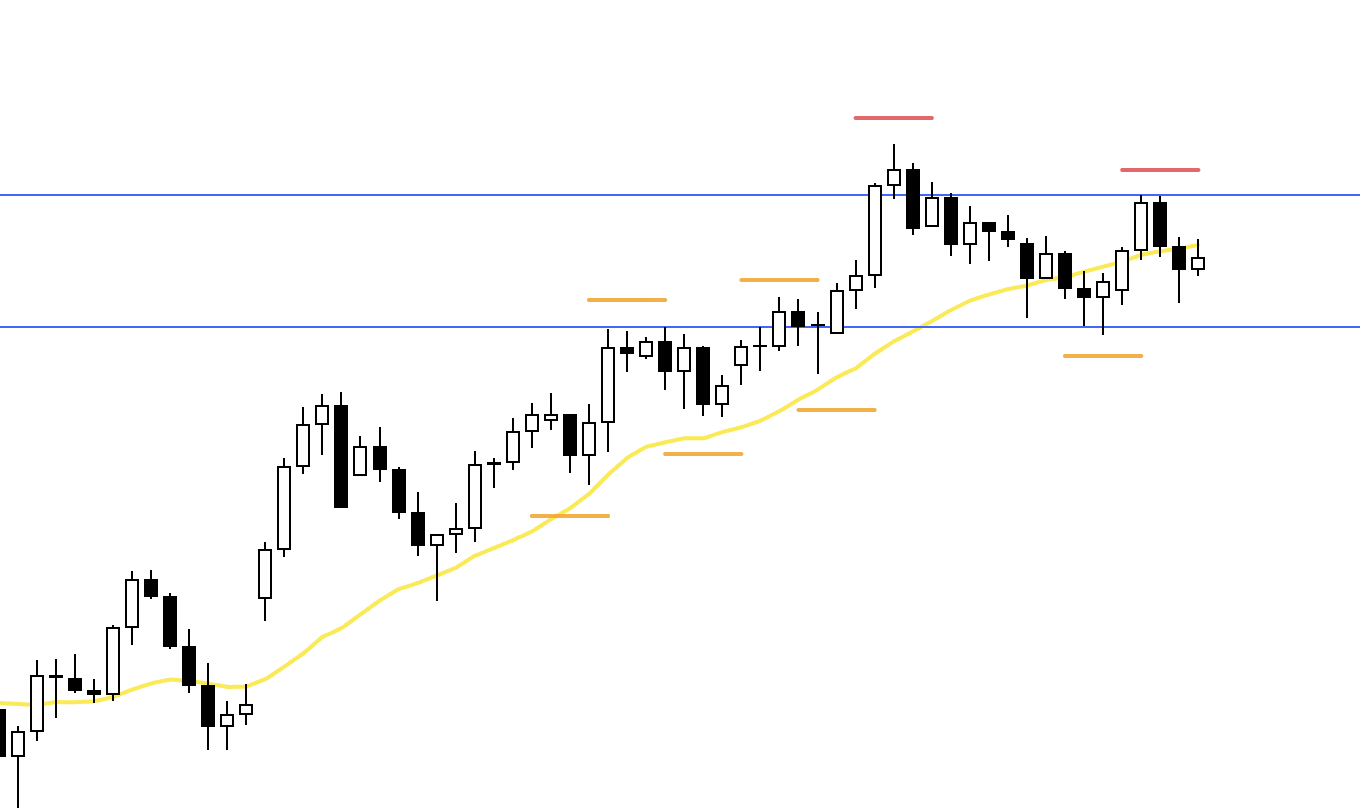
Daily chart
On the daily chart, the pair is in an uptrend, so I am basically waiting for a pullback to buy.
4h
On the 4h chart, if price forms higher lows and, within that structure, the lower timeframes also start to print higher lows and break to new highs, I will look at potential long entries.
4h
After the 4h uptrend has once been broken, I will also consider buying at points where it then turns back up into an uptrend again, in order to join the move as a pullback buy on the daily chart.
At this stage, I am not looking to trade the downside move that forms the daily pullback, because the risk–reward does not make sense.
If price does fall, I will see that decline not as a move for me to trade, but as a "wait for a buying opportunity" type of decline.
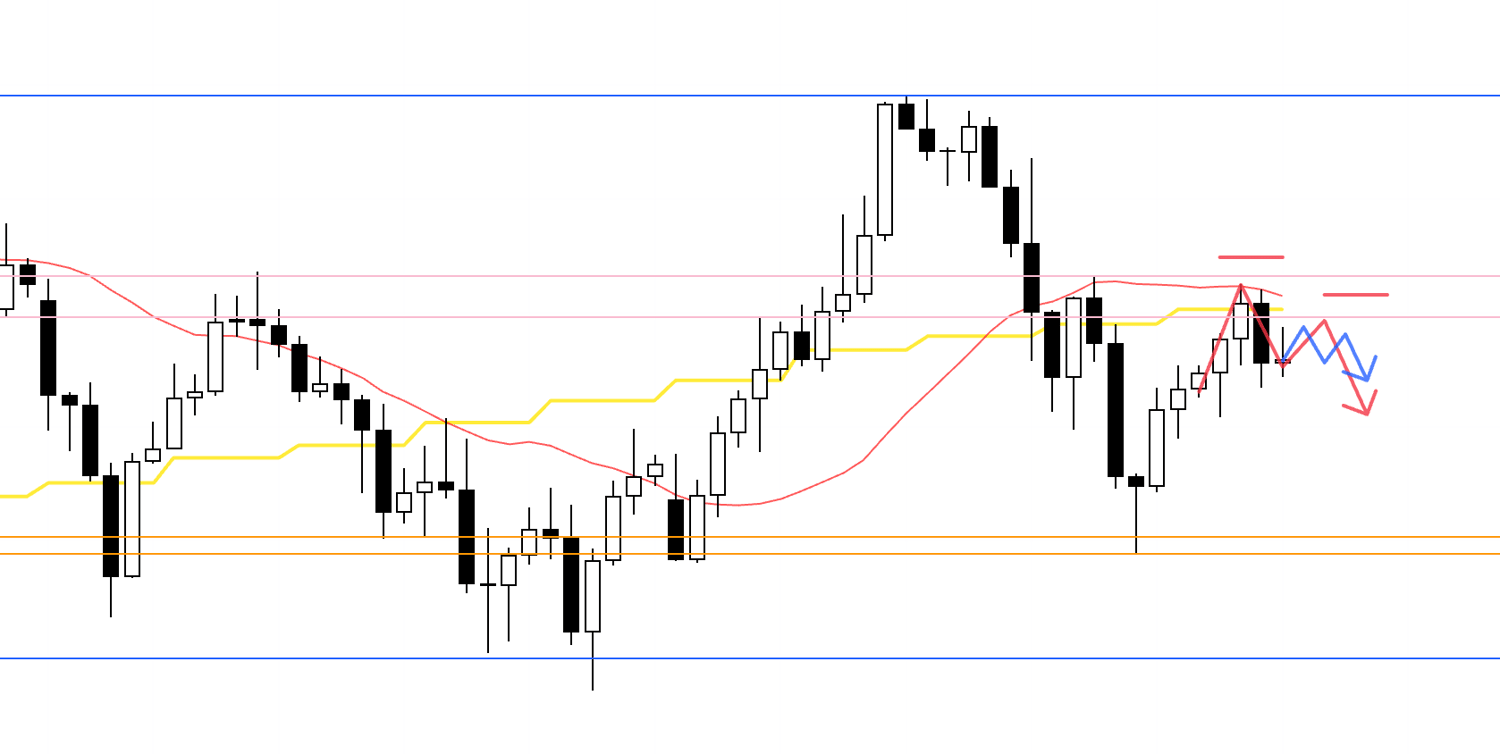
4h
If, for example, price were to rise in this way and move away from the yellow daily moving average, creating some room for a pullback to buy on the daily chart, then if the 4h chart were to roll over into a downtrend, I would consider shorting that move as the decline forming the daily pullback.
In that case, the daily chart is making higher lows and higher highs, so there are many traders waiting to buy the pullback, and the more price falls, the more traders will be thinking "I want to buy it once it gets cheaper", so we need to be careful.
Again, it comes down to whether an entry appears with an acceptable risk–reward, and if I do take a position, I will need to manage it by, for example, securing half the profit when price reaches key levels.
That’s all for now.
These are my scenarios as of now, and once the week actually starts I plan to keep updating and building them as I watch how price moves.
Both USDJPY and EURUSD are currently in phases where it is quite difficult to trade.
That said, as I have said many times, if you simply do not trade in difficult areas and only trade in easy areas, the idea of a "difficult trade" itself disappears.
What matters is whether you can judge "why the current environment is difficult", then work out "what would need to happen for it to become tradable", and build a scenario around that.
Once your scenario is set, there is nothing "difficult" about the actions themselves.
Even if that reduces the number of trades, you must keep waiting patiently for areas where you have an edge and only trade there.
Market conditions will not bend to your convenience, and if you think "I have to trade a lot to make money" and force trades in poor conditions, you will only make the path longer.
What matters is that, without rushing, you only trade where you need to, you take the necessary losses properly, and you are able to keep repeating that process.
These trade scenarios are purely my own plan, so if you have not yet settled on a trading approach, I hope you can use them as a reference when building your own strategy, but if your own trading is already established, please do not let my plan distract you and instead stick firmly to your own rules.
Thank you for reading to the end.
If this blog was helpful, my book will take your probabilistic thinking to the next level.
📚 Get your copy here👇