


Hello.
I’ll lay out my trading scenarios for the coming week.
I publish this “Trade Scenarios” blog every Sunday.
And every Saturday I post a “Weekly Trade Report” where I explain how I actually thought about the market and executed my trades during the week.
By reading this trading-scenario blog together with the Weekly Trade Report, I think you’ll be able to use my process as a practical reference for how to think ahead of time, what to wait for, and how to execute in a consistent way.
For the underlying strategy, please refer to my blog posts on Dow Theory and multi-timeframe analysis.
A “scenario” is not a forecast.
It is not a prediction, but my personal plan that says, “If the market does this, I will do that.”
I don’t try to predict the market, and this is not intended as such, so please keep that in mind.
Nor is this a set of instructions telling you what to buy or sell, or a service providing trading signals.
It does not guarantee any future profits; it is provided purely for educational purposes, using my own consistent process as the example.
I cannot take responsibility for any outcomes of the trades you place, so please trade at your own risk.
With that, let’s start with USDJPY.
(On my charts, the colors of the lines I draw represent each timeframe: orange for the daily, red for 4h, blue for 1h, and green for 15m.)
USDJPY
Daily
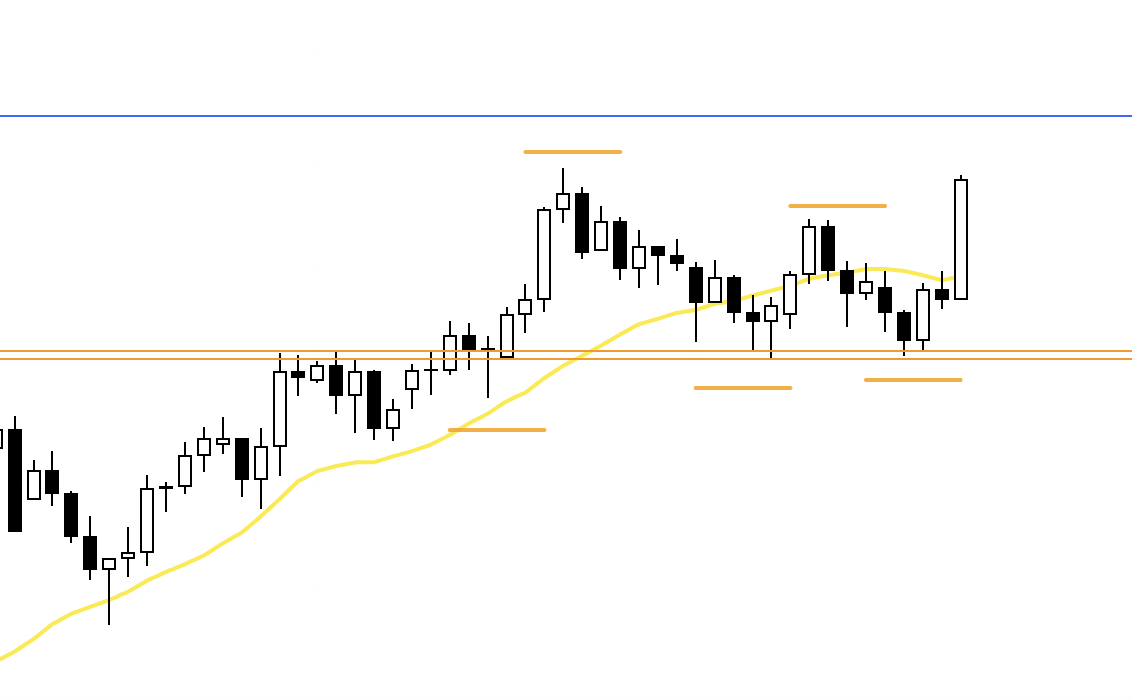
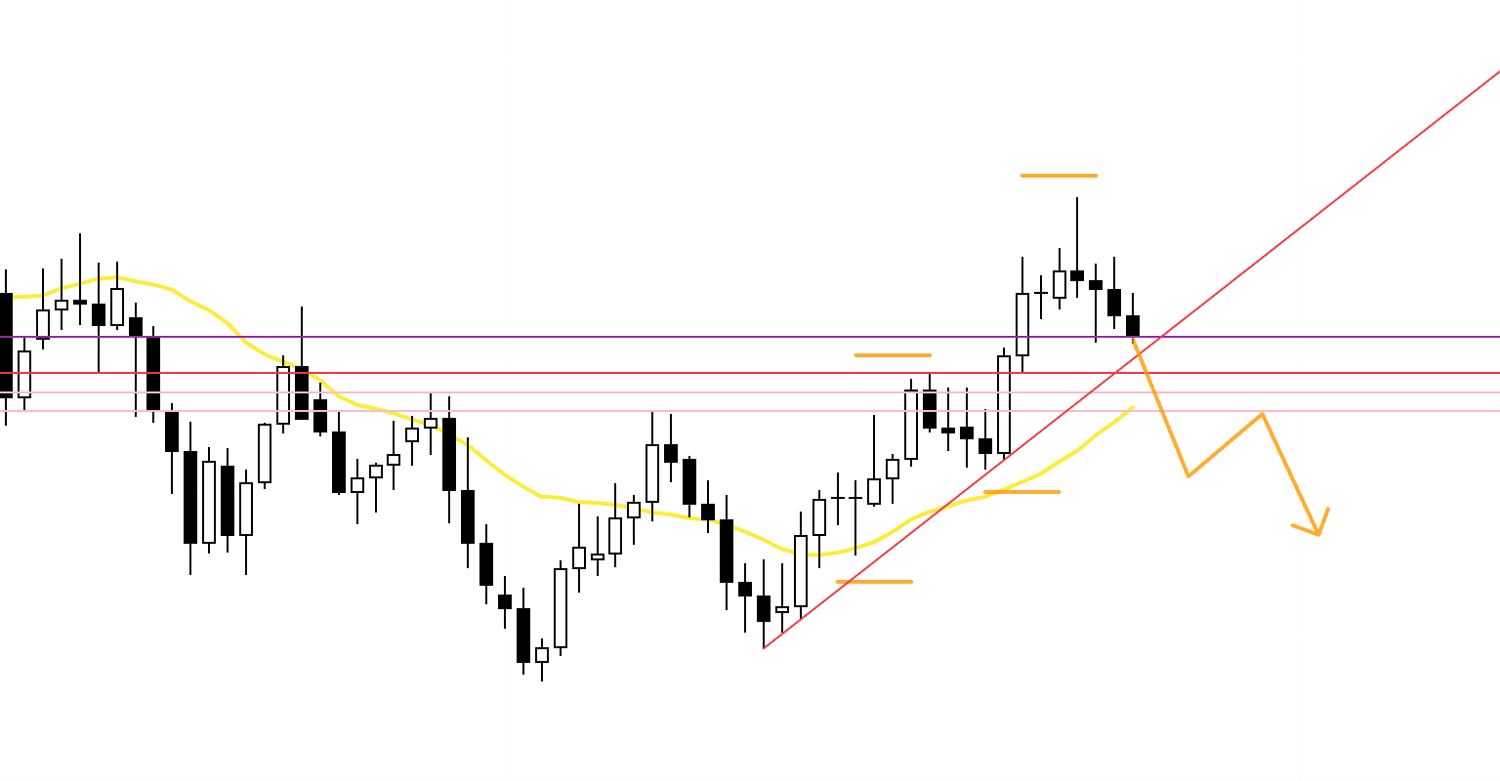
On the daily, highs have been stepping down, and it even looked like a break below the most recent low could trigger a shift into a downtrend, but the support line (orange) has held firm, and by clearing the latest high the uptrend has been maintained.
Now that the high has been broken, the market is in a “buy on dips” environment, so in principle I also want to look for pullback buys.
That said, the blue line drawn above is the prior weekly high, so I want to keep an eye on that level.
With those points in mind, let’s take a look at the 4h.
4h
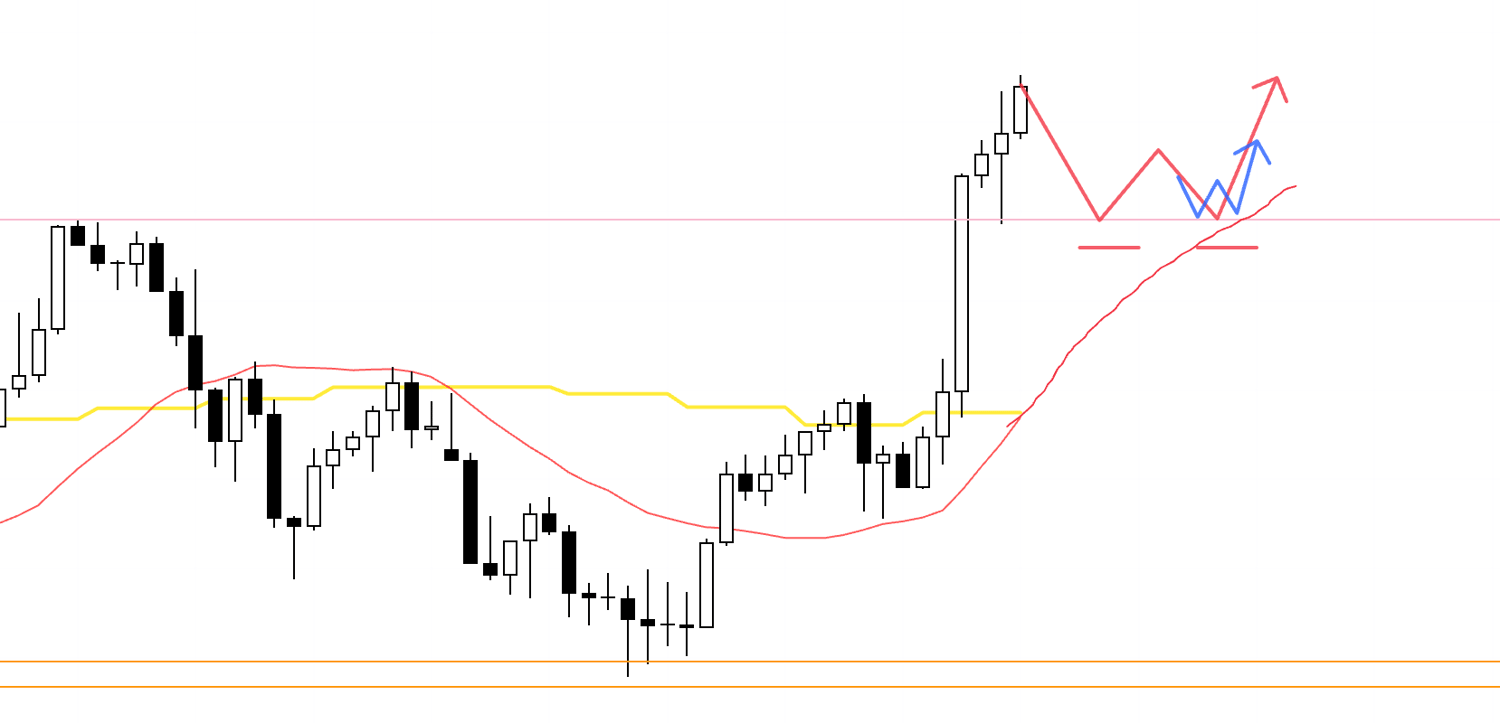
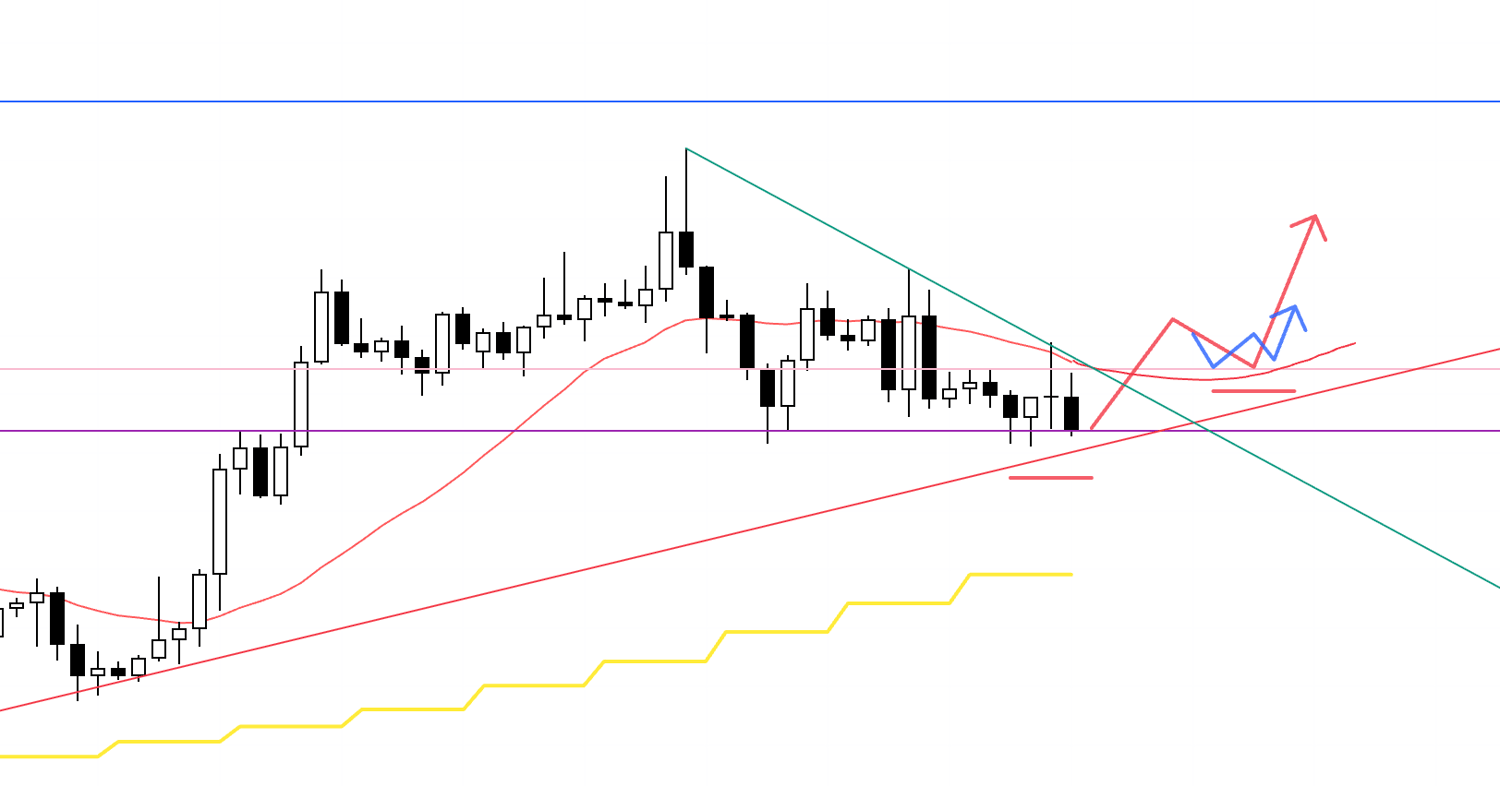
Within the 4h higher-low zones, if the lower timeframes also print a higher low and then take out the high, that’s where I want to consider a long.
However, on the 1h we’ve just seen a strong push up, and traders who are already long and sitting on unrealized gains are waiting for a moment to take profit (place sell orders), so buying immediately from here carries the risk of buying the top.
So even if the 4h forms a pullback, I won’t get involved unless the 1h trend has ended once.
I want to actively target the points where the current 1h uptrend ends, and then the market flips back into a fresh uptrend.
4h
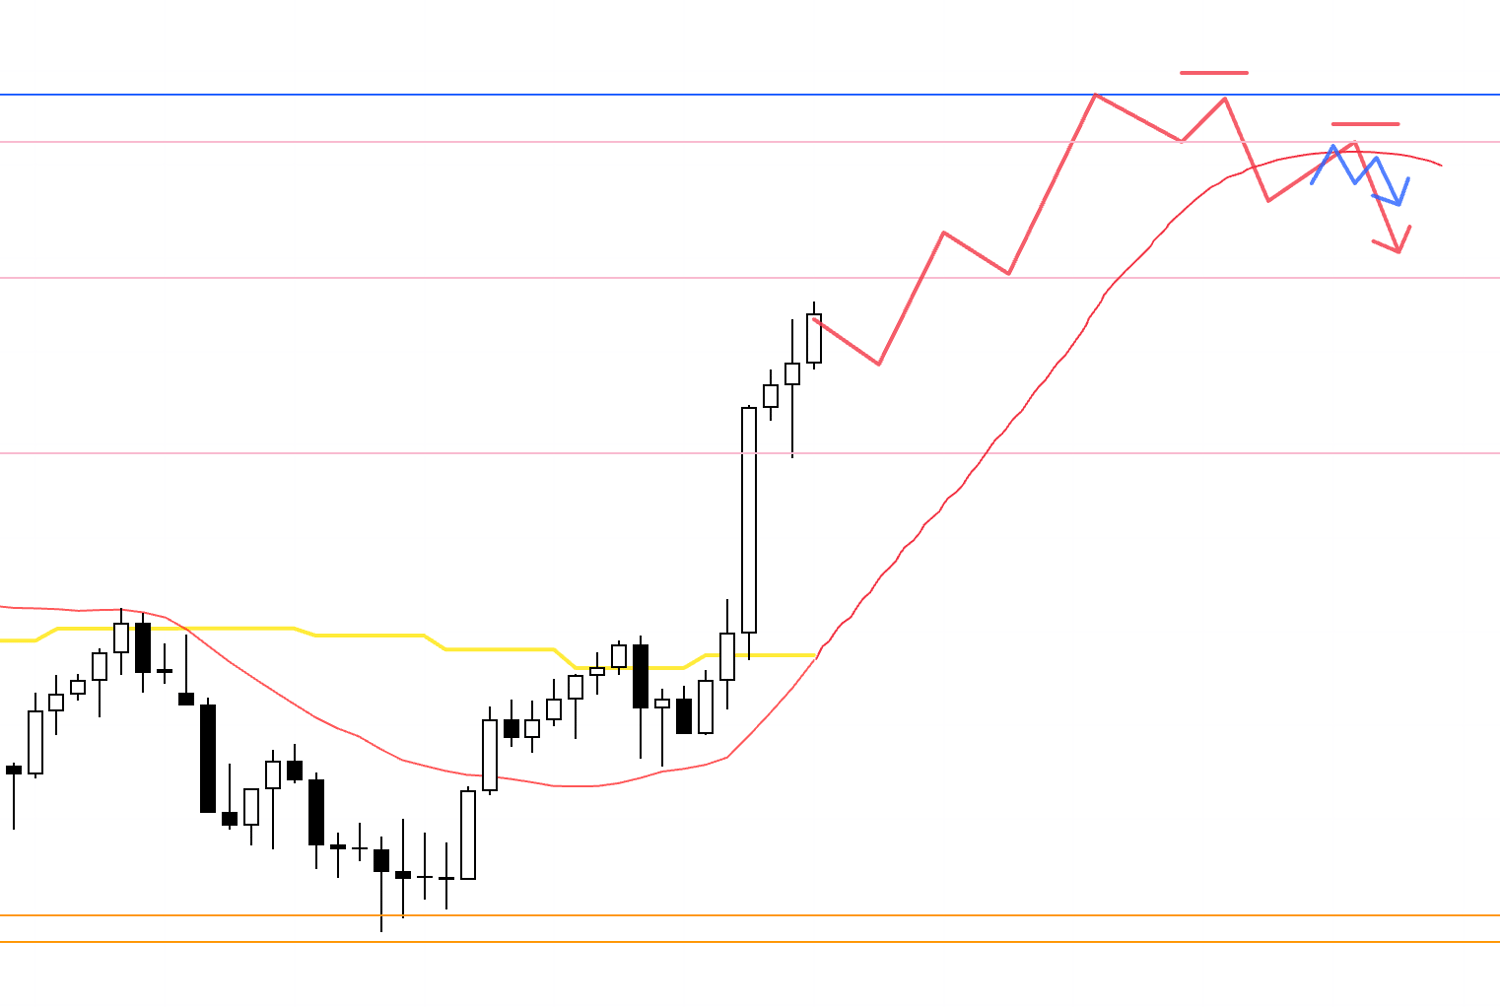
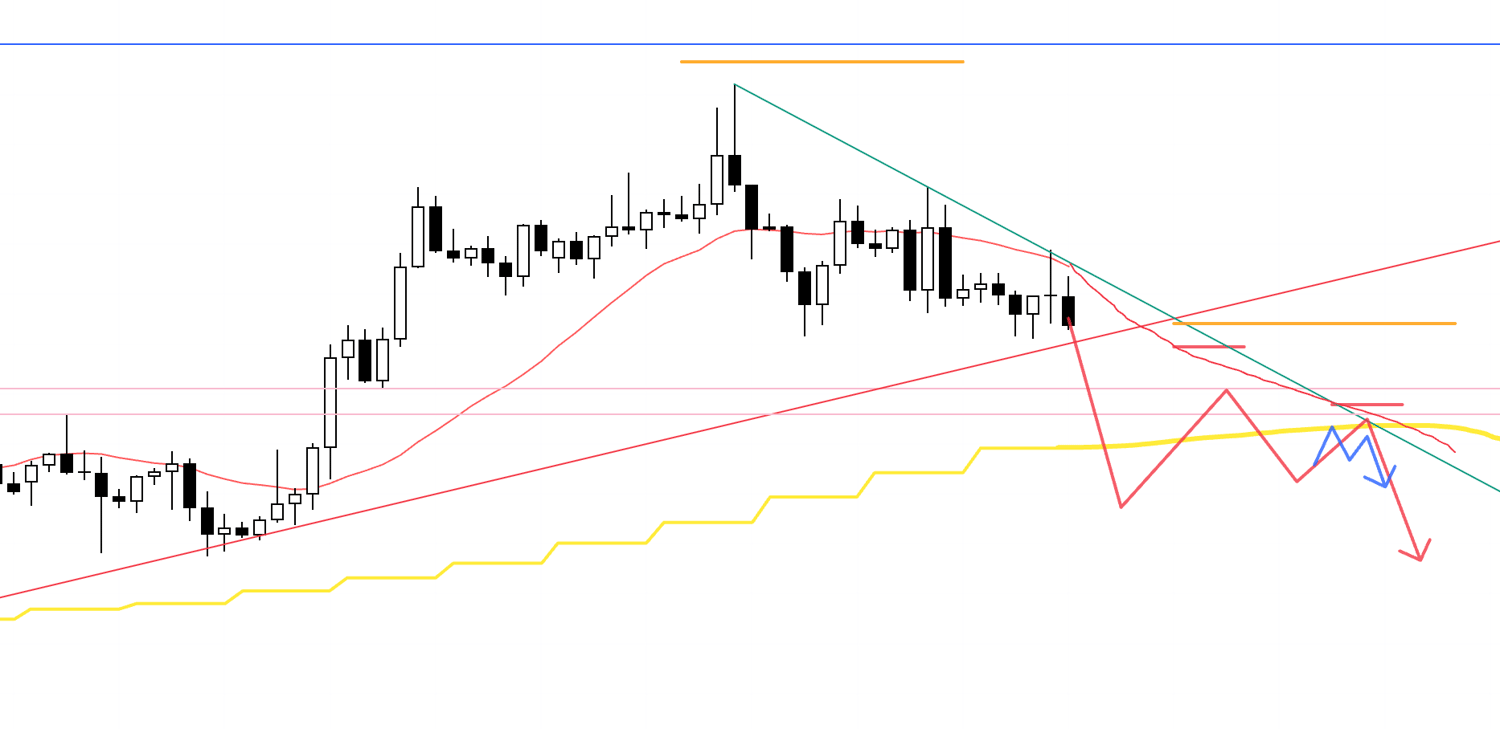
If we push higher from here and then, for example, get capped by a blue line like the one drawn above, and the 4h starts printing lower highs and shifts into a downtrend, then on the lower timeframes I will consider selling, following the drop that works off the gap to the daily moving average.
In that case, if the moving average is still supporting price from below, I won’t sell.
At a minimum, I want to see whether I can enter on a break below a moving average that has at least flattened out, or consider selling only if the moving average starts capping price from above.
And since the daily is in an uptrend, we need to keep in mind that this decline is “a drop to form a pullback on the daily.”
The deeper the drop, the more buying pressure tends to build, so I will watch for an entry that offers good risk/reward, and if I take a position, I will manage it by doing things like locking in half once we reach key levels.
Next, let’s look at EURUSD.
EURUSD
Daily
On the daily, the market is in an uptrend, making higher lows while taking out highs.
Right now it’s forming a pullback, so on the lower timeframes I want to consider buys where it flips back into an uptrend.
There are multiple support zones below, and we also haven’t started to put in lower highs, so it’s difficult to be thinking about shorts at the moment.
Daily
If the daily forms a lower-high point and a setup emerges where we can sell below these support zones, then I will consider shorts.
Now let’s look at the 4h.
4h
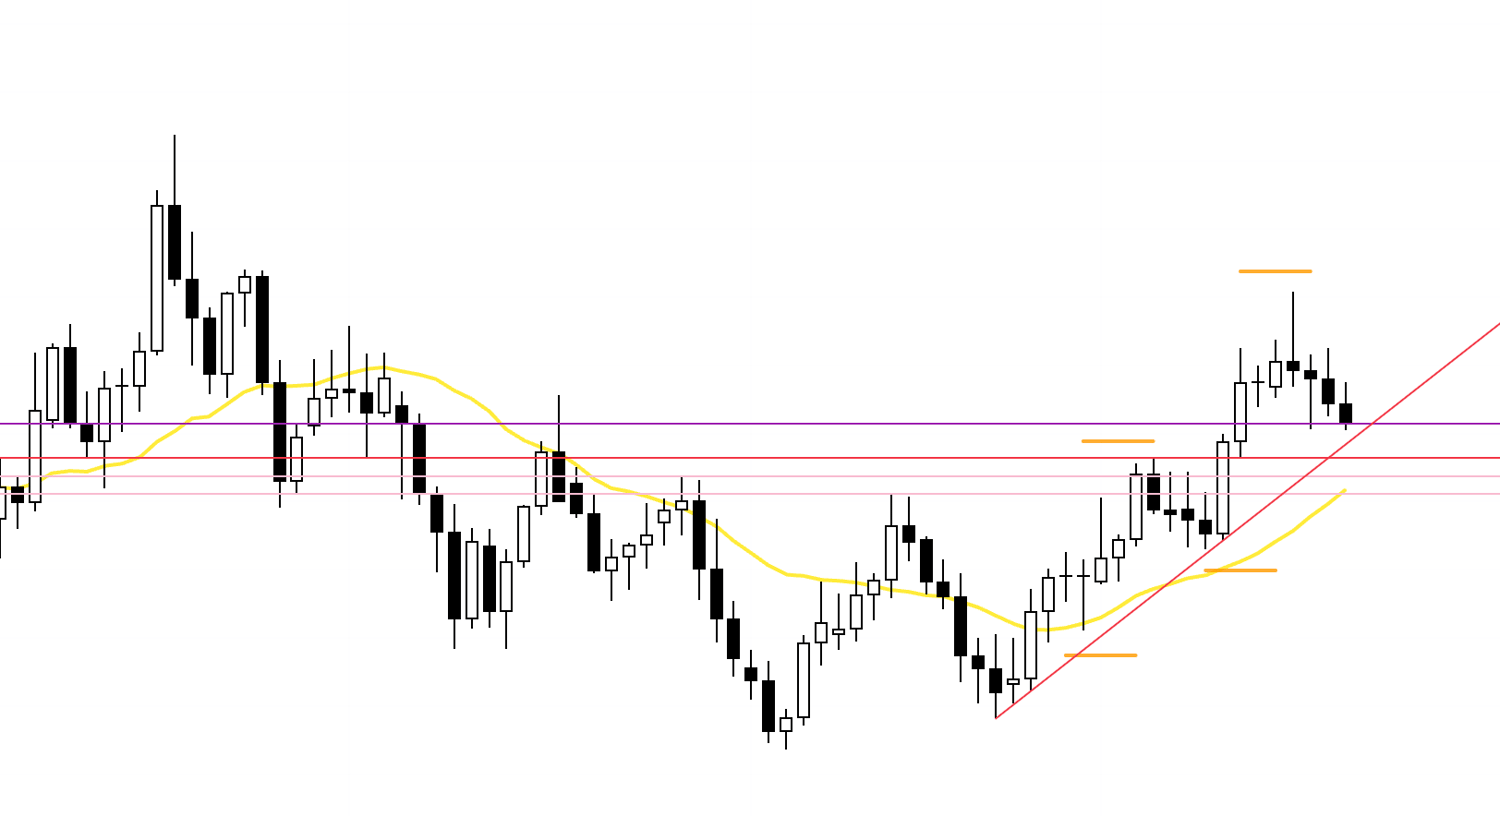
On the 4h, highs are stepping down while lows are being taken out, so it’s currently in a downtrend.
That said, this decline is a pullback within the daily uptrend, so points where it flips back into an uptrend align with the daily direction and give the long side an edge.
Right now we are near the trendline (red) connecting the lows that served as the starting point for the move that took out the daily high, and the 4h low is being supported by a support line (purple) that can be drawn from a prior high, so it hasn’t been able to break lower.
If this line continues to hold and the 4h forms a fresh higher-low point, then I will consider buys on the lower timeframes.
By the way, these trendlines are not something you use to predict that “it should hold.”
Some people will predict that “it should hold,” take a long the moment price touches the trendline, then get stopped out and complain that “trendlines don’t work,” but that is not what this is for in the first place.
You look at the fact that “price has held above this trendline and has been putting in higher lows,” and you use that as your basis.
Conversely, if it breaks, you look at the fact that “price broke this trendline and then started putting in lower highs as if it were being capped,” and you use that as your basis.
It is not something that reverses at the trendline every time, and a trendline does not promise you a reversal.
You have to remember that it is only a guide for understanding how other traders thought and behaved, based on the outcome.
4h
At the moment, the daily is in an uptrend, and there are also multiple support lines, so I can’t consider shorts right away.
For example, if it were to form a daily lower-high point like this, and also break below the daily moving average (yellow), then I would consider selling.
That’s it.
These are the scenarios as of now, and once the week starts, I want to update and build them as we watch what price actually does.
This trade scenario is simply my own plan, so if you still haven’t settled on your trading approach, I hope you can use it as a reference when building your own strategy, but if your trading is already established, don’t let my plan sway you, and make sure you stick to your own rules.
Thanks for reading all the way to the end.
If this blog was helpful, my book will take your probabilistic thinking to the next level.
📚 Get your copy here.