


In this report I will review the key points of my trading this week, focusing on the actual trades I took.
This Weekly Trade Report is published every Saturday.
When you read it together with Trade Scenarios, which I post every Sunday, I believe it will give you a useful reference for how I think in advance and how I actually execute trades based on those scenarios.
This is not advice saying “you should trade like this,” nor am I claiming that this is the correct answer.
It is not about showcasing individual winning or losing trades, nor is it about recommending a specific strategy based on those results.
My purpose is to show, at a practical level, how I repeatedly follow a consistent process based on pre-defined scenarios, and to offer that as a reference for your own strategy building and for achieving consistency in your process.
The outcomes I show are nothing more than my personal results, and they do not guarantee your future profits.
Please keep that firmly in mind, and when it comes to your own trading, make sure you carry out your own testing and preparation, and trade entirely under your own responsibility.
My trading is based on buying pullbacks and selling rallies on the 4h timeframe.
If you are interested in my pullback and rally strategy, please read my past blog posts on Dow Theory and multi-timeframe analysis.
Now, please take a look at the following charts.
USDJPY 4h
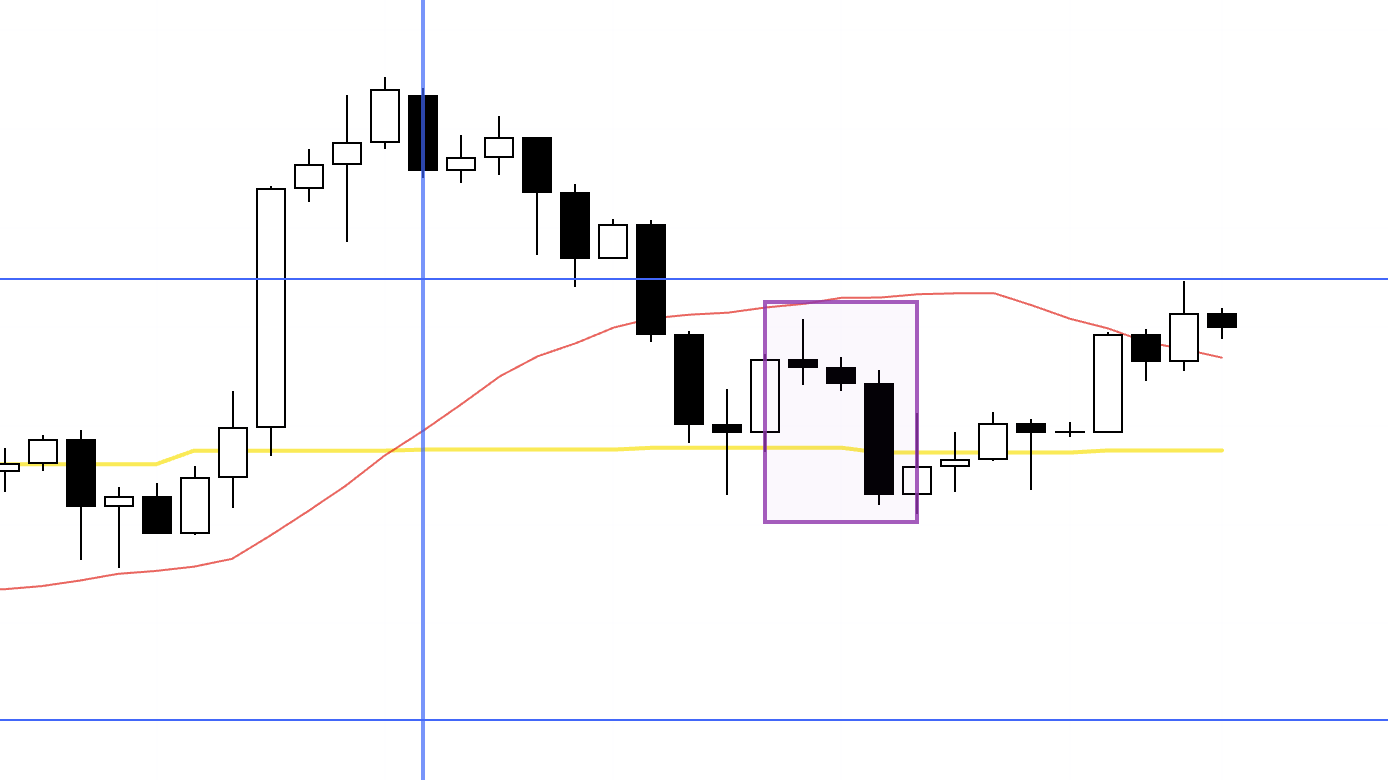
This is the USDJPY 4h chart.
This week’s price action begins from the point marked by the blue vertical line on the chart.
I did not place a single trade on USDJPY this week.
The area boxed on the chart is a 4h lower-high formation, and price is also being capped by the moving average (red), so under normal circumstances it would be a short setup.
However, in this context the daily chart is in an uptrend and this zone is a pullback-buying area, so I stayed out.
Let’s look at this area on the daily chart.
Daily
On the daily chart, you can see that recent highs have been broken and the market is in an uptrend, which makes it an environment where dips are likely to be bought.
The boxed area is precisely the kind of zone where daily pullback buying tends to step in, which means it is not a place where you can enter short.
If the daily chart had been in a downtrend and this same setup had appeared, it would have been a level where you needed to sell.
Next, take a look at the EURUSD chart below.
EURUSD 4h
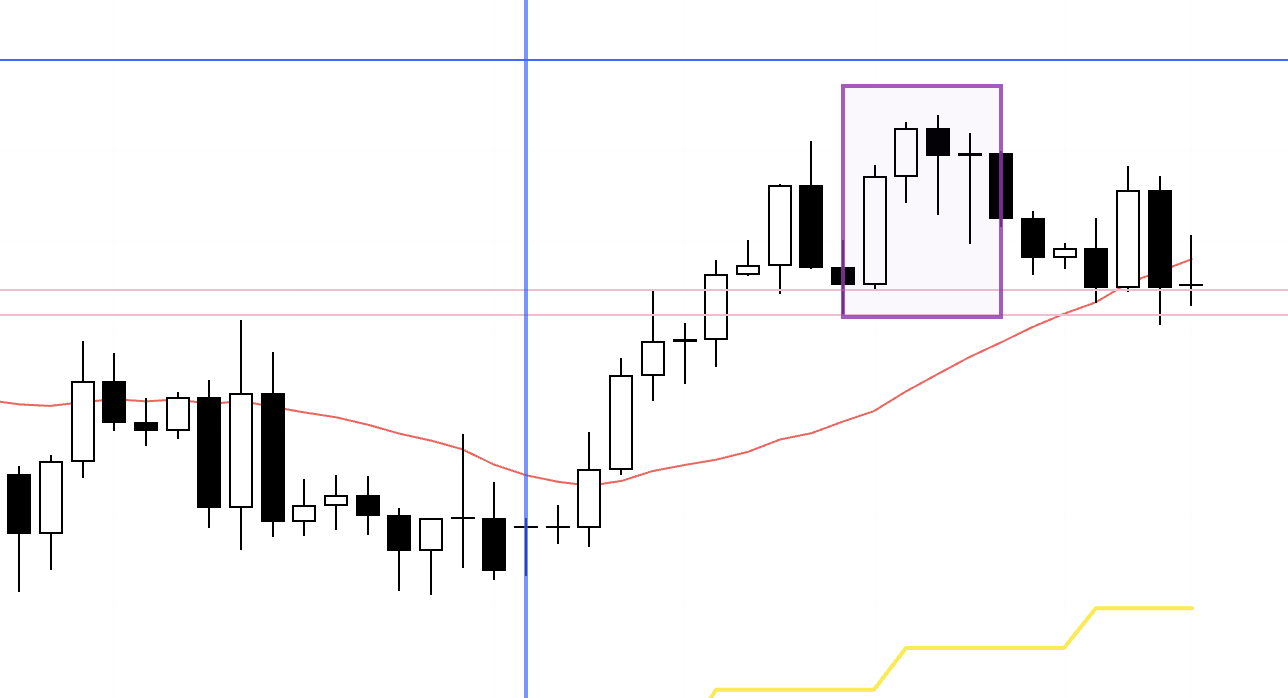
This is the EURUSD 4h chart.
I also couldn’t trade EURUSD this week.
The boxed area on the chart is a pullback-buying zone, so under normal circumstances it’s a level where I’d want to go long, but in Japan it was 3:00 a.m. and I was asleep—so by the time I woke up and checked the chart, price had already rallied.
Let’s look at this area on the 1h.
1h
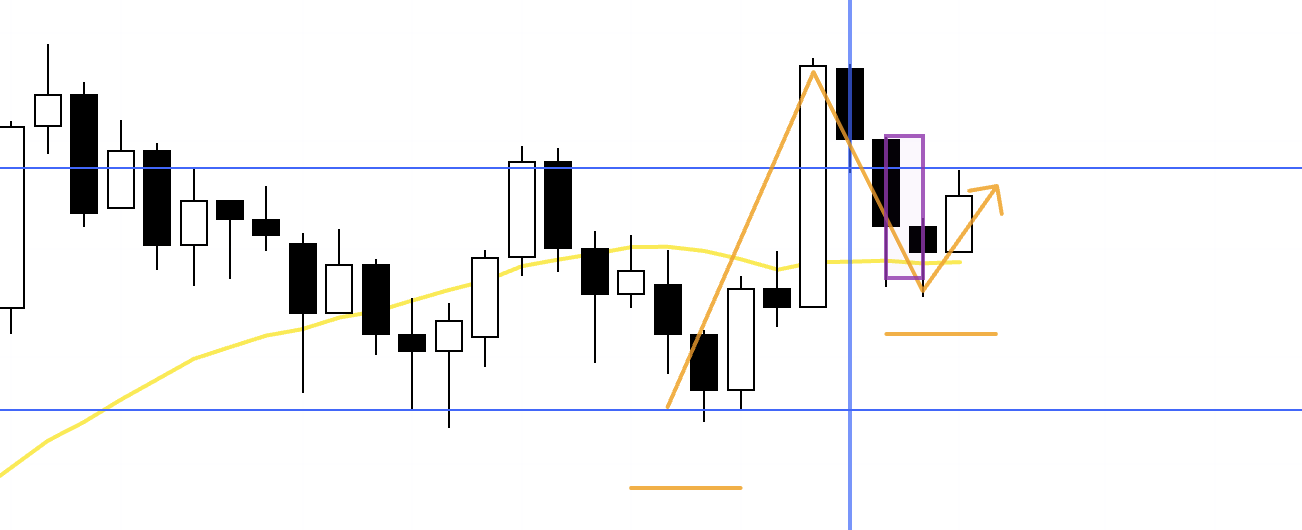
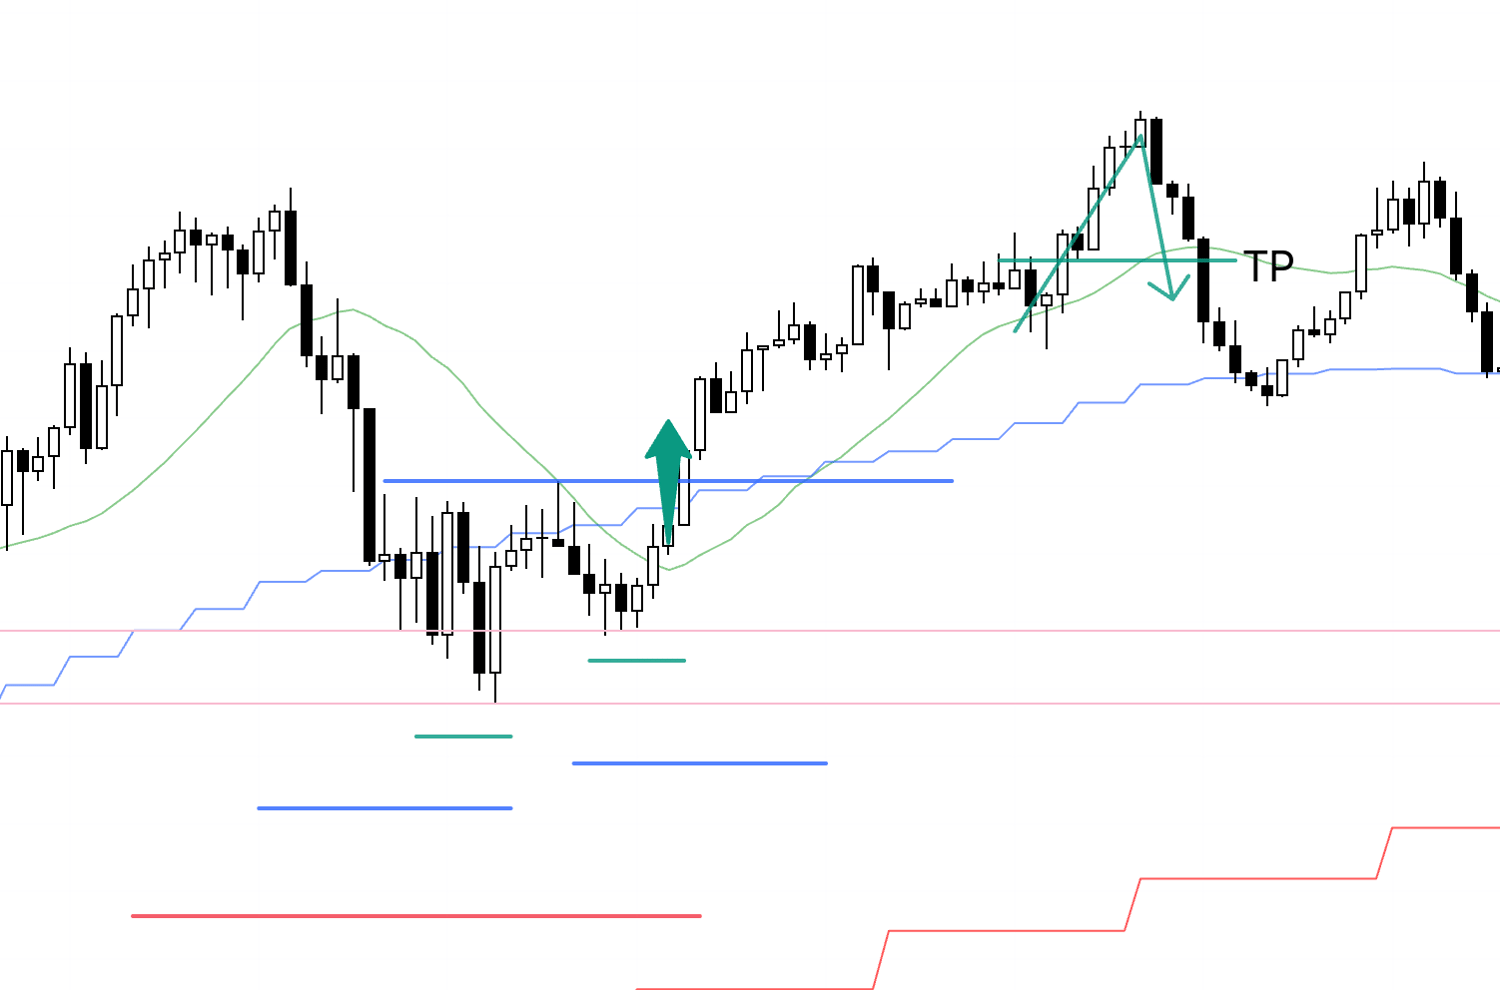
Within the 4h higher-low structure (red), the 1h lows are supported by prior highs and lows (pink lines), so the entry point is the breakout that takes out the most recent high (blue).
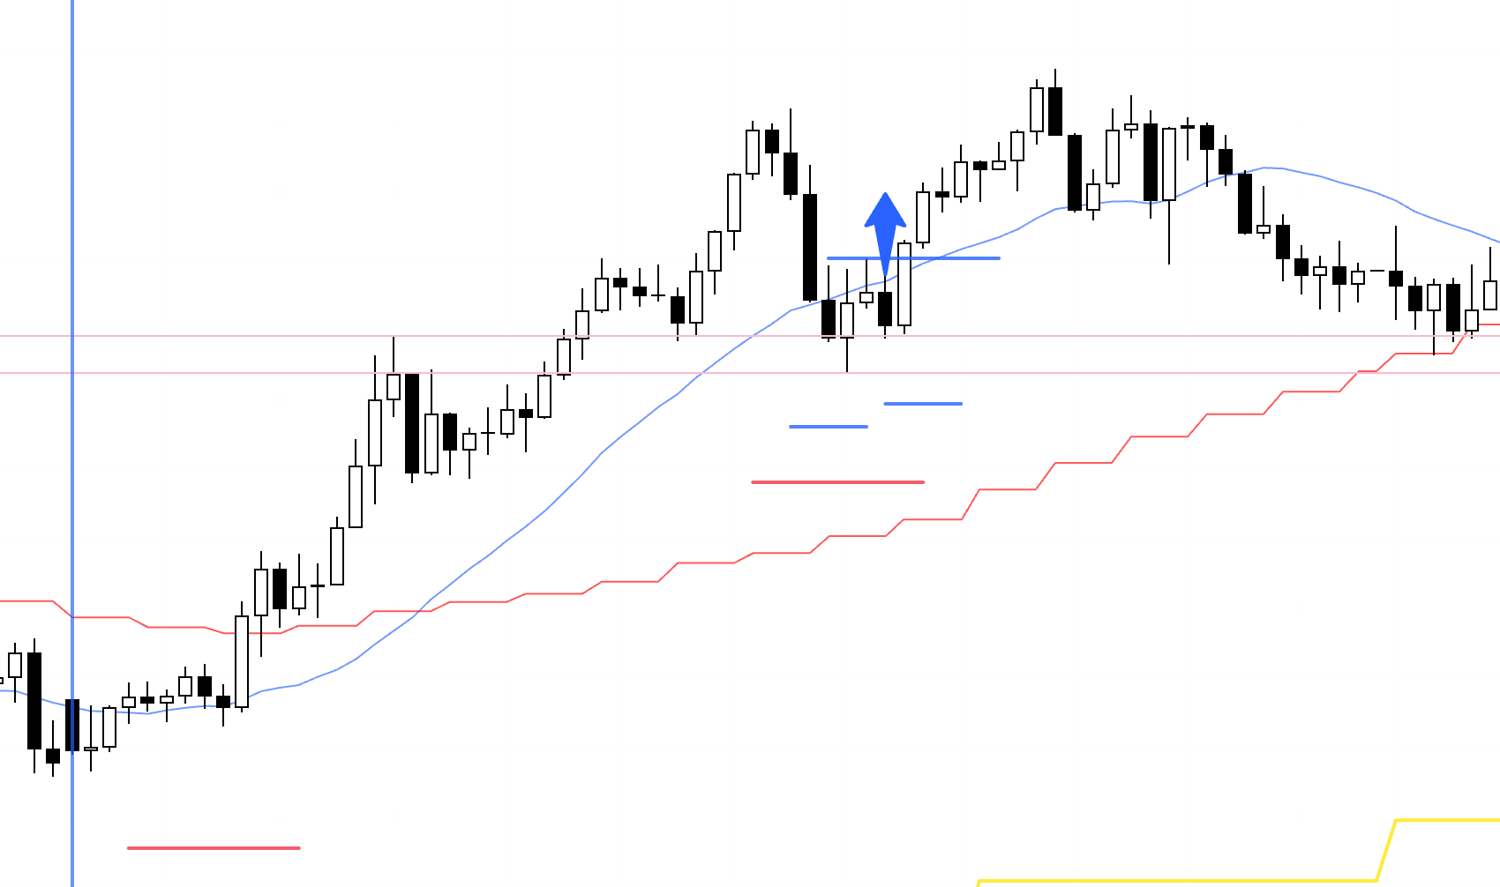
15m
On the 15m, it looks like this, and the entry remains the same—breaking above the high, just as on the 1h.
If I had taken the trade, I would have kept ratcheting up the trailing stop, and I think the trade would have ended when price broke the last low and hit that trailing stop.
That’s all.
In the end, just like last week, I wasn’t able to take a single trade this week either.
But I’m not trading for entertainment.
What matters is repeatedly executing the trades that are required, in accordance with your rules.
If you get involved in situations where you shouldn’t, you increase the risk of taking unnecessary losses—losses you never needed to take in the first place—and then you’re forced to “make them back” with other profits, which ultimately just slows everything down.
I will only participate when there is clear edge—never otherwise.
This is often misunderstood, but it’s not a matter of "patience."
It’s not that I’m "holding back even though I really want to trade."
Not trading where you shouldn’t is simply the obvious thing to do, and if you find yourself getting anxious despite doing the right thing, that means you don’t truly understand that action as "the right thing."
You’re mistakenly assuming that "placing trades" is more correct than waiting.
If you genuinely understand that doing nothing is sometimes the correct action, then you don’t need patience at all.
You’re simply doing what is correct.
You can’t control your trade frequency—it’s given to you by the chart.
Right now it’s the holiday season and year-end, banks are closed on certain days, spreads can widen, and there are stretches where the chart simply doesn’t offer clean entry points.
I don’t factor any of those events or news into my decisions at all, but they show up on the chart as a concrete lack of actionable entries, and as a result I can’t trade.
What I need to do has already been completed through extensive testing and practice with a massive sample size.
All that remains is to repeat it consistently—and I’ve been repeating it for years.
So I don’t panic just because I didn’t have an opportunity to trade for a week, and I don’t think "something is wrong" for a second, and there is no chance I would think "I should change something."
What matters is how thoroughly you prepared that strategy, how well you understand it, and "how far you can truly trust it."
In trading, everything is decided by the depth of that preparation.
Thank you for reading to the end.
I hope my blog can provide hints for those who are about to build a strategy, and for those who are struggling because they can’t achieve consistency.
If this blog was helpful, my book will take your probabilistic thinking to the next level.
📚 Get your copy here.