


In this report I will review the key points of my trading this week, focusing on the actual trades I took.
This Weekly Trade Report is published every Saturday.
When you read it together with Trade Scenarios, which I post every Sunday, I believe it will give you a useful reference for how I think in advance and how I actually execute trades based on those scenarios.
This is not advice saying “you should trade like this,” nor am I claiming that this is the correct answer.
It is not about showcasing individual winning or losing trades, nor is it about recommending a specific strategy based on those results.
My purpose is to show, at a practical level, how I repeatedly follow a consistent process based on pre-defined scenarios, and to offer that as a reference for your own strategy building and for achieving consistency in your process.
The outcomes I show are nothing more than my personal results, and they do not guarantee your future profits.
Please keep that firmly in mind, and when it comes to your own trading, make sure you carry out your own testing and preparation, and trade entirely under your own responsibility.
My trading is based on buying pullbacks and selling rallies on the 4h timeframe.
If you are interested in my pullback and rally strategy, please read my past blog posts on Dow Theory and multi-timeframe analysis.
Now, please take a look at the following charts.
USDJPY 4h
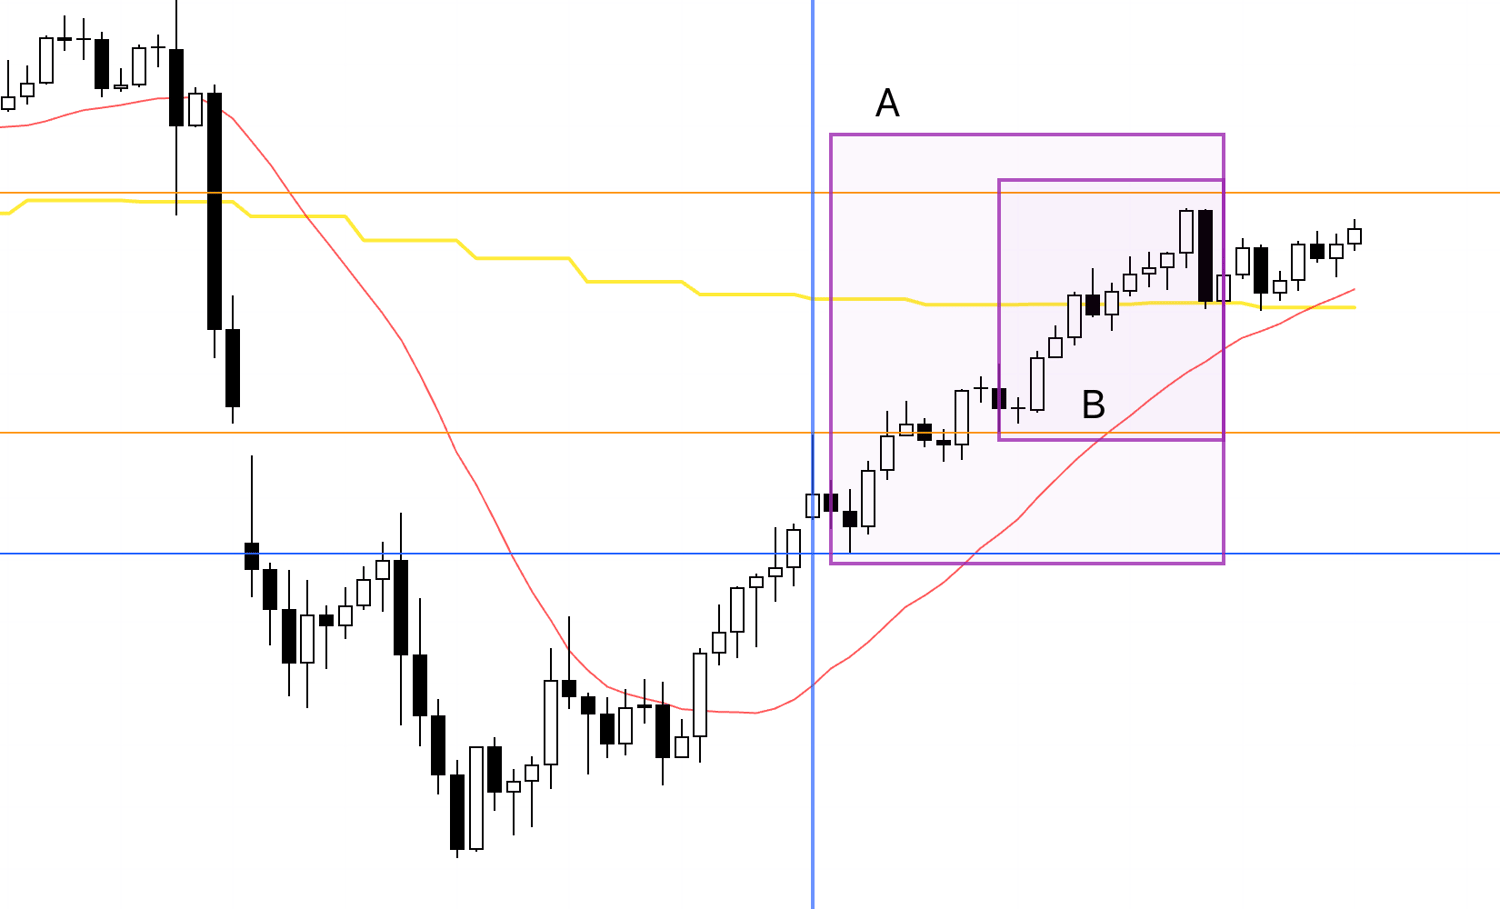
Here is the 4h chart of USDJPY.
This week's price action begins after the blue vertical line shown on the chart.
There were two points on USDJPY where a long entry could have been considered.
1h
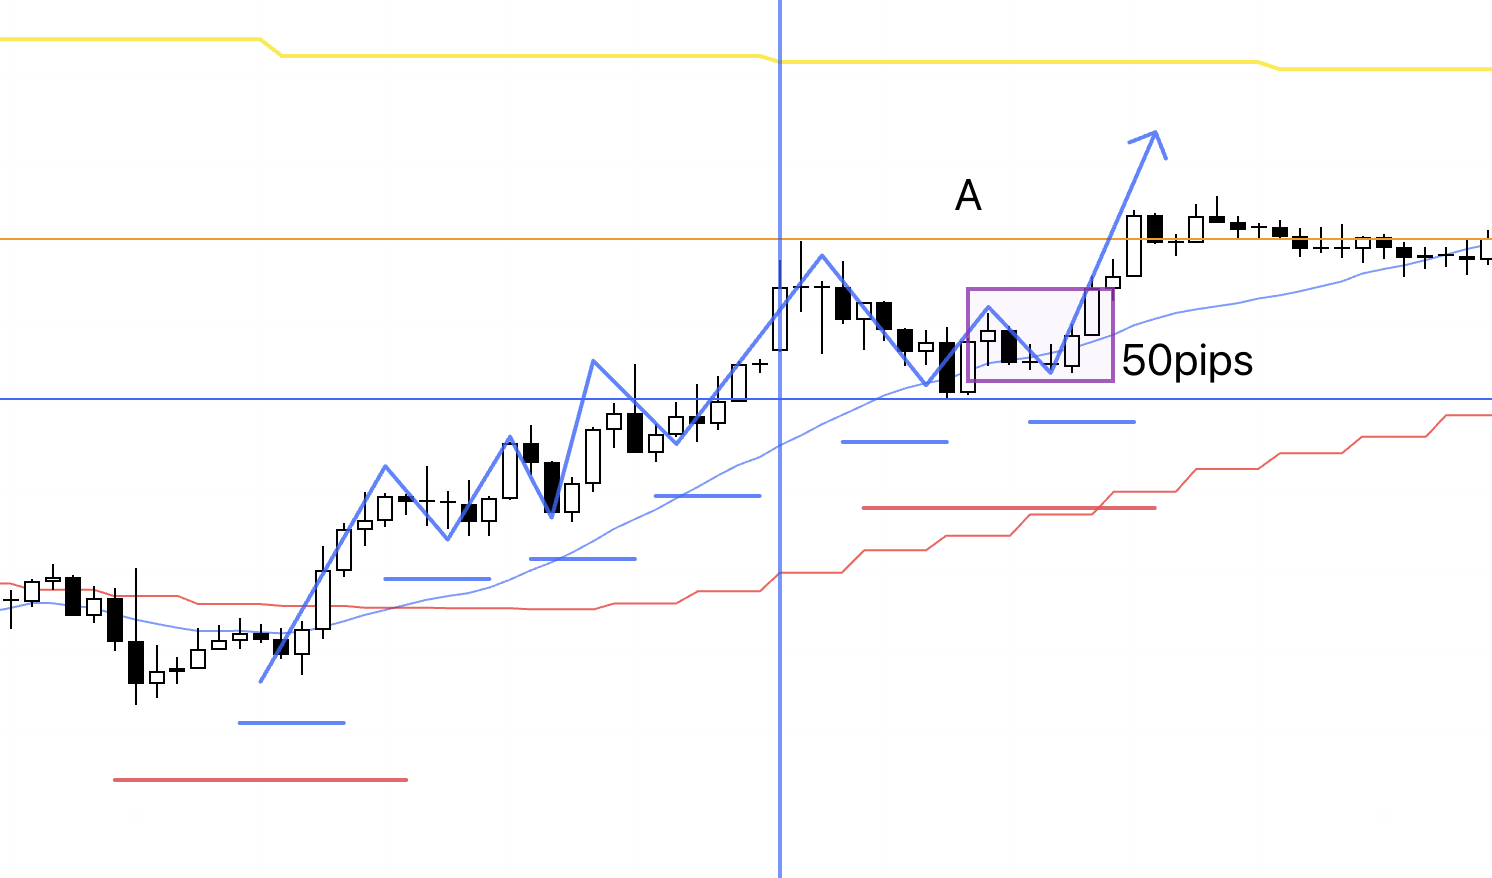
First, regarding the 4h pullback buy point at A — this area is supported by the blue line, and at first glance, it looks tempting to enter.
However, by this point, the 1h had already formed a series of higher lows multiple times (blue arrows), meaning it was already well into an established uptrend.
On top of that, the distance between the most recent high and the swing low from which it originated is roughly 50 pips (the area highlighted in the purple rectangle), making the stop-loss width extremely wide.
I have a personal rule to pass on any trade where the stop-loss exceeds 50 pips, and given that the 1h trend was already mid-move, taking a position here would constitute a very poor trade.
As it turned out, price continued to rise from that point — but that was simply what happened this time around.
If you start taking trades under conditions like these, your win rate and risk-reward ratio will deteriorate over time.
1h
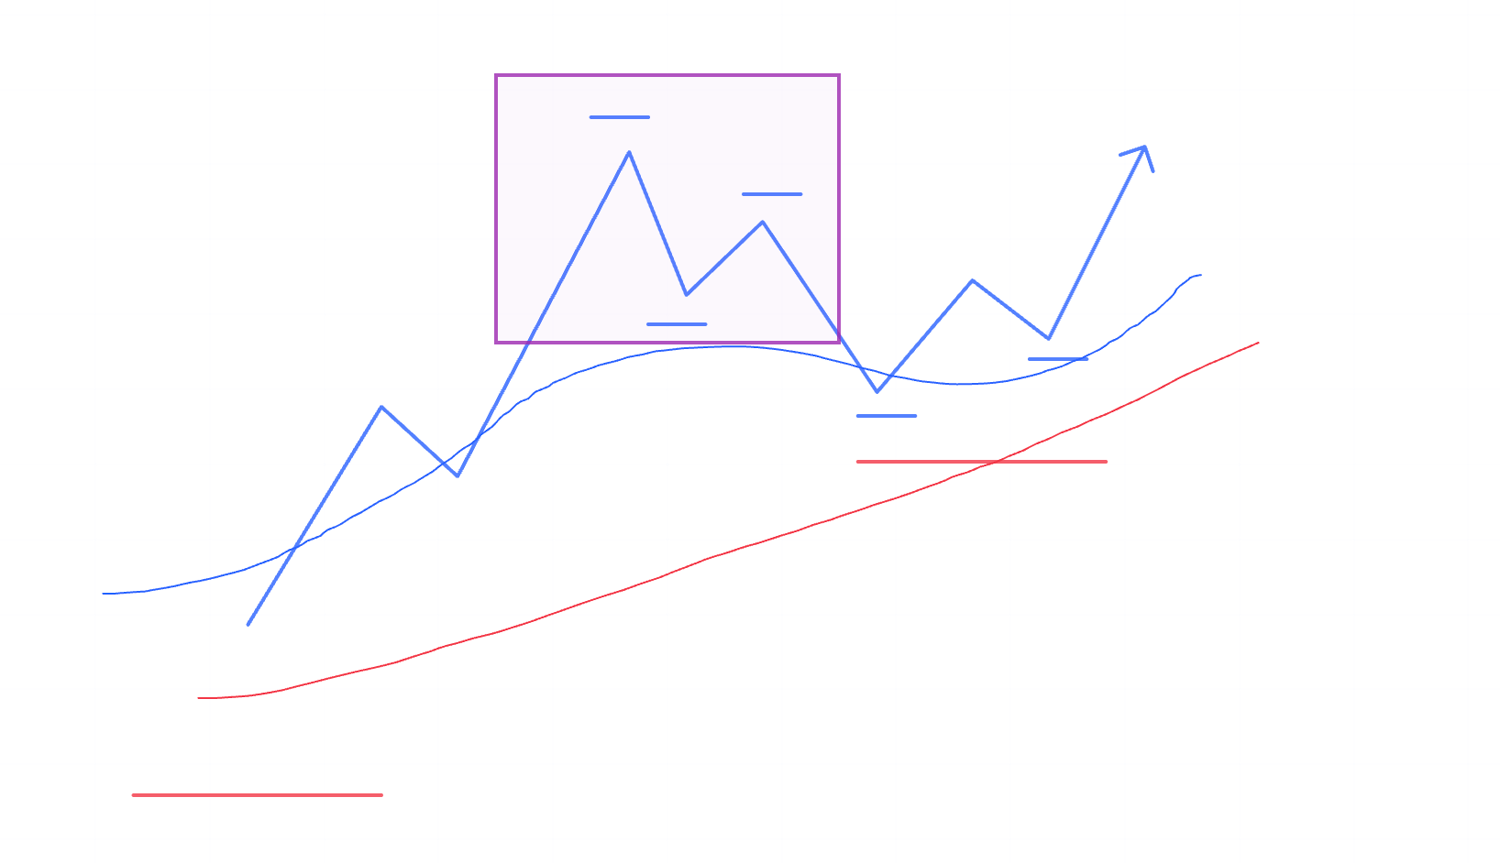
For instance, what I look for is a point like this — where the uptrend that had been running on the 1h is broken once, and then price begins forming higher lows and making new highs again, with a manageable stop-loss width.
If such a setup presents itself, I take the trade.
1h
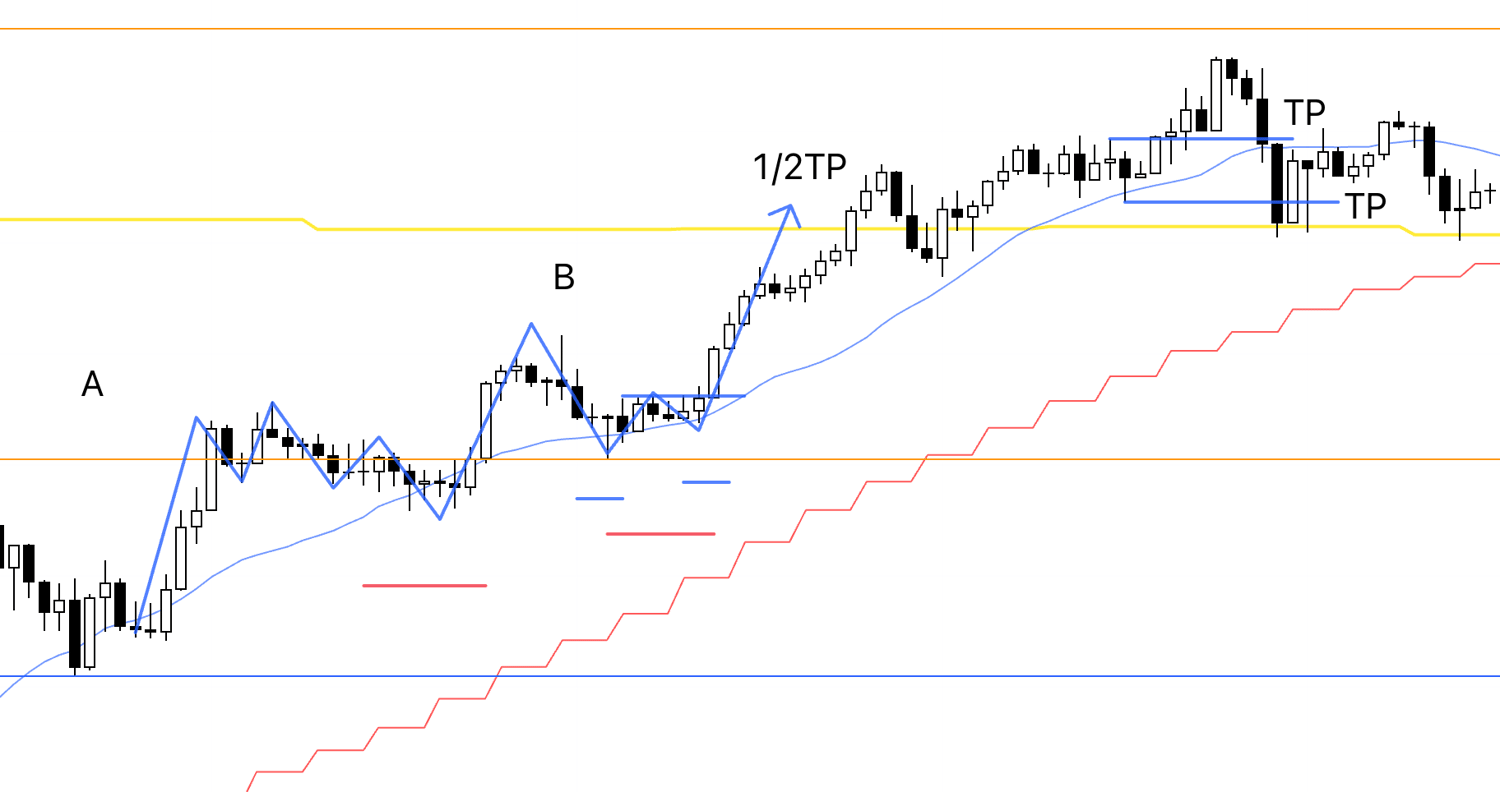
Next is point B.
This is a higher-low, higher-high formation that appeared after the 1h trend had been broken, so it qualifies as a point to consider going long.
However, on this particular day, I needed to take a family member to the hospital in the morning and was unable to trade.
Had I taken this trade, given that it runs counter to the daily trend, I would likely have locked in partial profits near the daily moving average (yellow) visible above, and closed the remaining position once price broke below one of the two levels marked with blue lines.
Now, please take a look at the following EURUSD chart.
EURUSD 4h
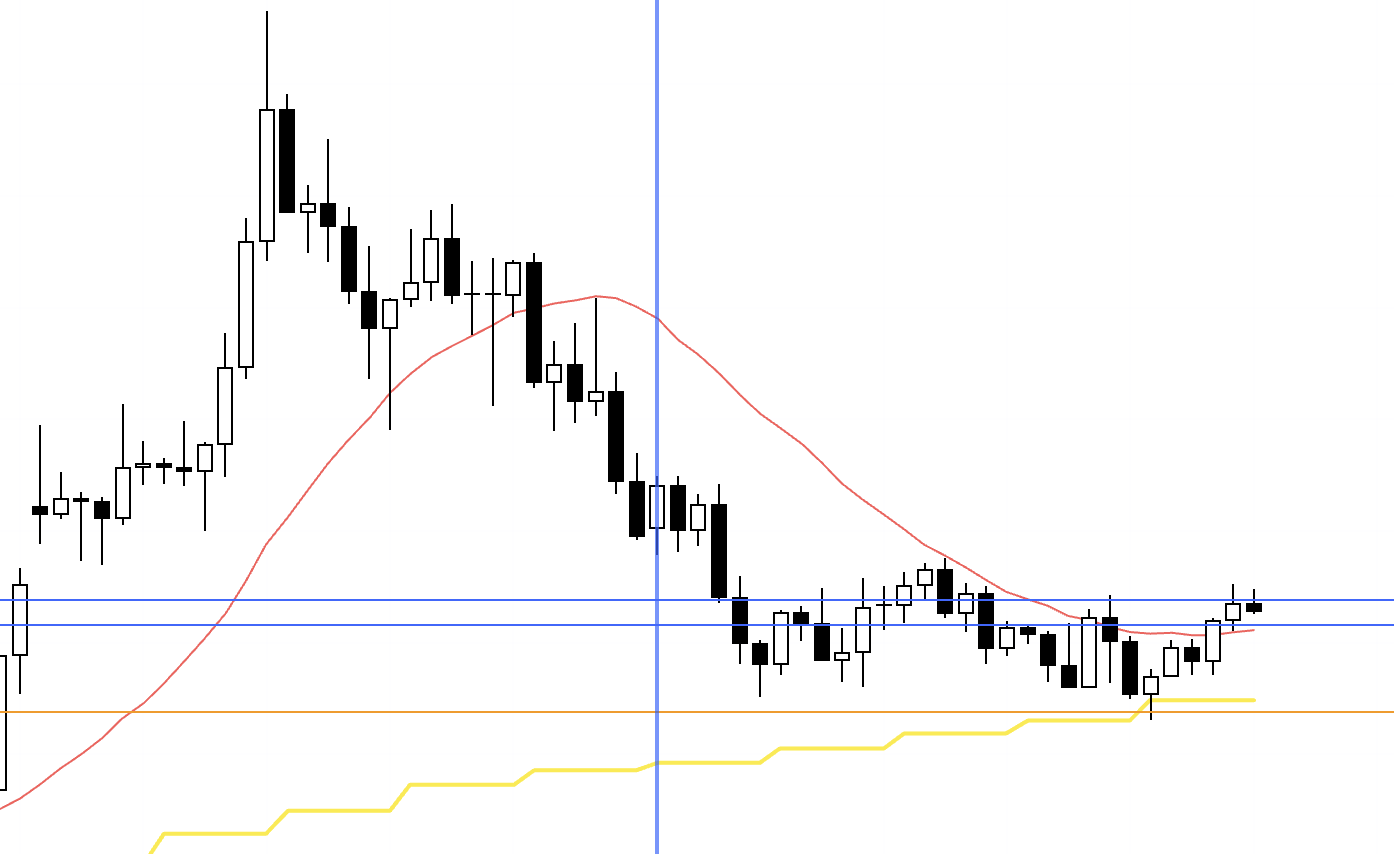
Here is the 4h chart of EURUSD.
EURUSD offered absolutely no points worth considering for a trade this week.
The daily timeframe is in an uptrend, so I was watching for the 4h to break above the moving average (red) and form a higher-low structure — which would have given me a reason to ride the upside as a daily pullback buy.
No such setup materialized.
At the same time, trying to ride the downside of a daily pullback was also difficult, given the proximity of key resistance lines and the daily moving average (yellow).
So this week was a pass.
That is all for this week.
You might think I am extraordinarily patient in waiting for setups, but I do not trade for the enjoyment of it, and I have absolutely zero urge to trade — so there is no sense of "patiently waiting" on my part.
I am simply repeating the work that needs to be done, and whether I trade or not is just one part of that work.
This is not an exaggeration in the slightest — it truly feels like nothing more than routine work.
Many traders fall into the trap of thinking, "if I don't trade, I can't make money," and rush into unnecessary trades out of anxiety.
But our objective is not to trade for the sake of trading — it is to grow our capital through trading.
Waiting means extracting only those moments that align with your rules and scenarios.
Our job as traders is to keep executing a pre-tested strategy over and over, allowing the law of large numbers to work across a sufficiently large sample size to draw out our edge.
We must never lose sight of this purpose.
Thank you for reading to the end.
I hope my blog serves as a useful reference for those who are working to build their own strategy, or for those struggling to find consistency in their trading.