

In this report I will review the key points of my trading this week, focusing on the actual trades I took.
This Weekly Trade Report is published every Saturday.
When you read it together with Trade Scenarios, which I post every Sunday, I believe it will give you a useful reference for how I think in advance and how I actually execute trades based on those scenarios.
This is not advice saying “you should trade like this,” nor am I claiming that this is the correct answer.
It is not about showcasing individual winning or losing trades, nor is it about recommending a specific strategy based on those results.
My purpose is to show, at a practical level, how I repeatedly follow a consistent process based on pre-defined scenarios, and to offer that as a reference for your own strategy building and for achieving consistency in your process.
The outcomes I show are nothing more than my personal results, and they do not guarantee your future profits.
Please keep that firmly in mind, and when it comes to your own trading, make sure you carry out your own testing and preparation, and trade entirely under your own responsibility.
My trading is based on buying pullbacks and selling rallies on the 4h timeframe.
If you are interested in my pullback and rally strategy, please read my past blog posts on Dow Theory and multi-timeframe analysis.
Now, please take a look at the following charts.
USDJPY 4h

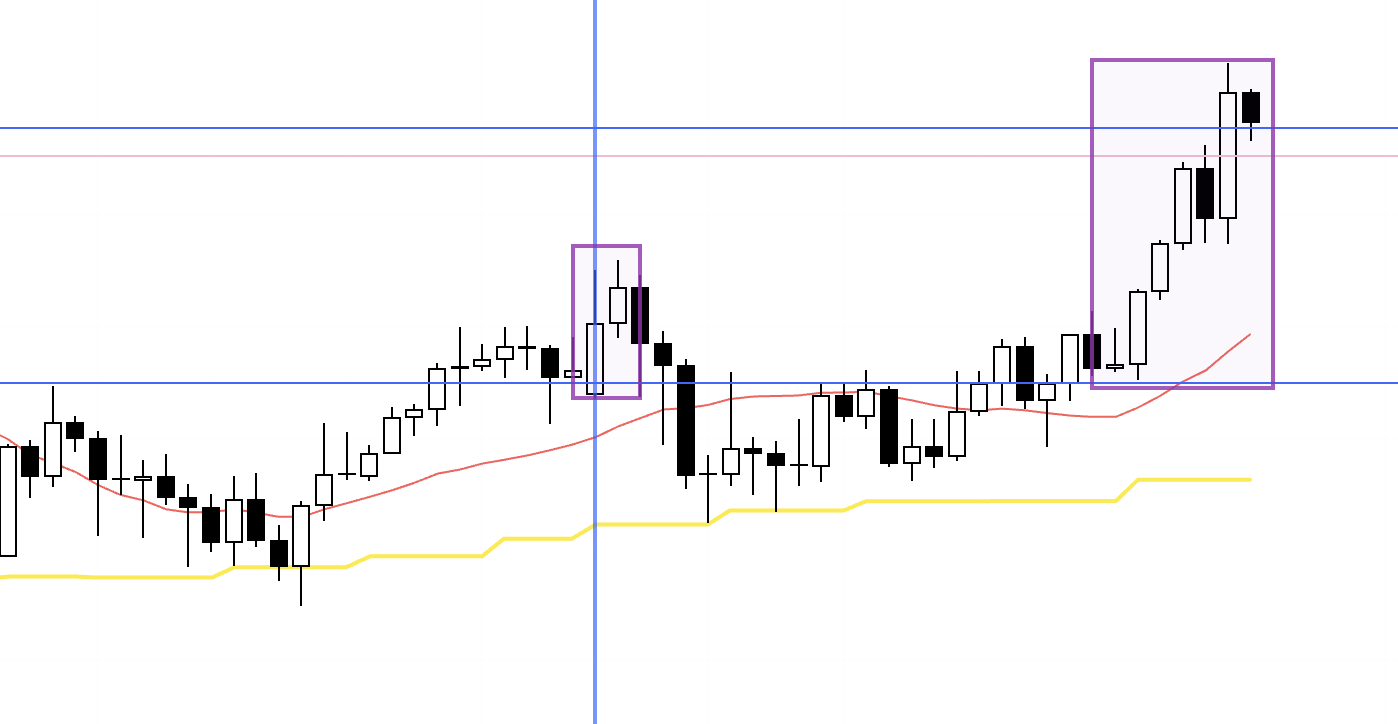
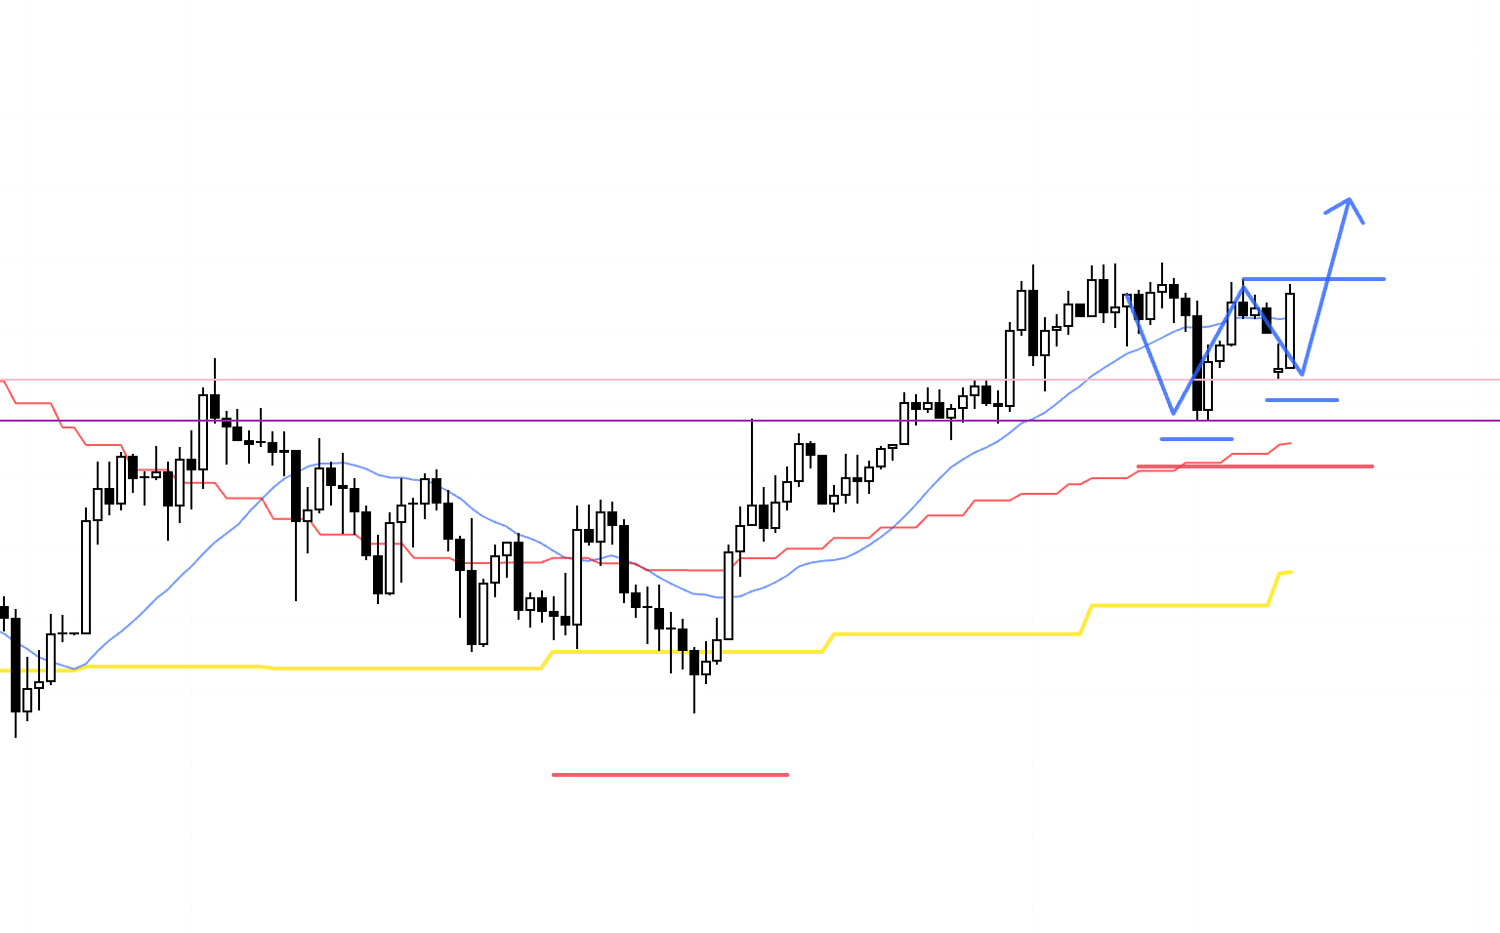
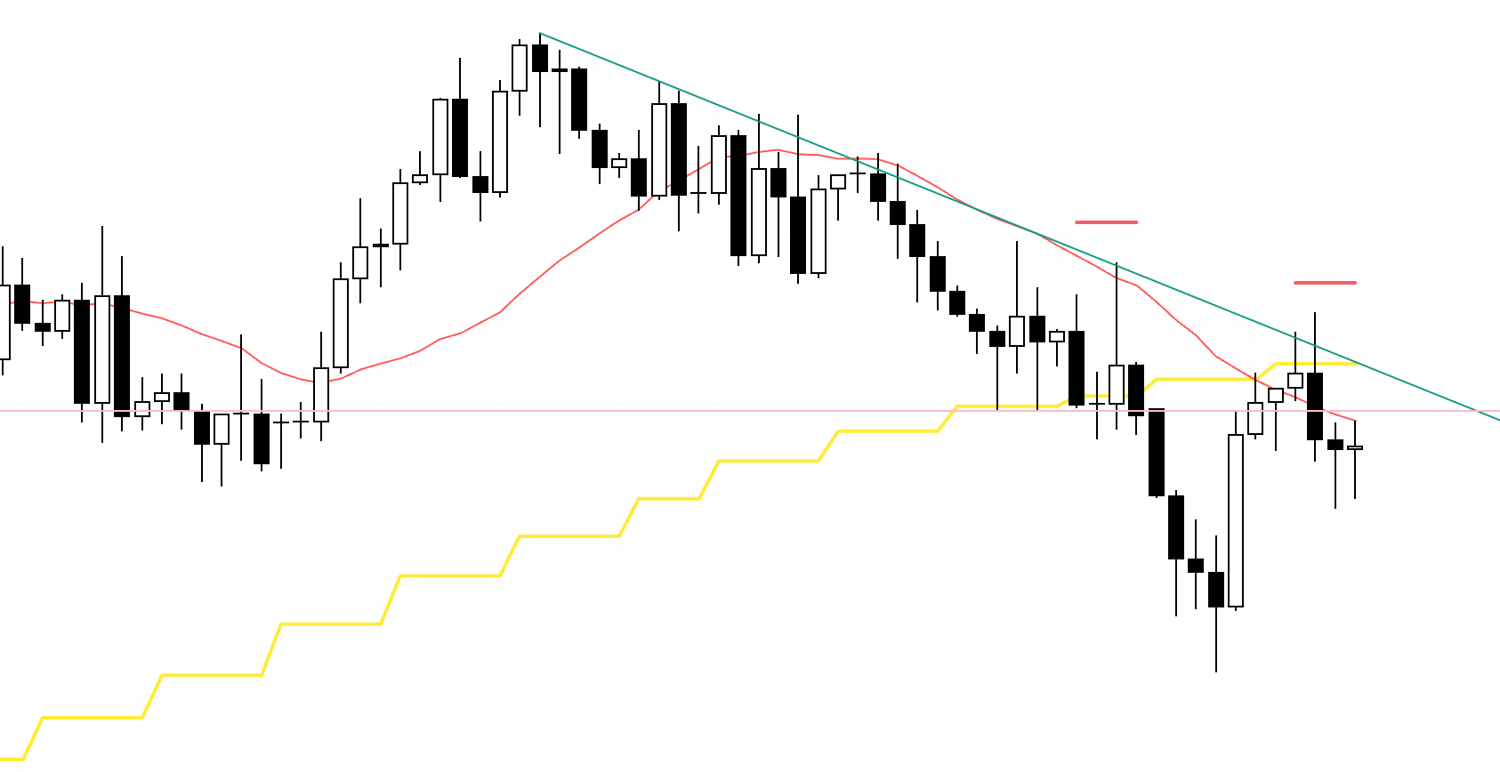
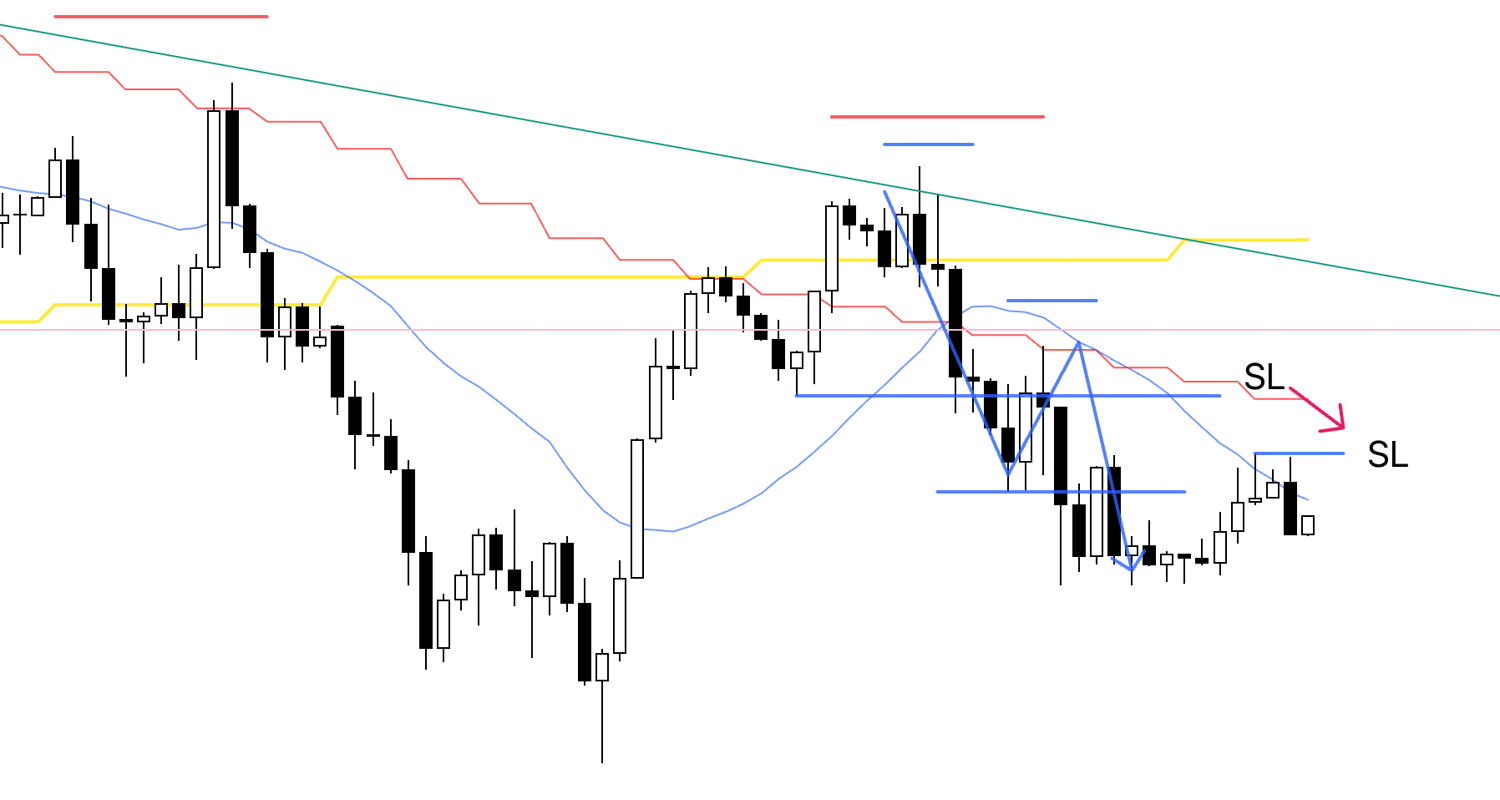
This is the USDJPY 4h chart.
This week’s move is from the blue vertical line onward, as shown on the chart.
I took two trades in USDJPY this week.
As I noted in last Sunday’s scenario blog, I was looking to buy at a point where the 4h prints a higher low and holds as support on this blue line.
These trades were recorded in real time with my thoughts and actions in the moment, so I’ll share them later.
Next, please take a look at the EURUSD chart below.
EURUSD 4h
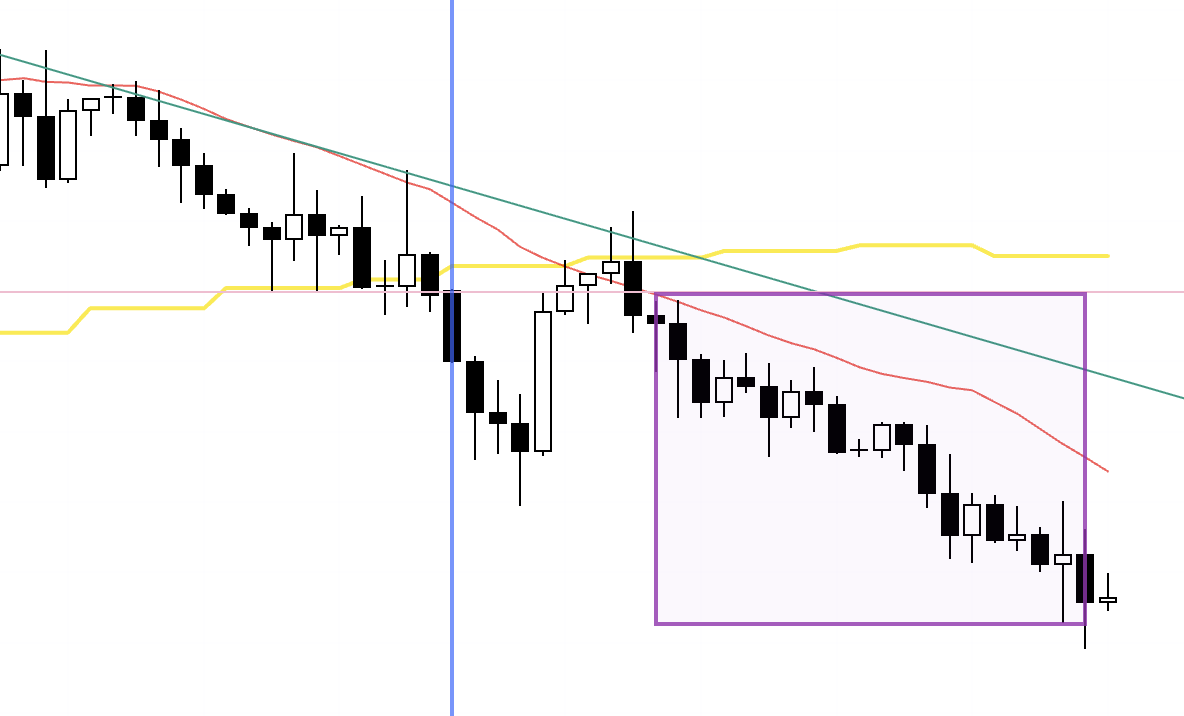
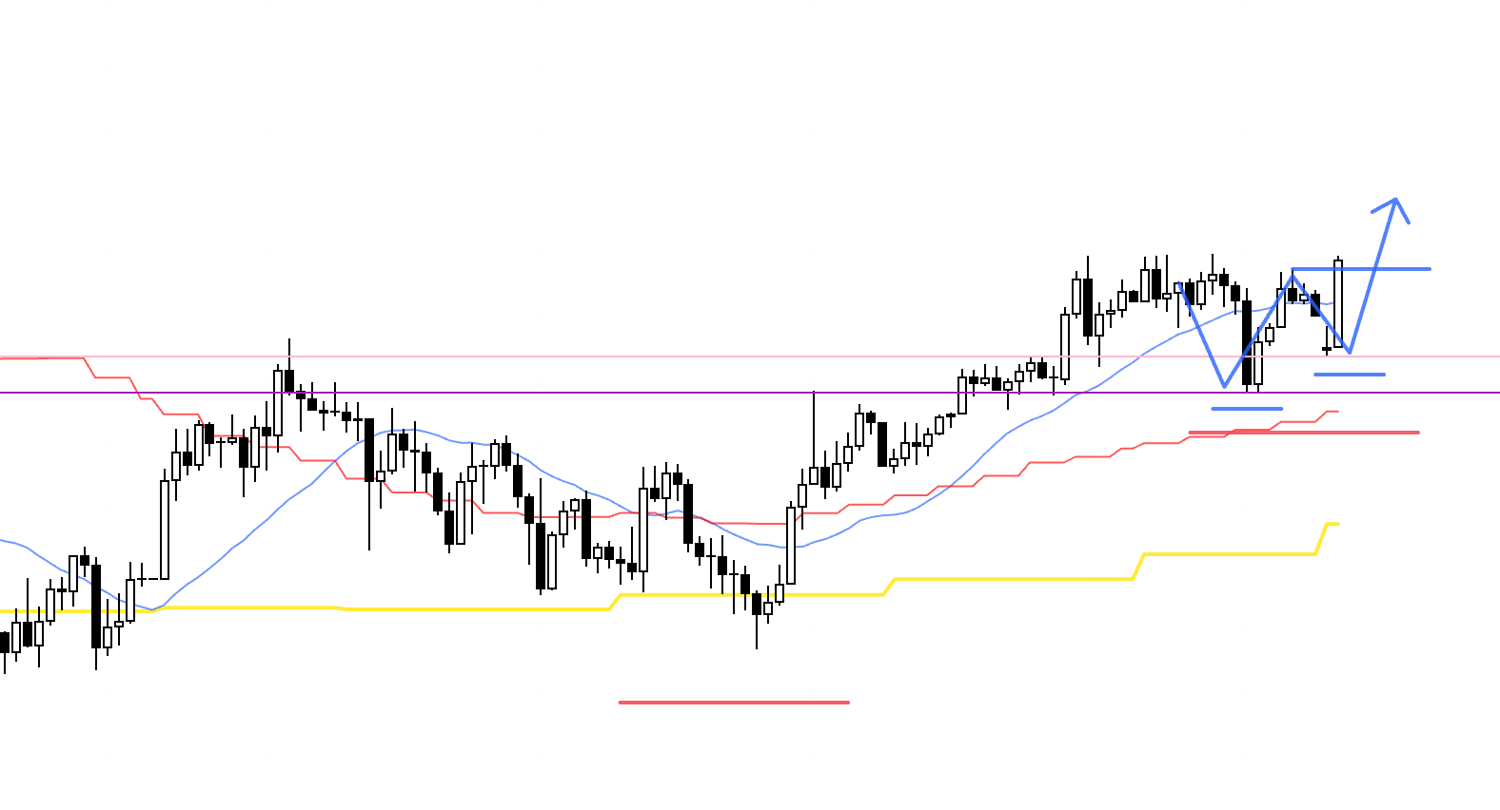
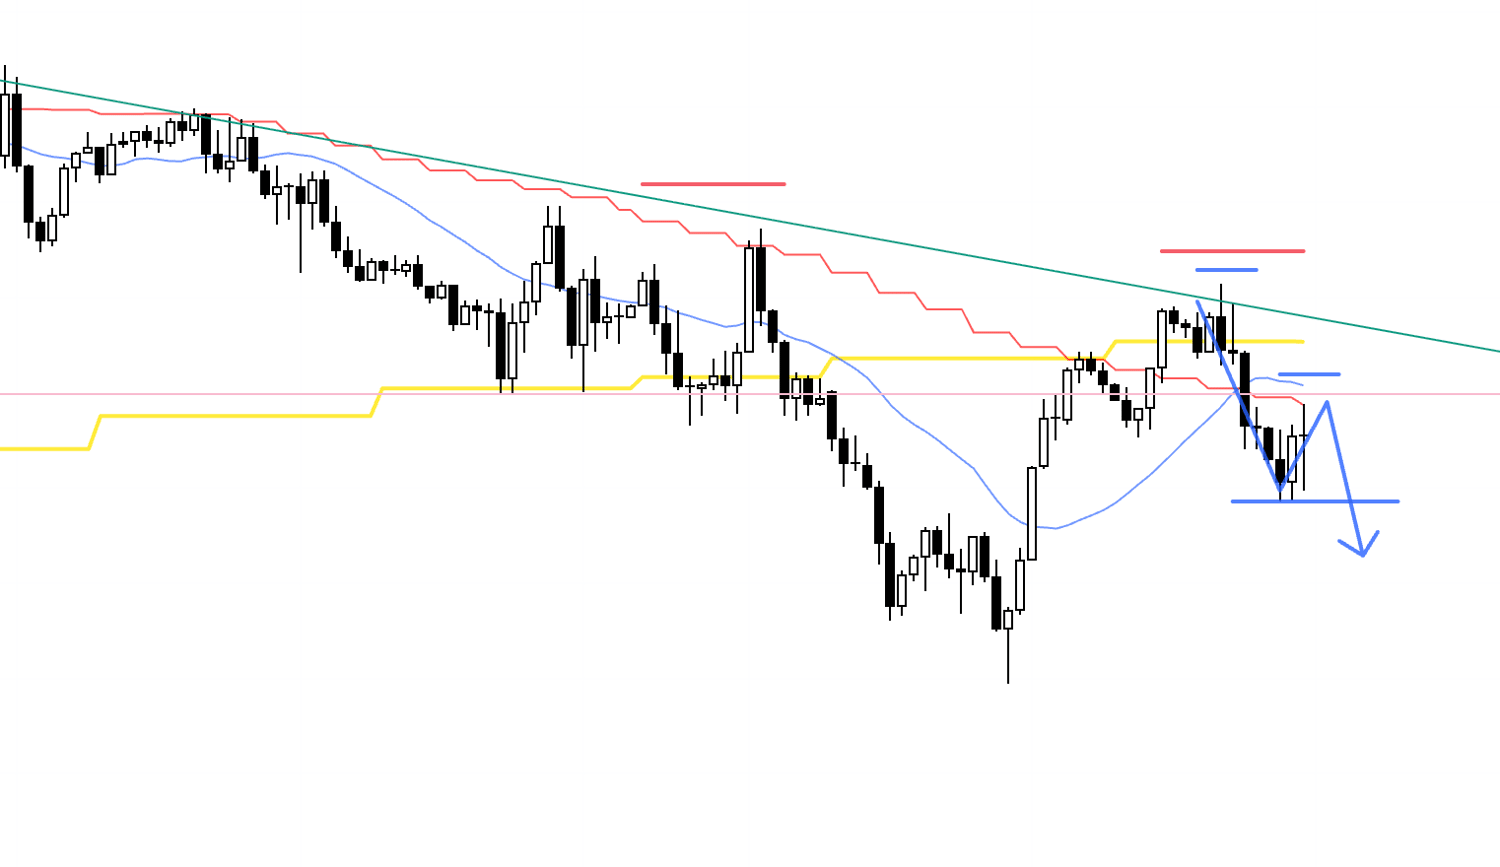
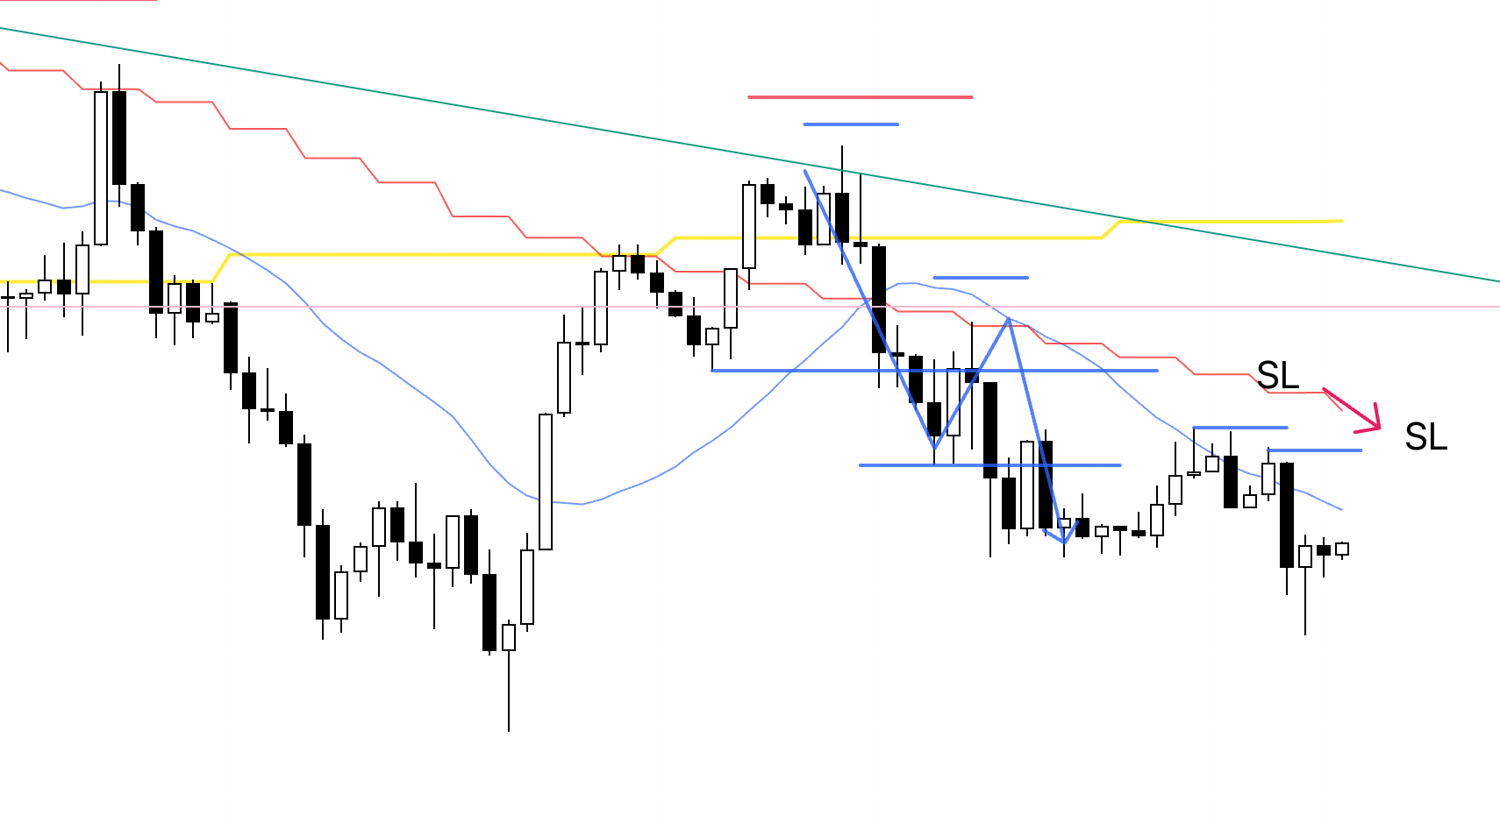
This is the EURUSD 4h chart.
I took one trade in EURUSD in the area boxed on the chart.
Because this was also a level where daily selling could come in, I started the trade on Tuesday, and it ended up being a trade I held almost all the way into the weekend.
That said, that is hindsight.
As usual, I had no reason to exit until the trend broke on the 1h, so I simply kept holding.
Now I’ll walk through the points I traded this week below, while sharing the real-time notes from those moments.
January 5 (Mon)
USDJPY
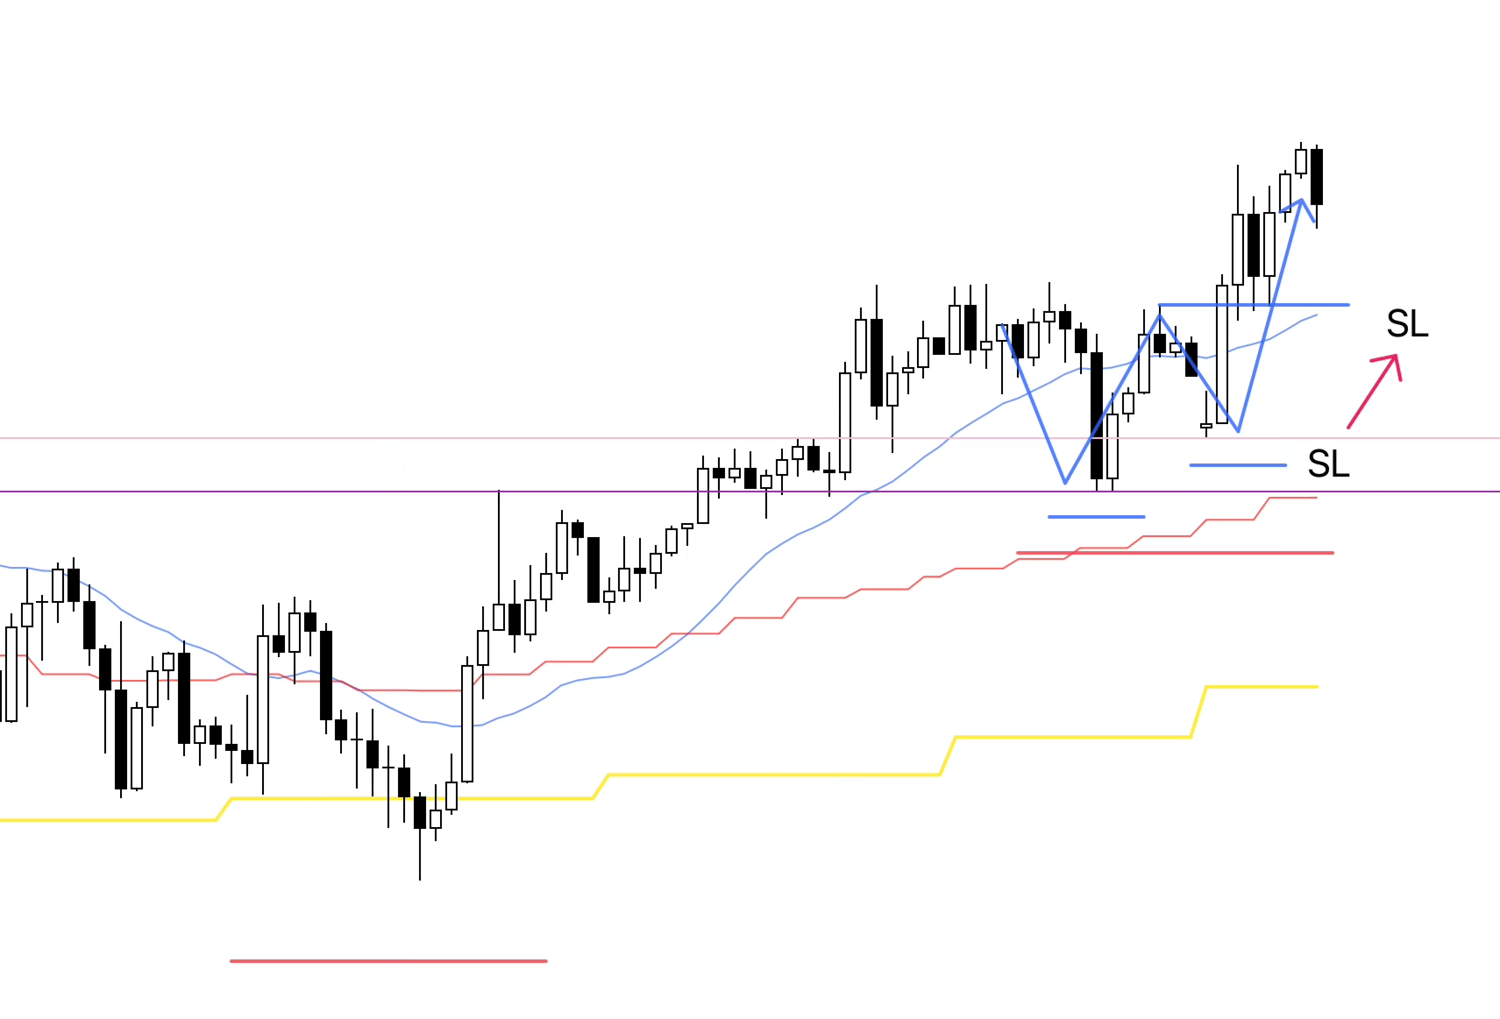
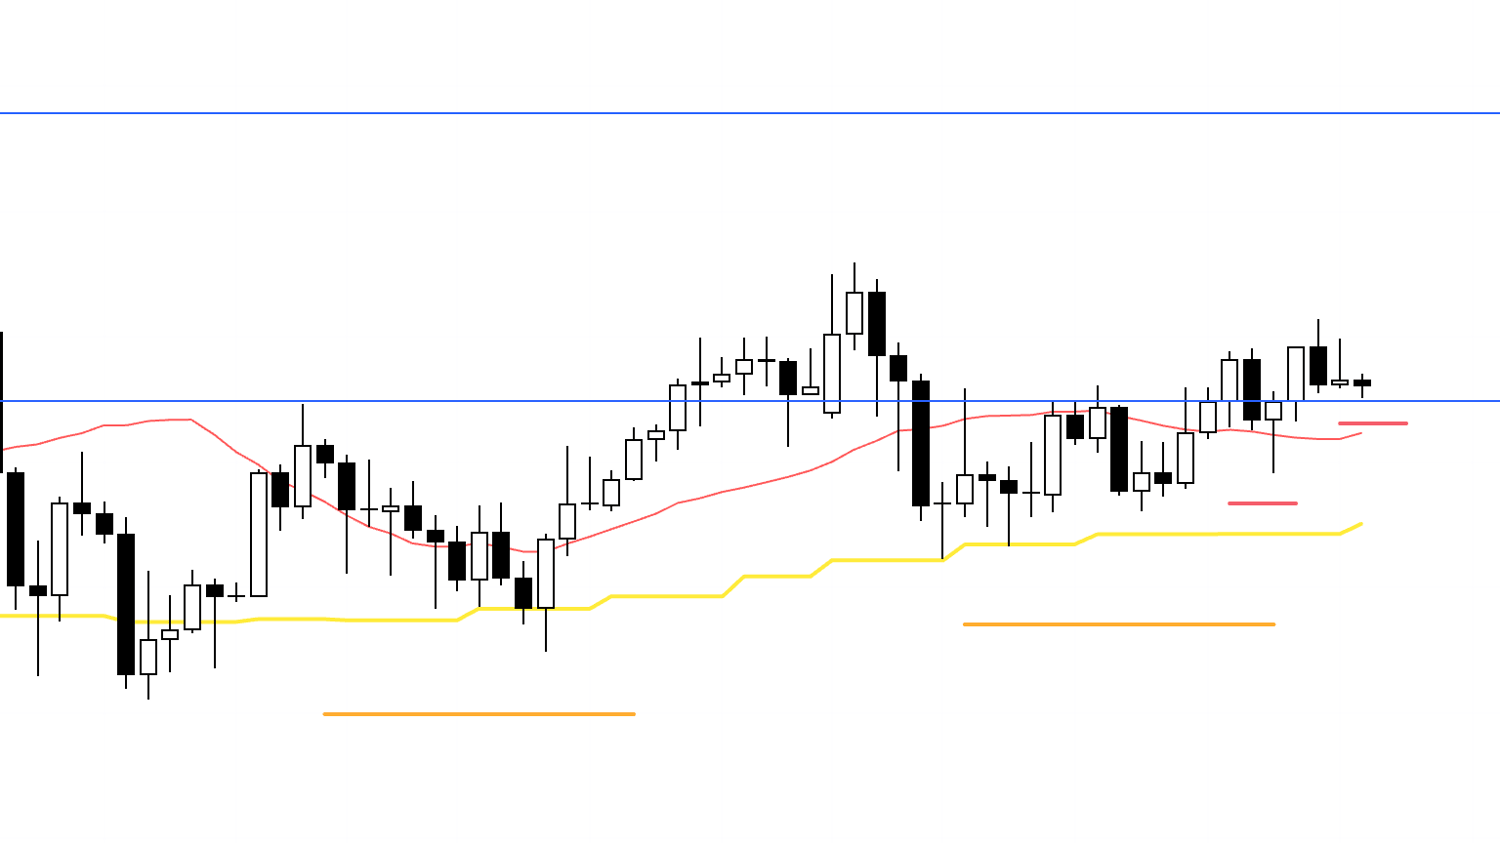
4h chart from Sunday’s scenario blog
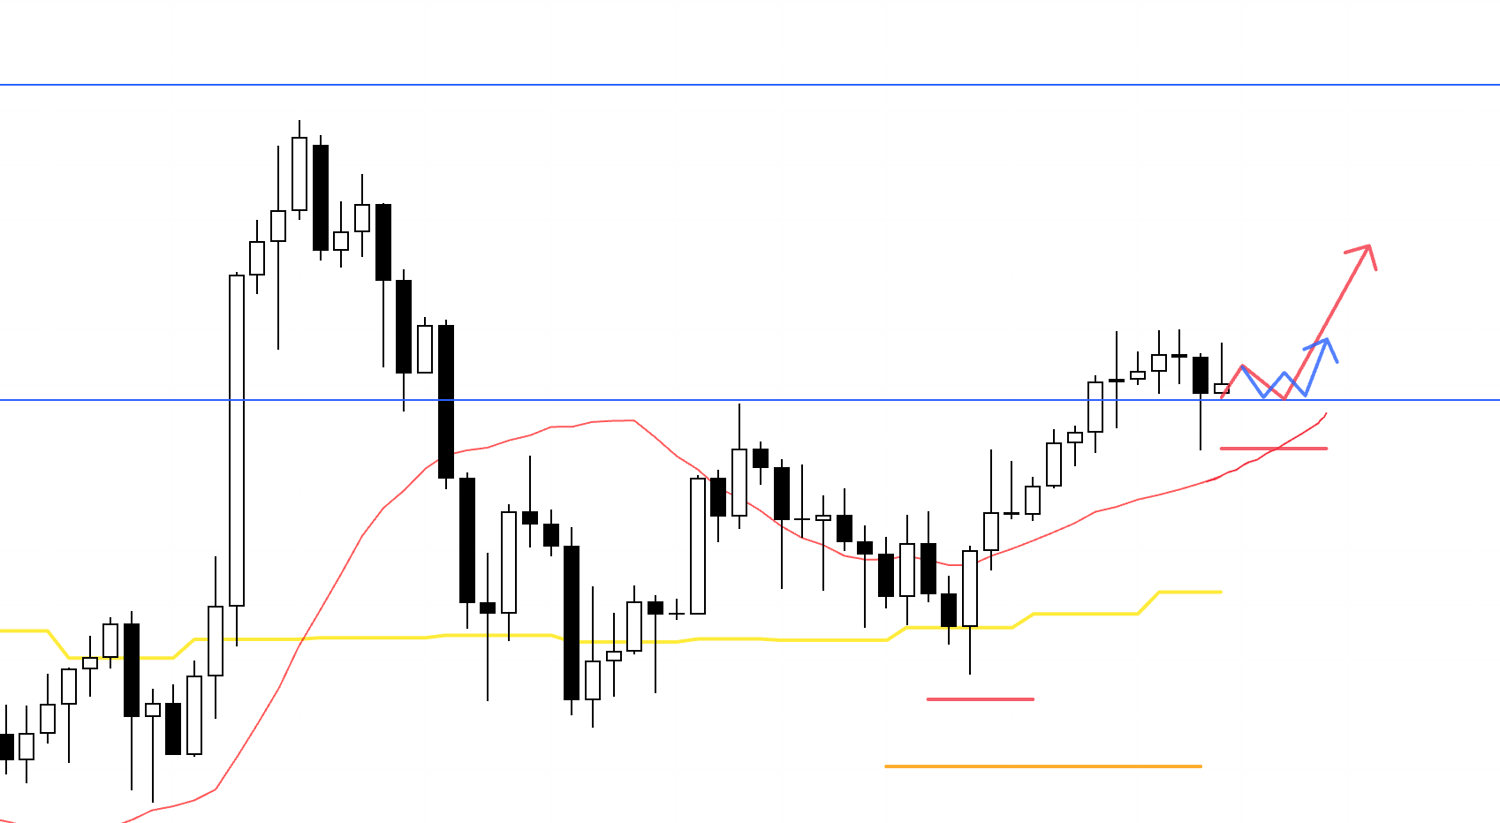
In Sunday’s scenario blog, I was looking at a buy-entry scenario as a daily pullback buy, targeting a point on this blue line where the 4h makes a higher low and the 1h starts an uptrend.
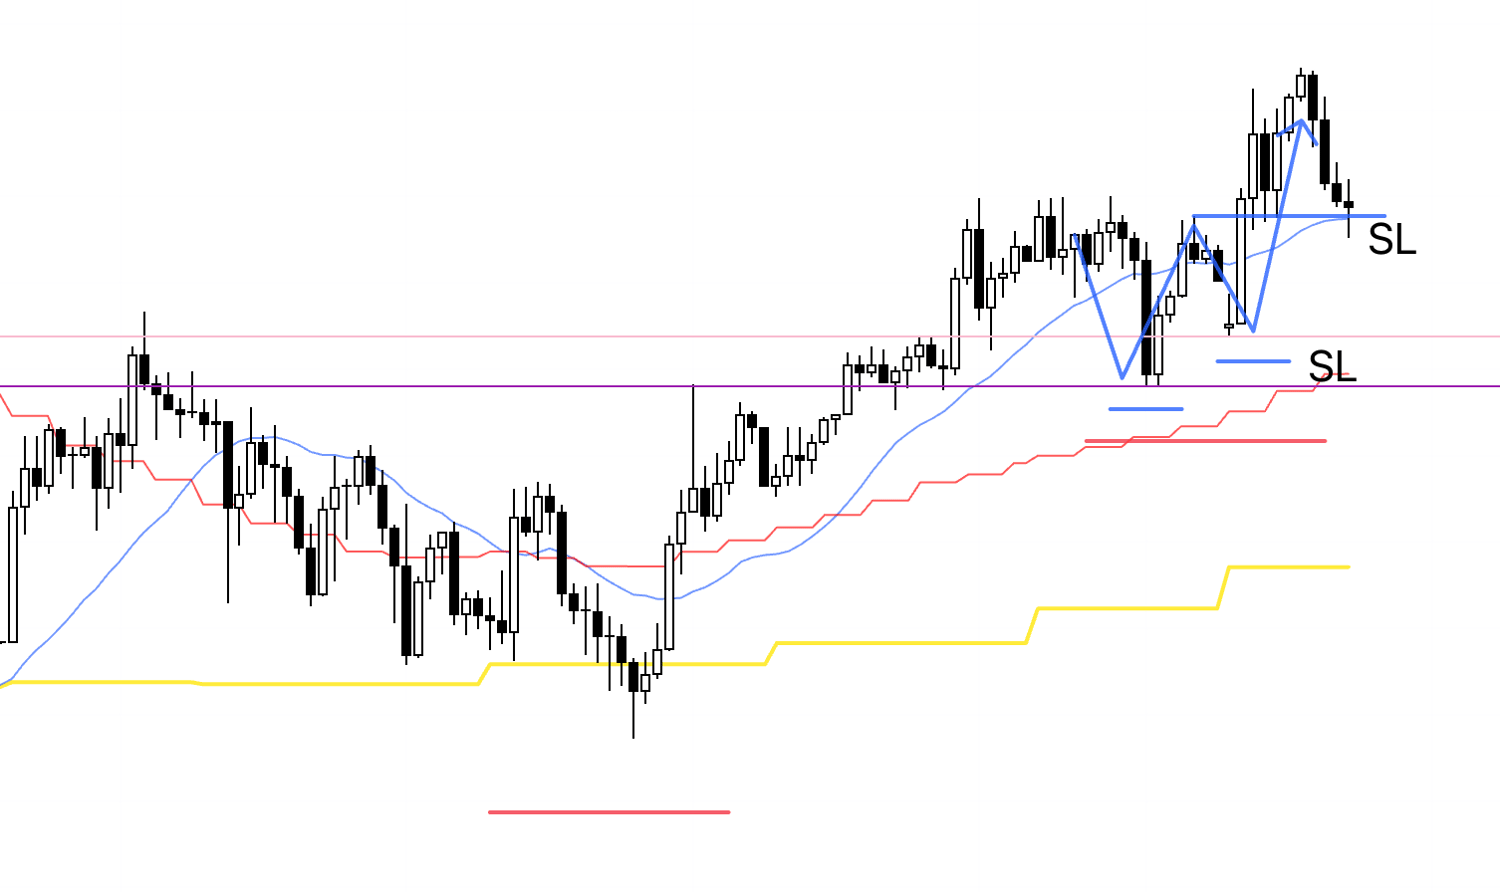
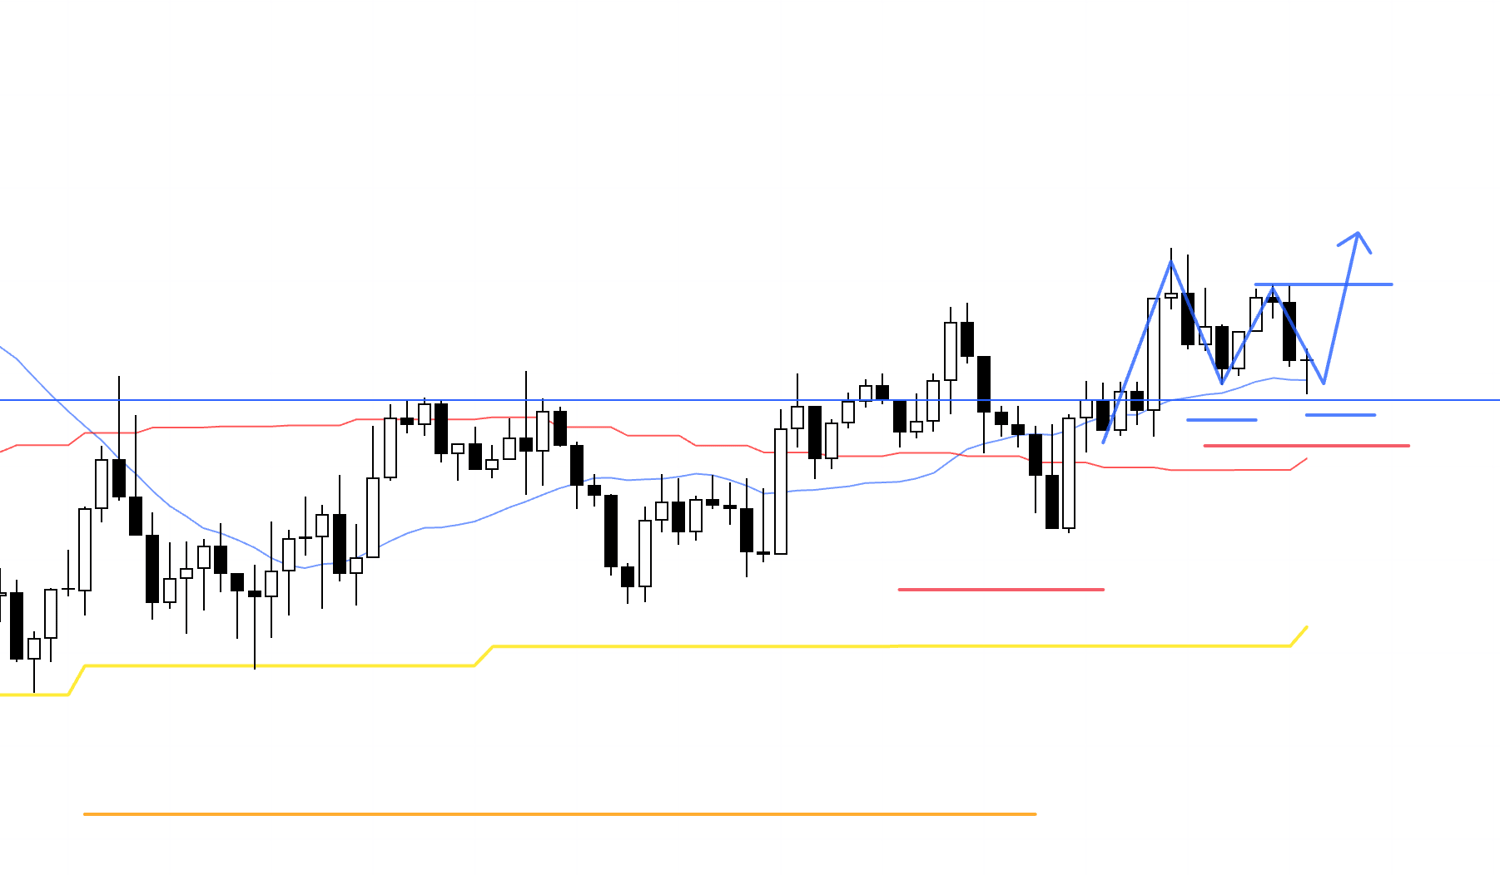
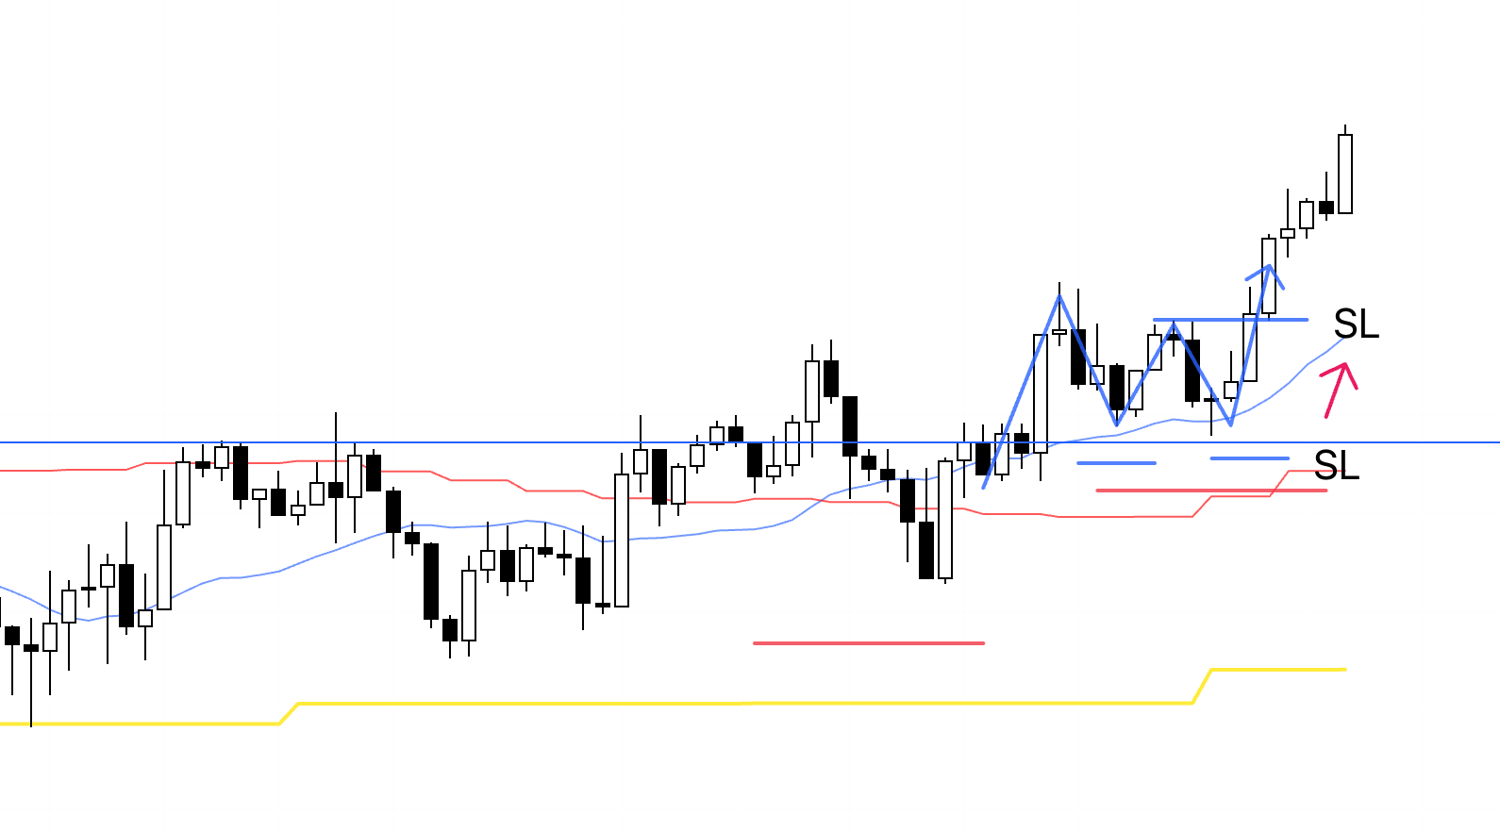
4h
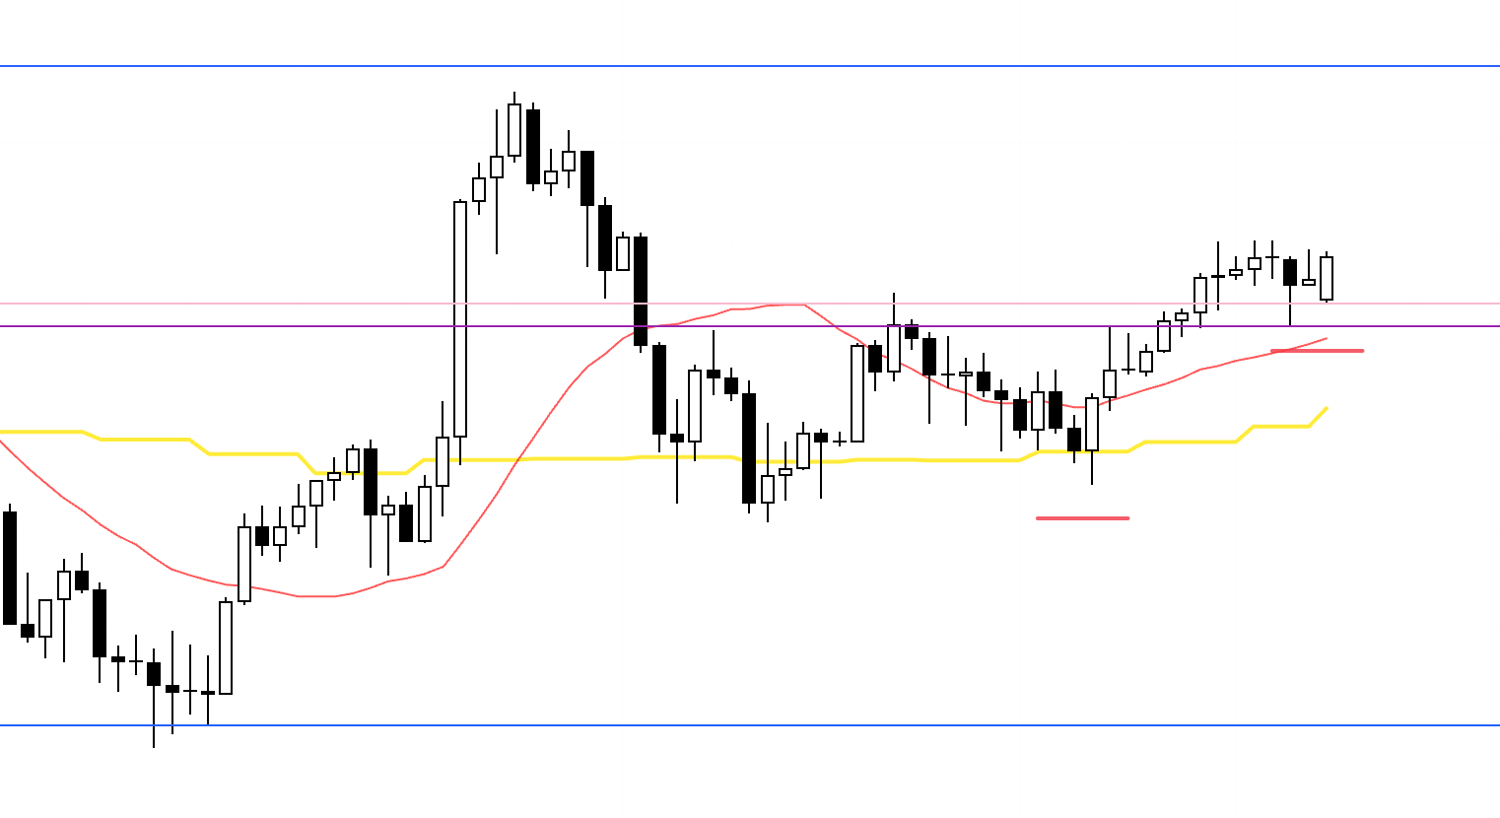
This is the live 4h chart right now.
At this 4h higher-low point, the 1h is trying to start an uptrend, so I’ve placed a buy stop order.
1h
This is the 1h chart.
A break above this high will confirm a higher low and a higher high on the 1h, marking the first point where the 1h uptrend begins.
1h
My order has been triggered and I’m in.
I’ll hold this until the trend breaks.
1h
I’ve moved my SL up.
1h
My raised SL has been hit, and this trade is now closed.
January 6 (Tue)
EURUSD
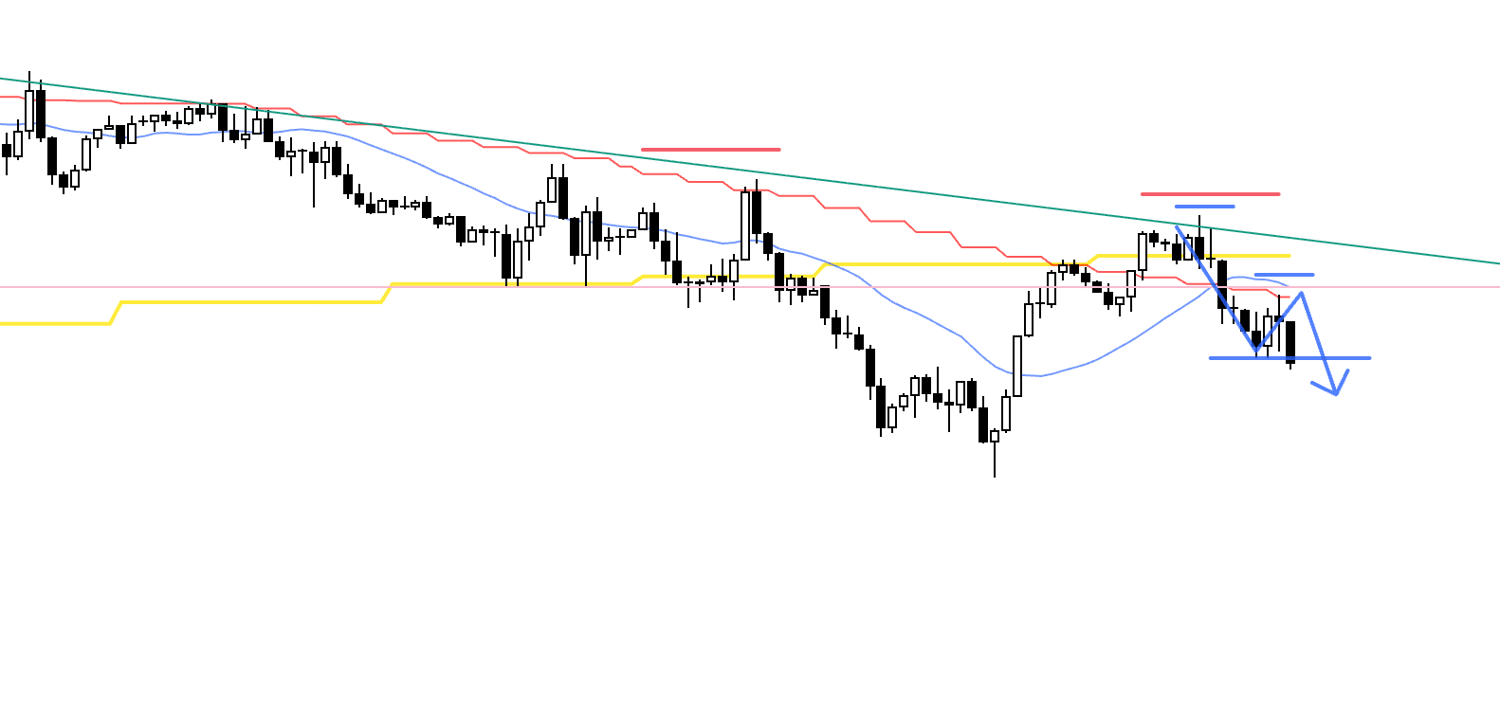
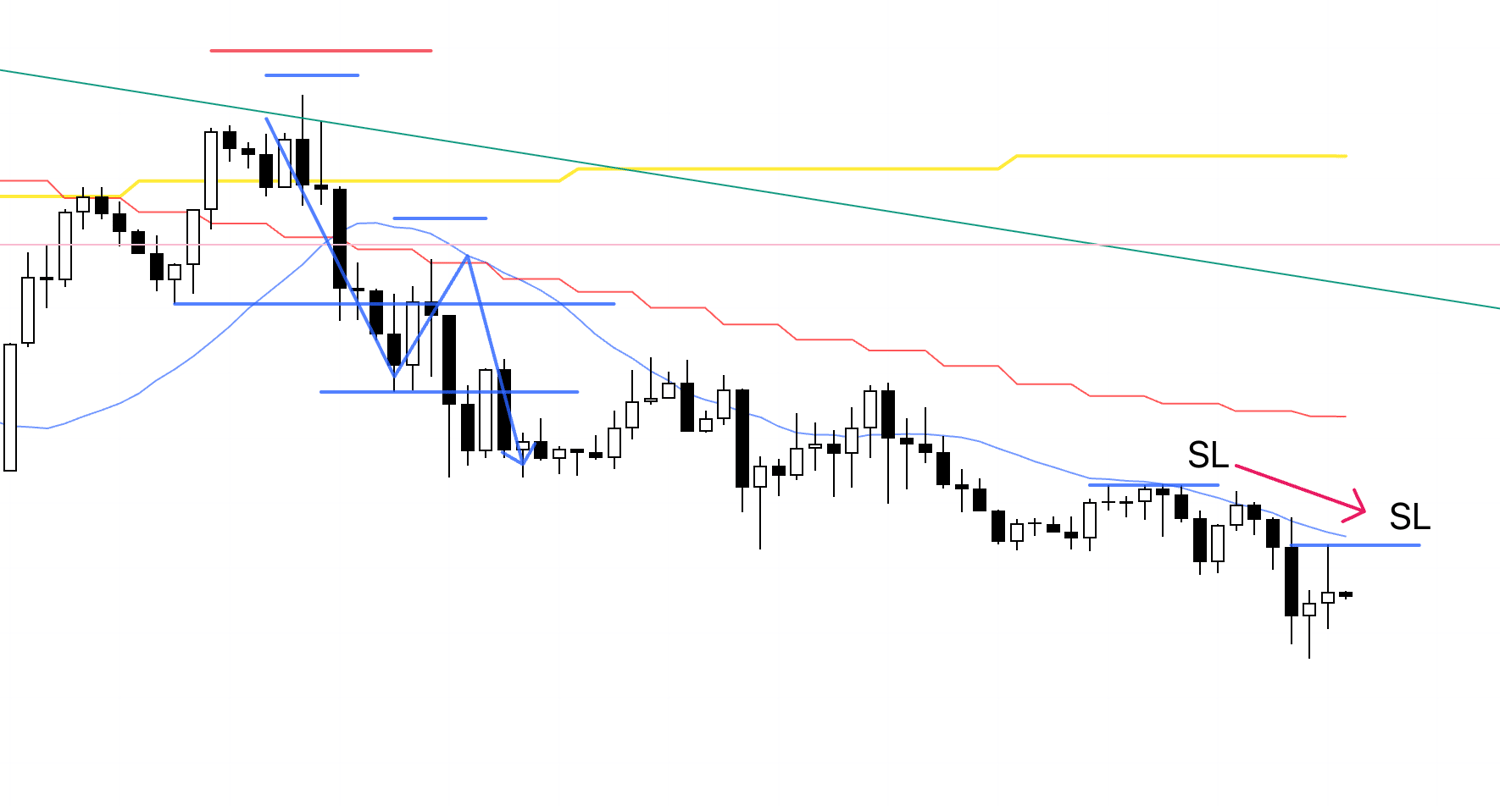
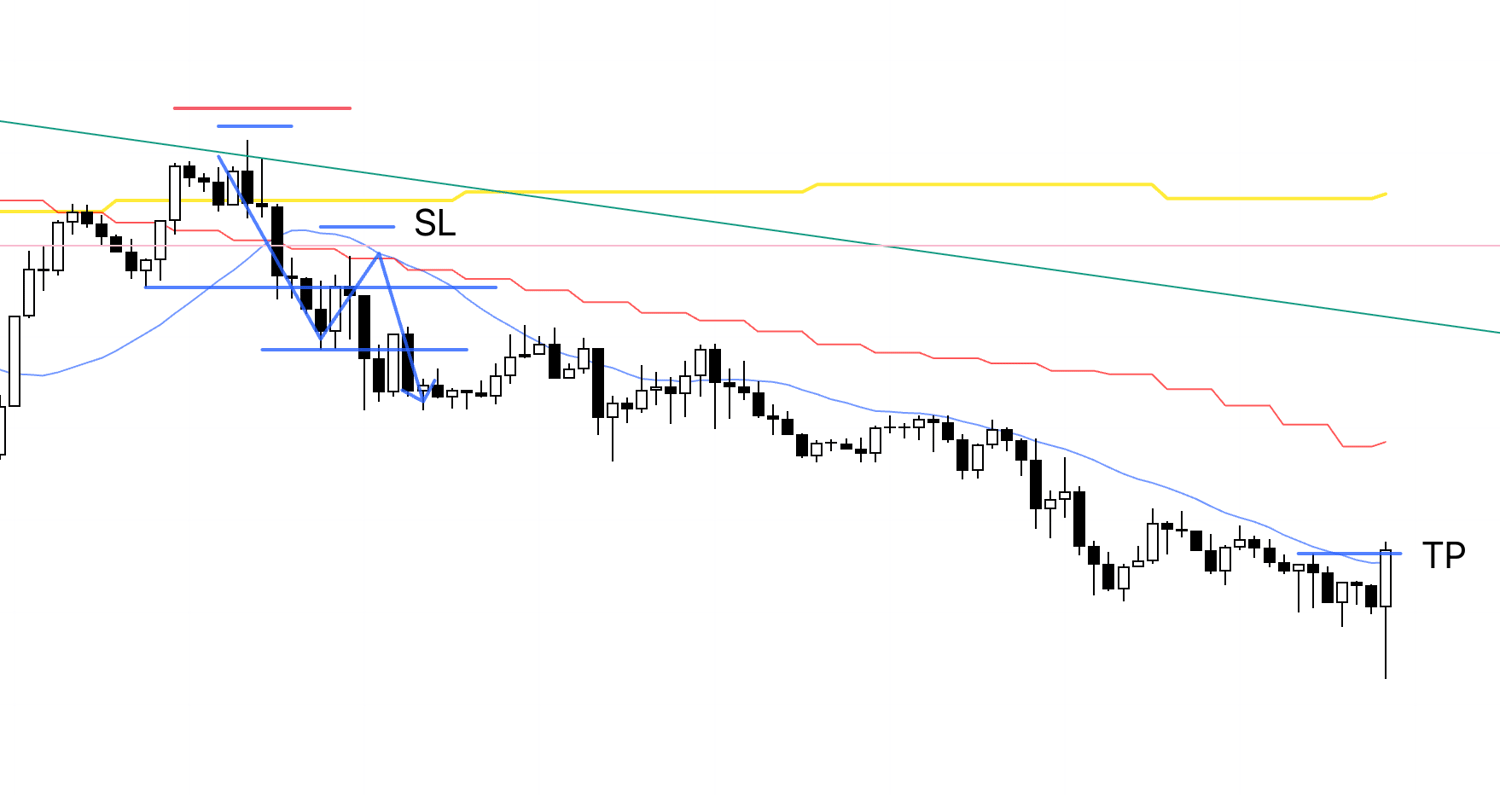
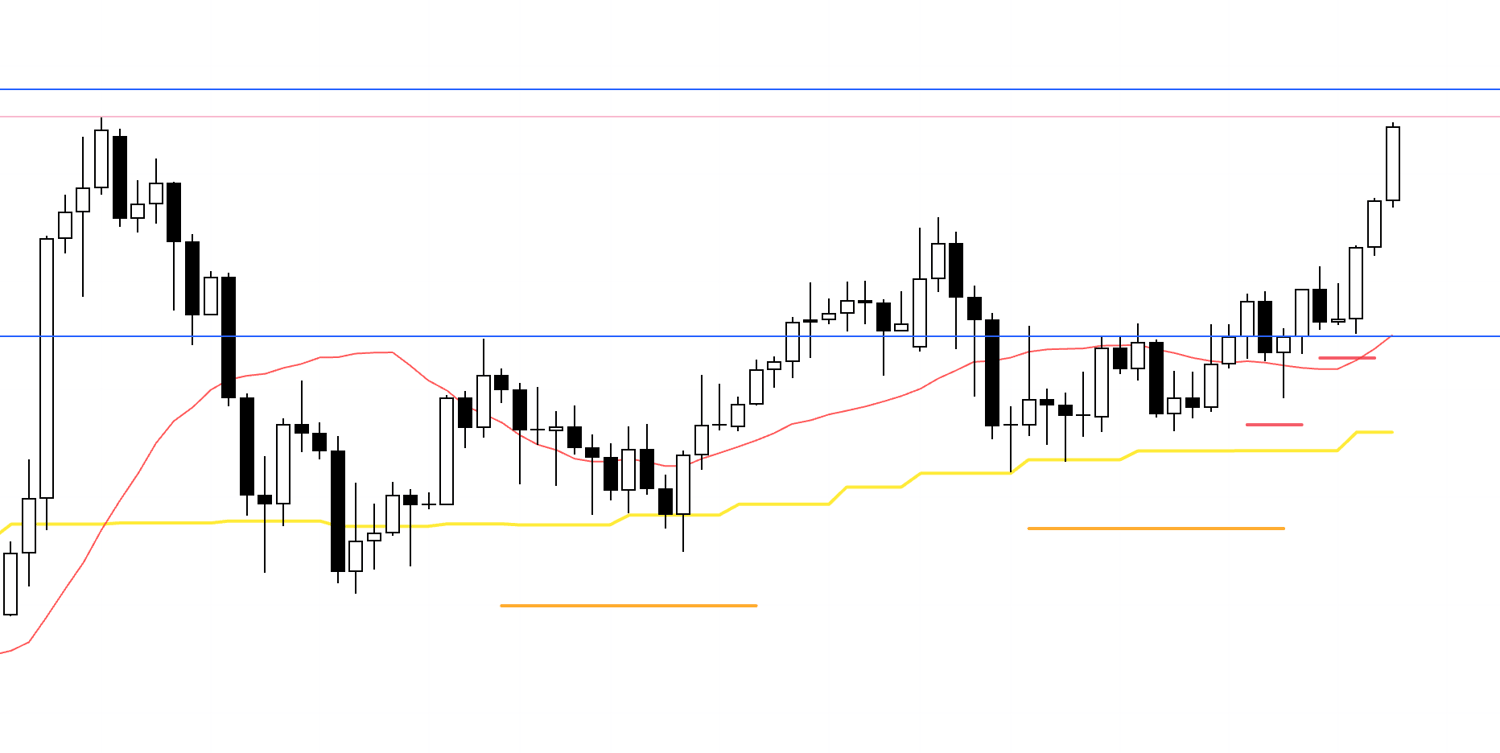
4h
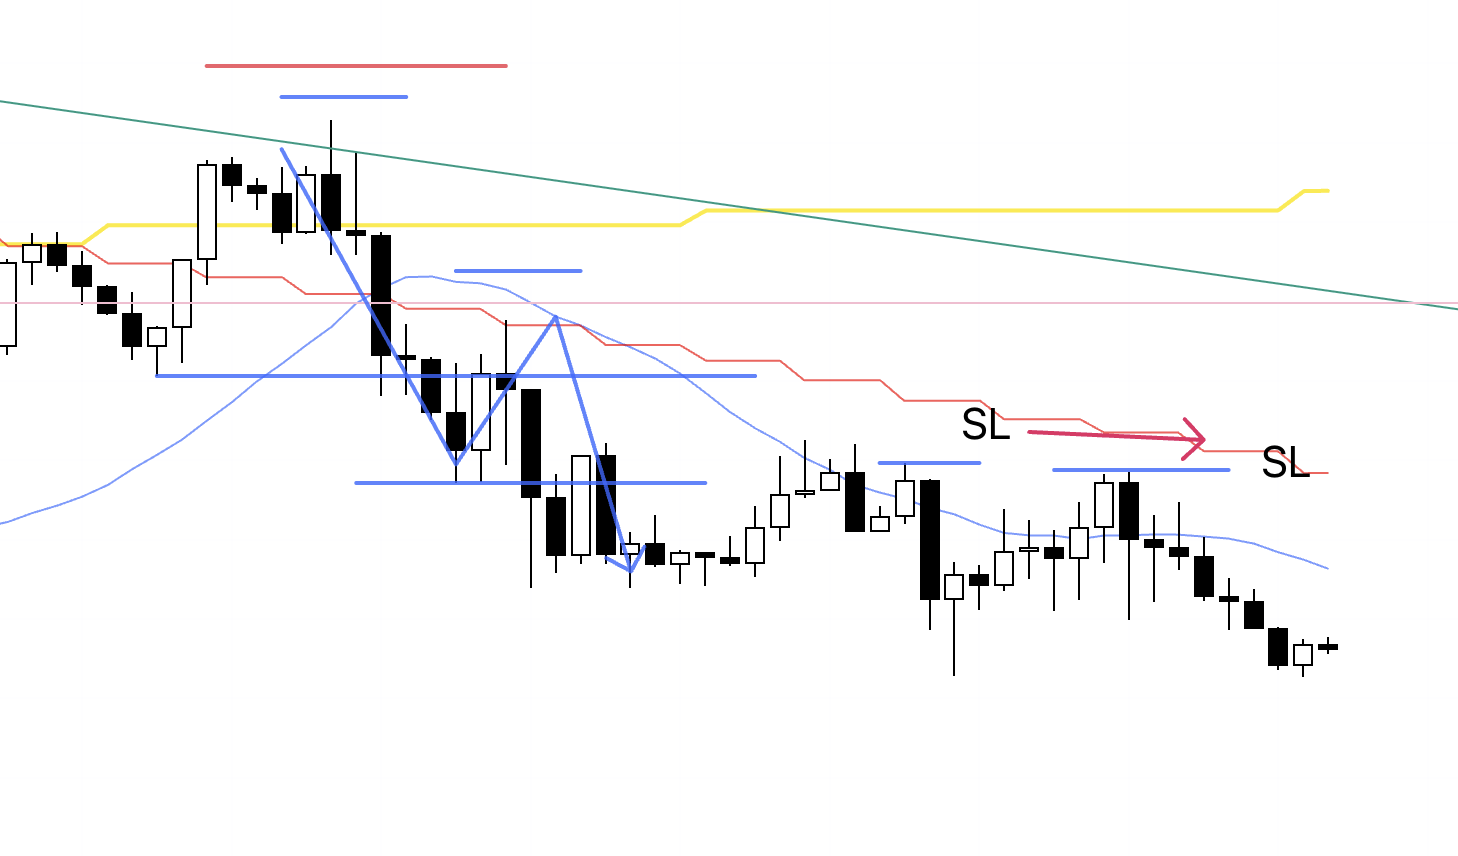
Price has also broken below the daily moving average (yellow).
On the 4h, it is forming a lower-high point while being capped by the green trendline, so I’ve placed a sell stop order.
In the prior drop, price broke the previous daily low and disrupted the daily uptrend, so from here, rallies are more likely to be sold as sell-the-rally moves.
In that context, if price starts falling while being capped by the green trendline and also by the pink line, it is more likely to trigger a chain of sell orders, pulling in daily sell orders as well, which increases the downside edge.
Let’s also look at the lower timeframe, the 1h.
1h
On the 1h, within the 4h lower-high point, the 1h is also forming a lower-high point, and that high is cleanly capped by the pink resistance line.
If we now make a fresh low (blue line), the downside edge increases significantly.
1h
My stop order has been triggered and I’m in.
I’ll hold this until the trend breaks on the 1h.
It’s already late at night here in Japan, so I’m going to sleep.
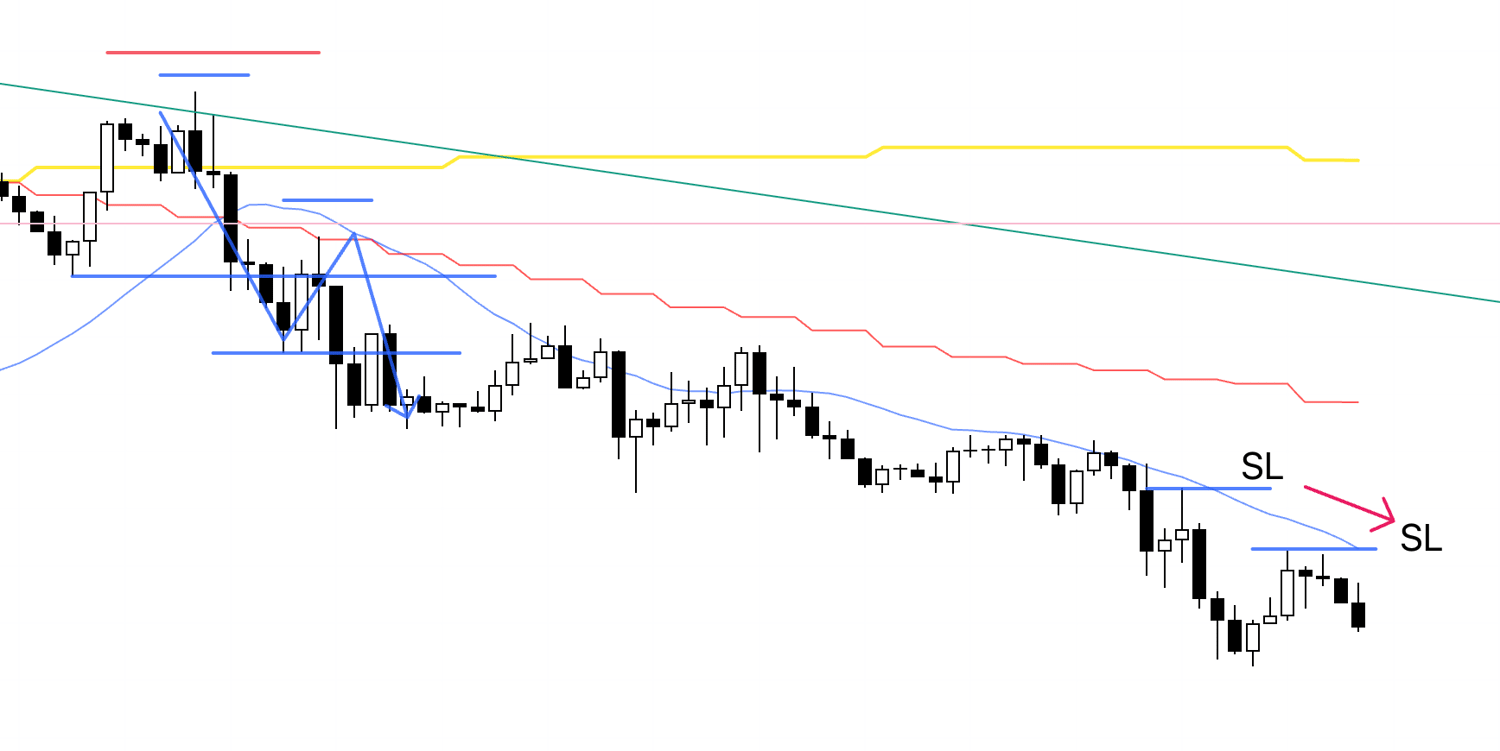
1h
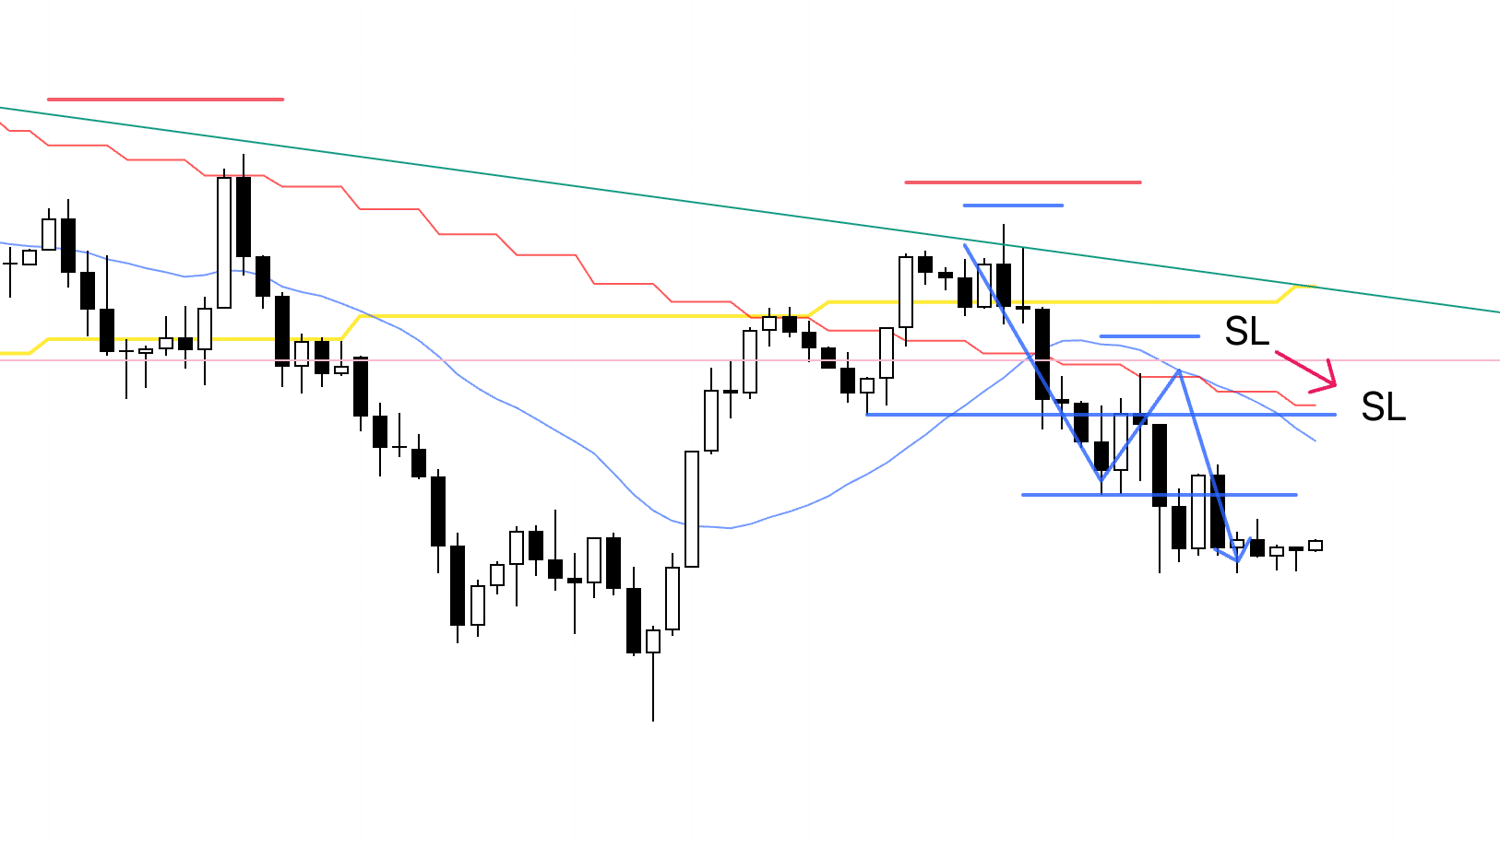
After waking up, I’ve moved my SL down a bit.
1h
I’ve moved my SL down a bit.
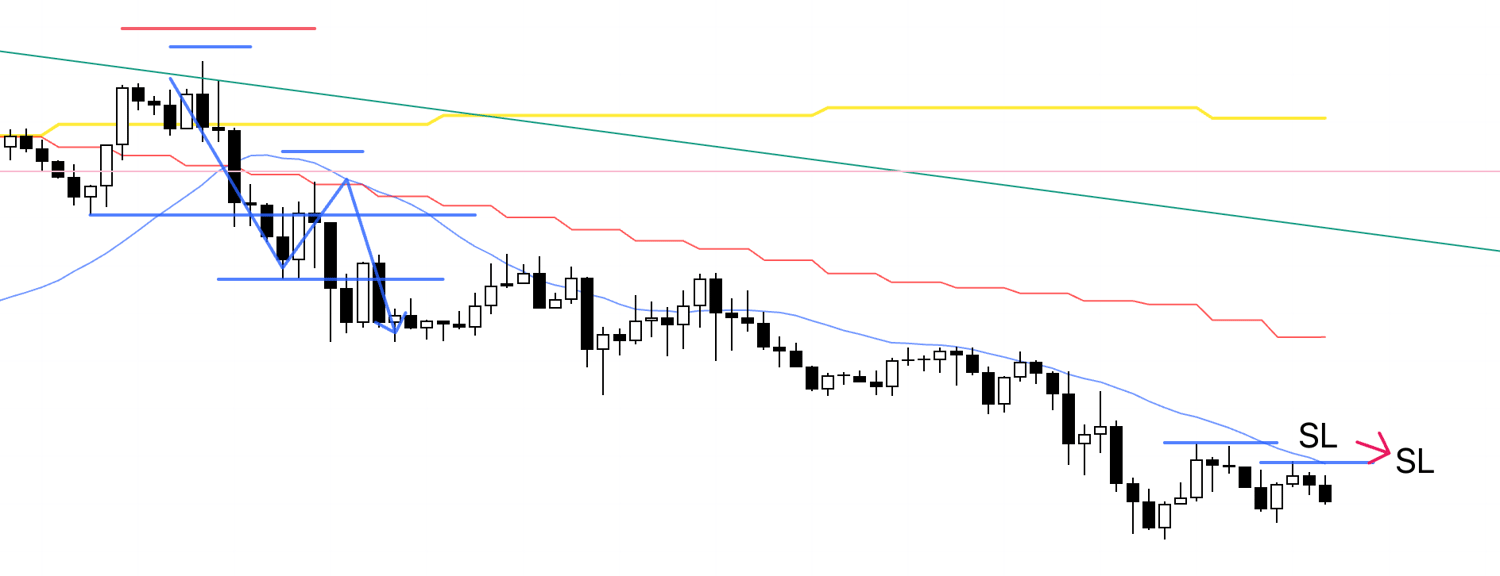
1h
I’ve moved my SL down just a little.
1h
After waking up, I’ve moved my SL down just a little.
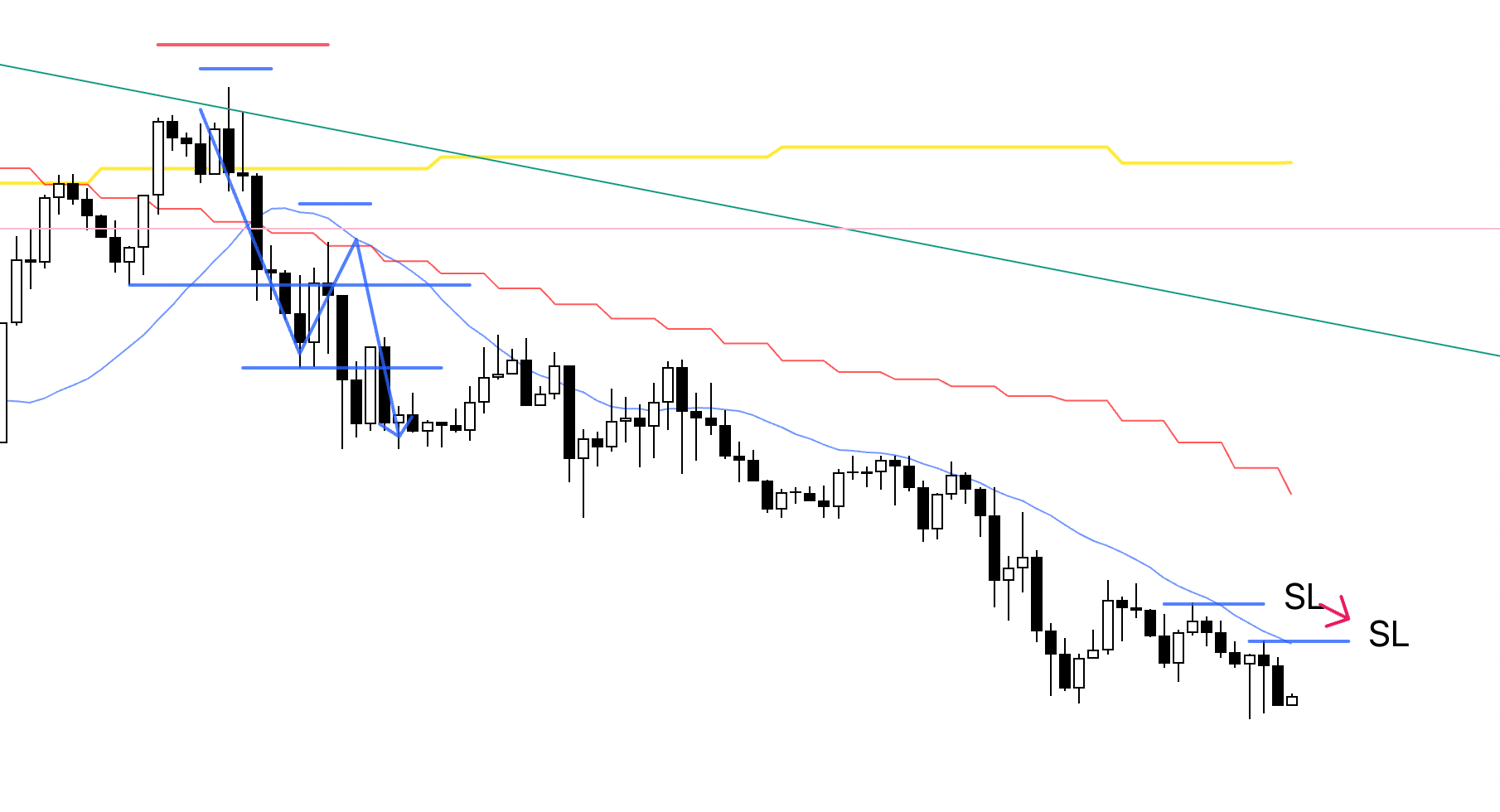
1h
I’ve moved my SL down.
1h
I’ve moved my SL down.
I’m going to sleep as is.
1h
After waking up, I’ve moved my SL down.
1h
I’ve moved my SL down just a little.
1h
I’ve moved my SL down.
1h
My trailing stop that I had been moving down has been hit, and this trade is now closed.
January 9 (Fri)
USDJPY
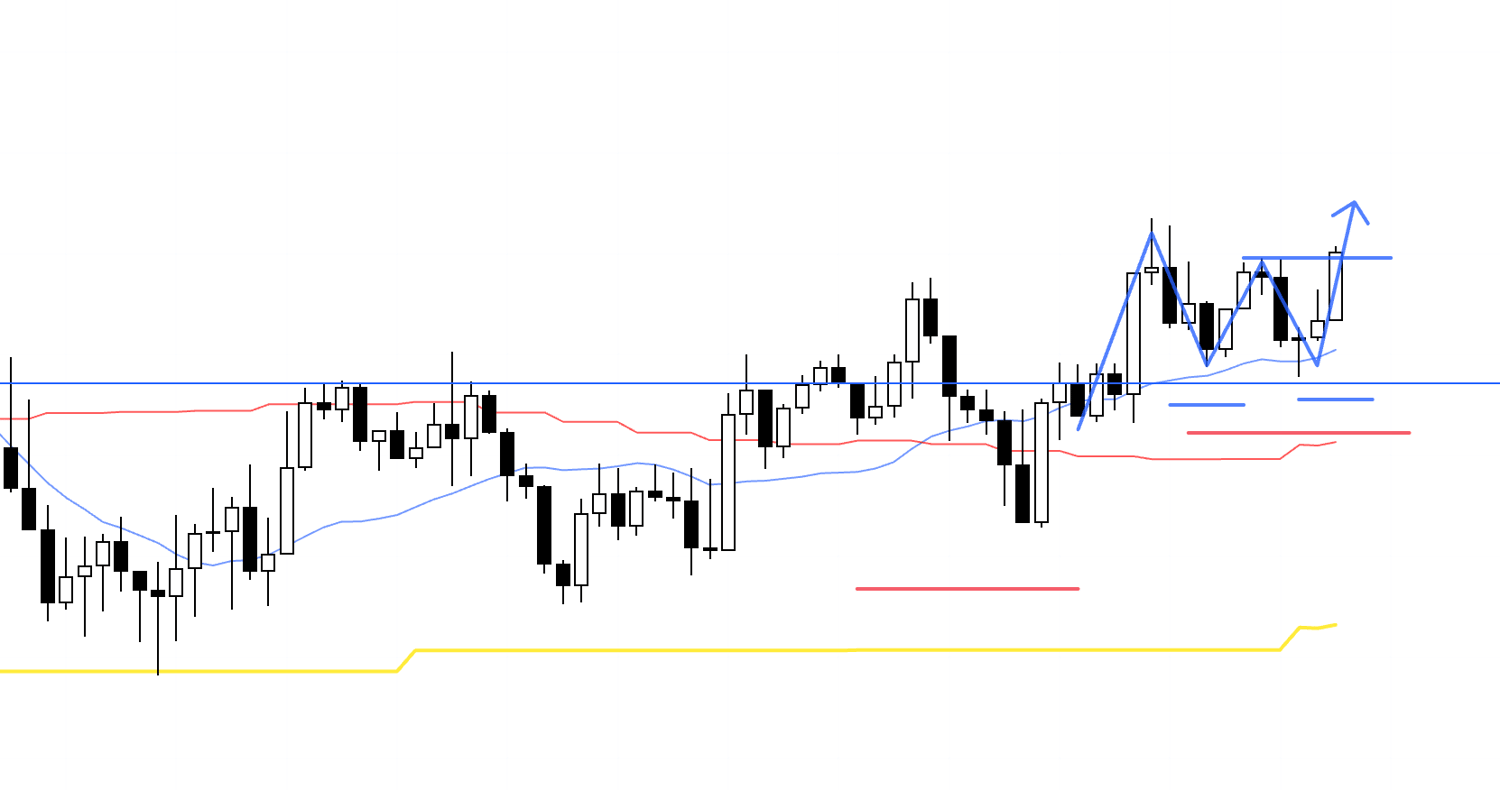
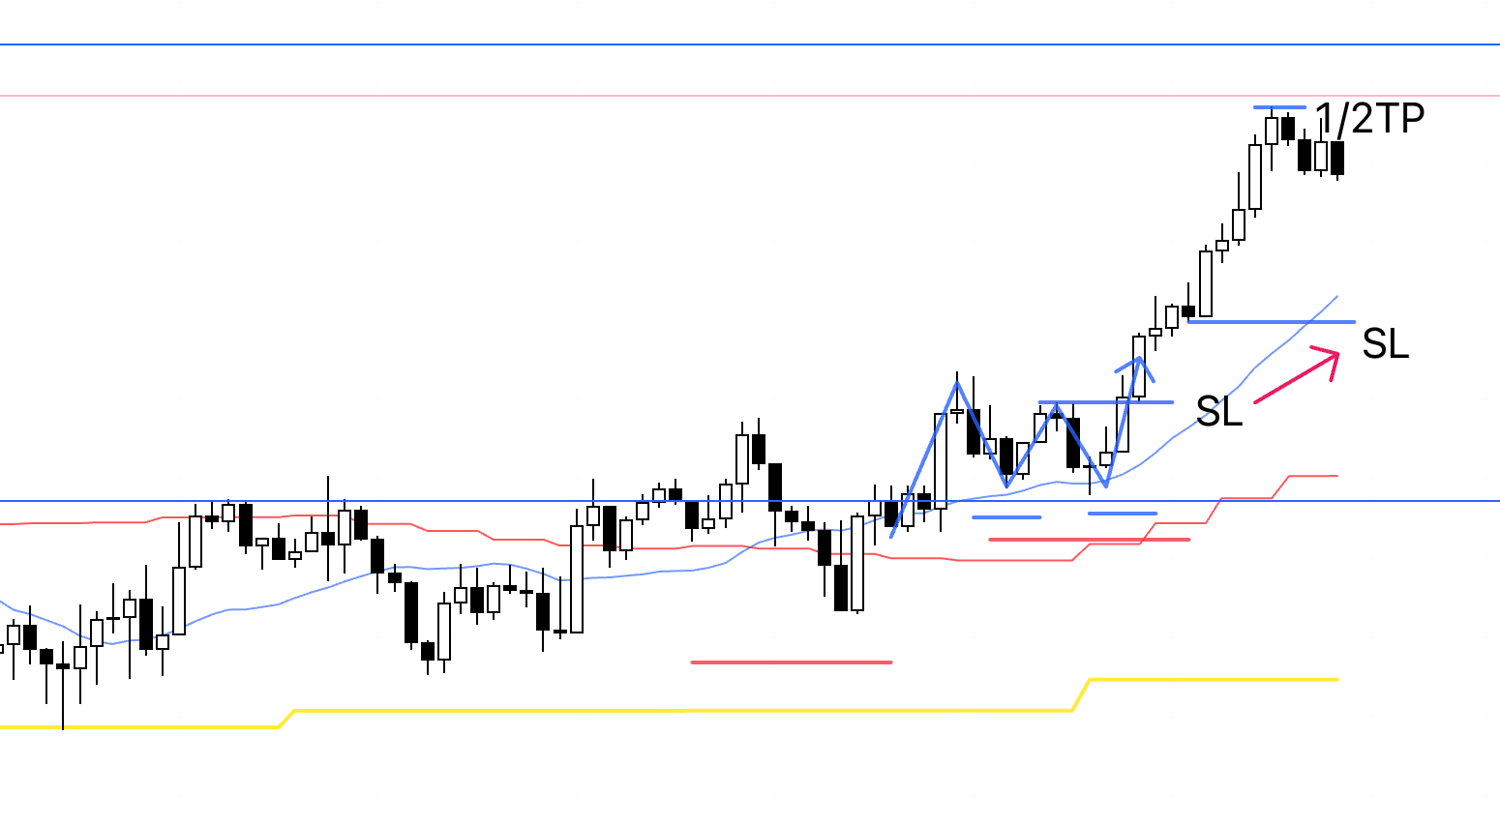
4h
On the 4h, price has printed a higher low while being supported by the same blue line I traded on Monday.
As expected, this is an upward move as a daily pullback buy, so this becomes a point with a strong edge to the long side.
1h
On the 1h, the low is slightly below the prior low, but that was created during the wider-spread period around the market open.
It also did not break the blue line, so I’ll ignore this discrepancy in this context.
As I’ve written a few times before, I often ignore small discrepancies like this.
What I prioritize most is "which line" the reversal is happening at, and whether the higher timeframe is making a higher low, and that is the core of my trading edge.
If the 4h prints a higher low and starts moving up from this blue line, it also attracts pullback-buy orders from daily timeframe traders, so buy orders concentrate and the upside edge increases significantly.
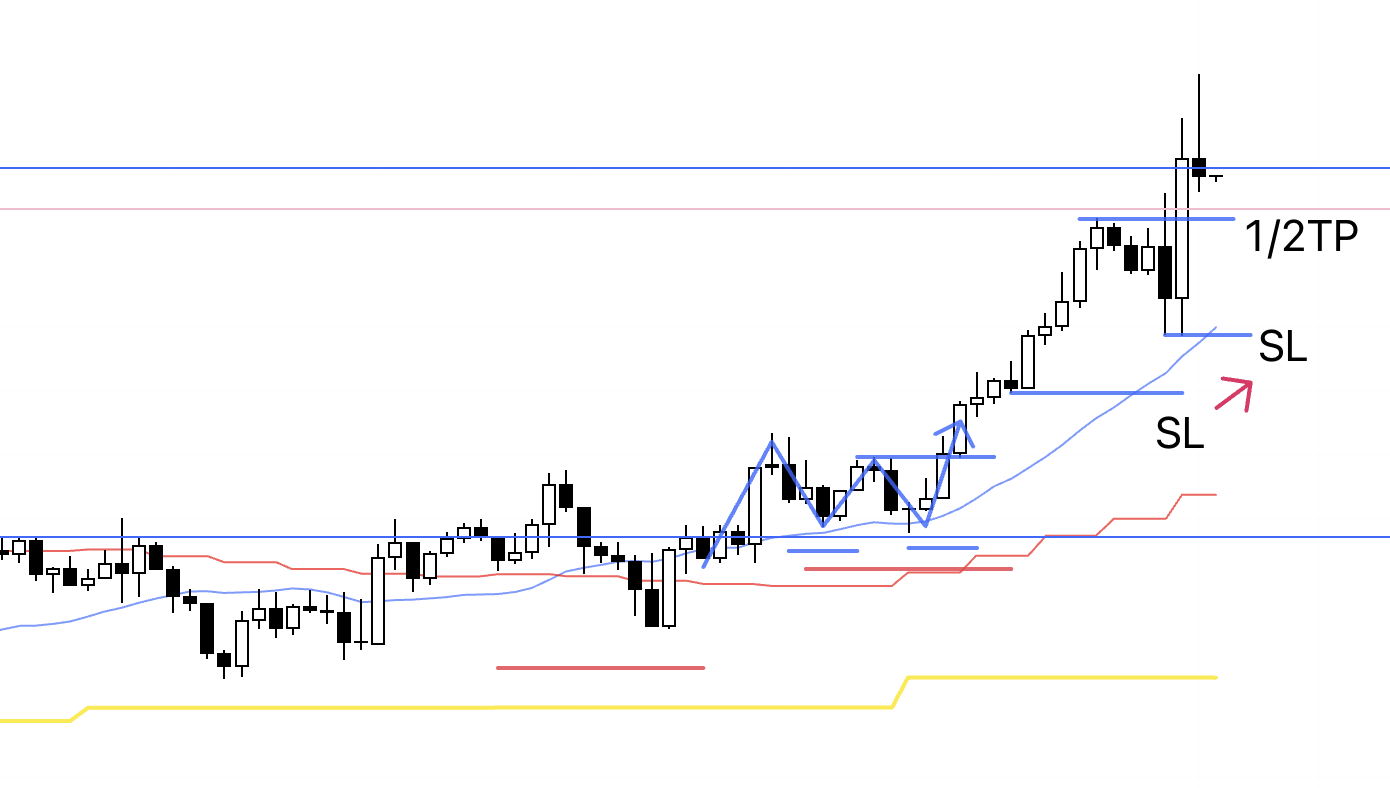
1h
My stop order has been triggered and I’m in.
I’ll hold this until the trend breaks.
1h
I’ve moved my SL up.
1h
With NFP coming later today, and price approaching a key level, I’ve locked in profit on half the position.
This pink line is the previous daily high.
To make it clear where this line is drawn from, let’s look at the 4h chart.
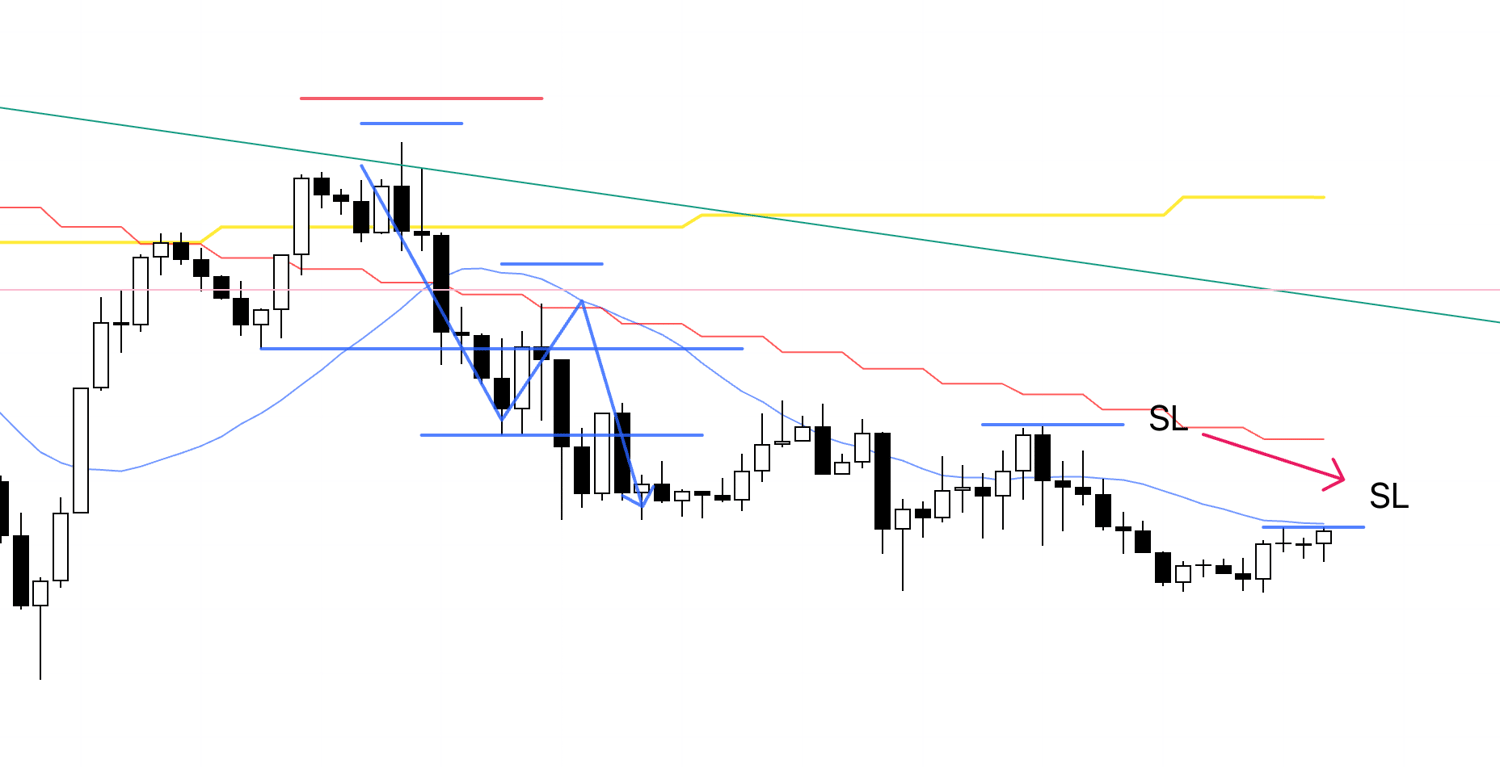
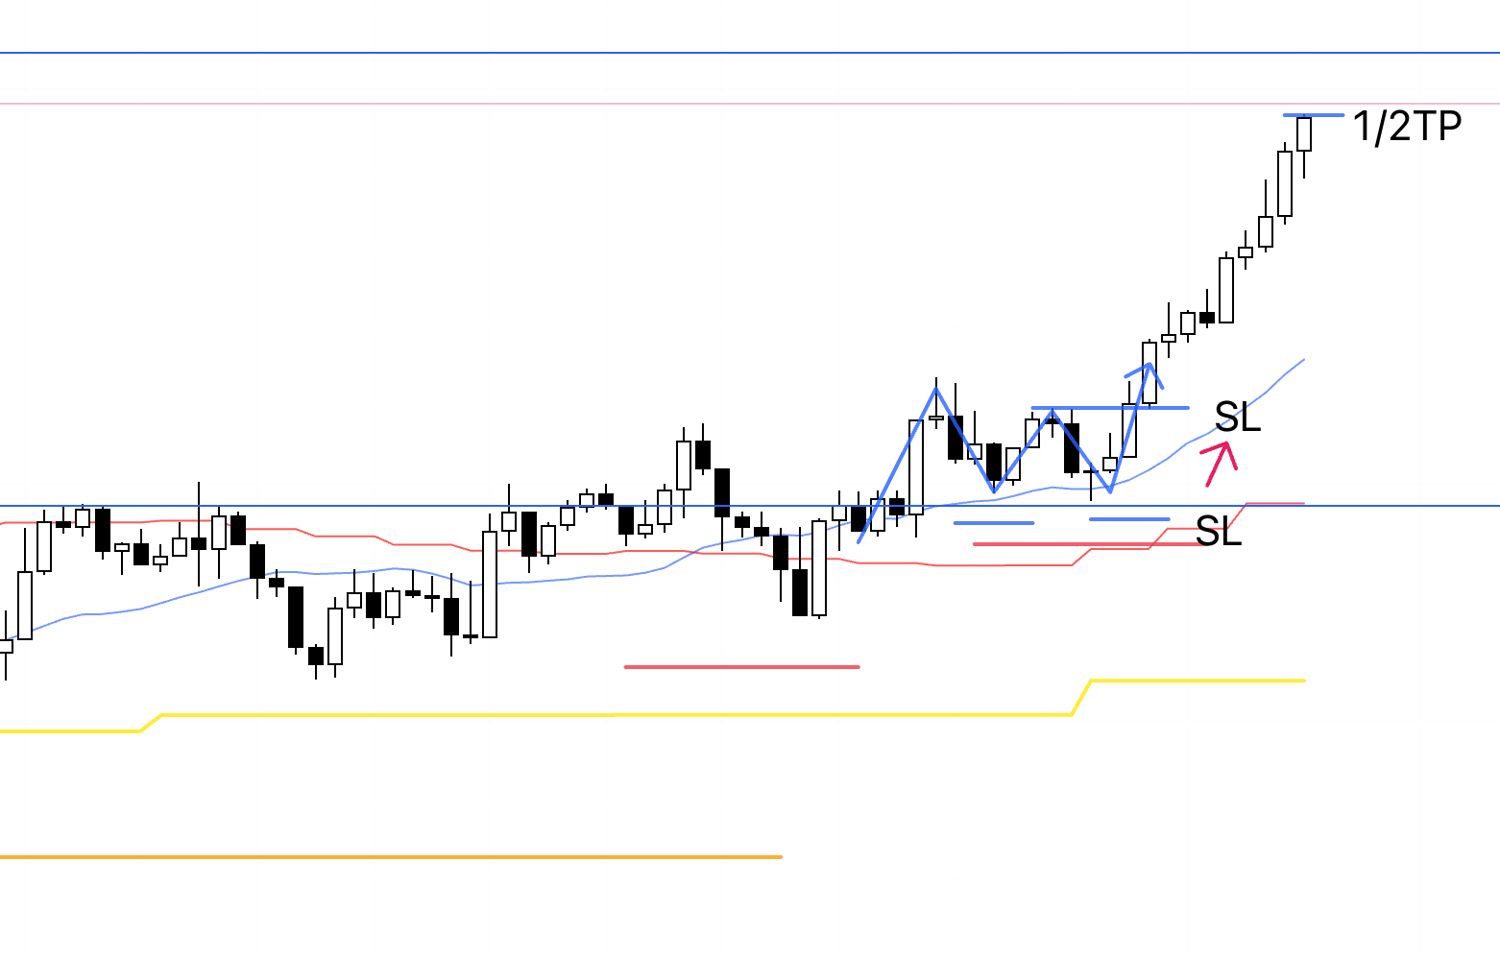
4h
On the 4h, you can see the pink line is drawn from this high.
The blue line drawn just above it is also a level you can confirm on the daily.
1h
I’ve moved my SL up.
1h
I’ve moved my SL up.
1h
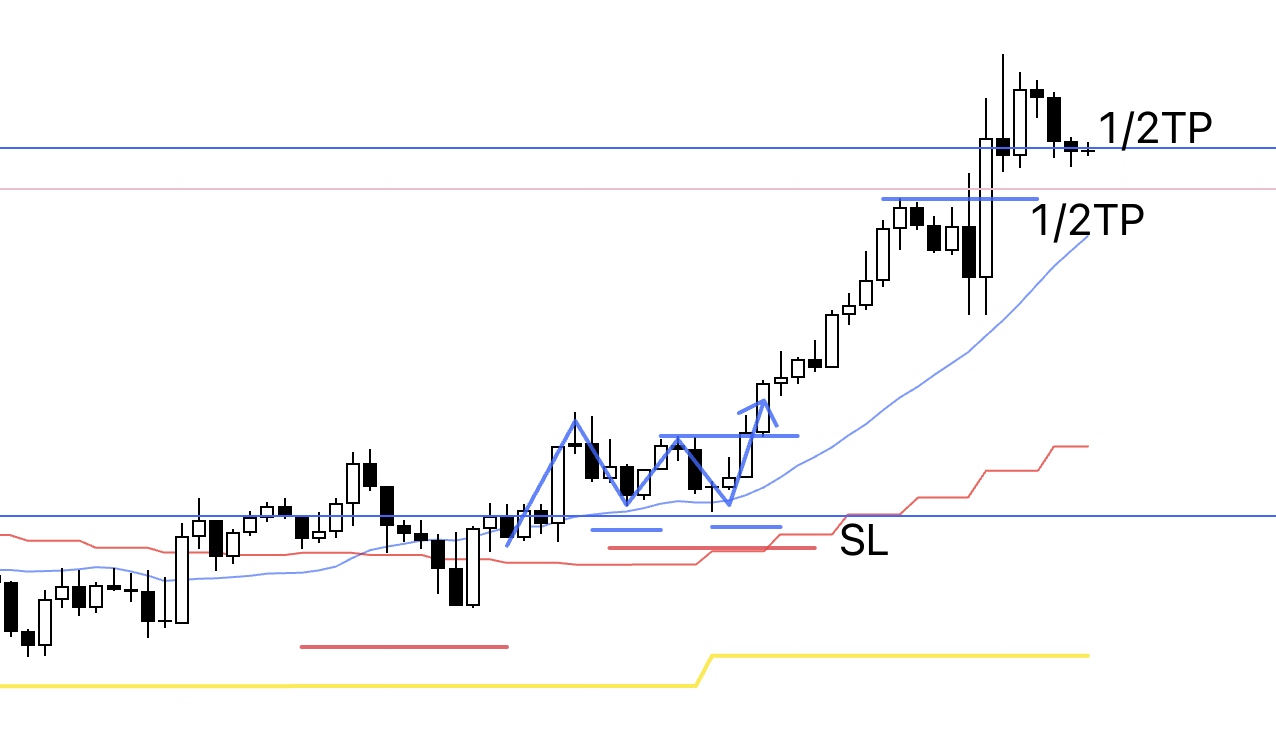
The market close is getting closer.
I don’t carry positions over the weekend, so I’m manually closing the remaining half here, and this trade is now finished.
That’s it.
My trading is buying pullbacks and selling rallies on the 4h.
In other words, unless the 4h context is in place, I don’t look at lower timeframes and I don’t try to trade.
So truly high-edge situations for 4h pullback buys and sell-the-rally setups do not show up many times in a week, and they are limited.
This week, I traded USDJPY twice and EURUSD once, for a total of three trades.
What matters is how well you can wait for high-edge situations and repeat trades only there, and whether you can build a large, consistent sample over a full year using only those trades.
"I haven't traded yet this month."
"At this rate, I'll end the month in the red."
You must not rush and take positions where you don’t need to, thinking like that.
Trade only where you should.
Repeat that over the long term.
By doing so, probability and compounding start to work, so while it may look like it takes time at first glance, it becomes the shortest path.
Thank you for reading to the end.
I hope my blog offers a hint for those who are about to build a strategy, and for those struggling because they can’t achieve consistency.