

Hello.
I’ll lay out my trading scenarios for the coming week.
I publish this “Trade Scenarios” blog every Sunday.
And every Saturday I post a “Weekly Trade Report” where I explain how I actually thought about the market and executed my trades during the week.
By reading this trading-scenario blog together with the Weekly Trade Report, I think you’ll be able to use my process as a practical reference for how to think ahead of time, what to wait for, and how to execute in a consistent way.
For the underlying strategy, please refer to my blog posts on Dow Theory and multi-timeframe analysis.
A “scenario” is not a forecast.
It is not a prediction, but my personal plan that says, “If the market does this, I will do that.”
I don’t try to predict the market, and this is not intended as such, so please keep that in mind.
Nor is this a set of instructions telling you what to buy or sell, or a service providing trading signals.
It does not guarantee any future profits; it is provided purely for educational purposes, using my own consistent process as the example.
I cannot take responsibility for any outcomes of the trades you place, so please trade at your own risk.
With that, let’s start with USDJPY.
(On my charts, the colors of the lines I draw represent each timeframe: orange for the daily, red for 4h, blue for 1h, and green for 15m.)
USDJPY
Daily
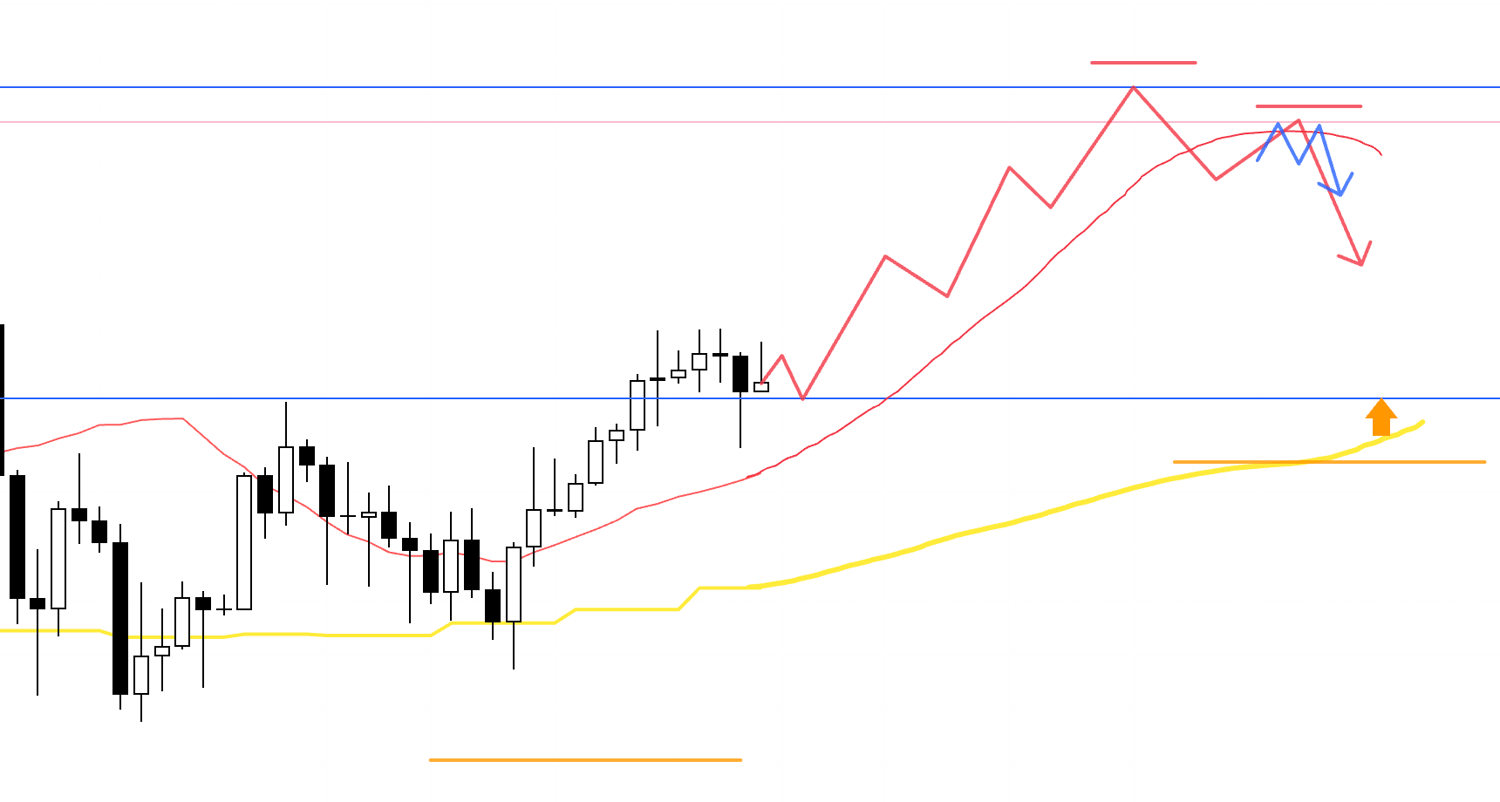
The 1D chart is in an uptrend with higher lows, but it still hasn’t been able to break the prior high.
In general, I’m looking to buy pullbacks, but the prior-high line is a key level to watch.
1D
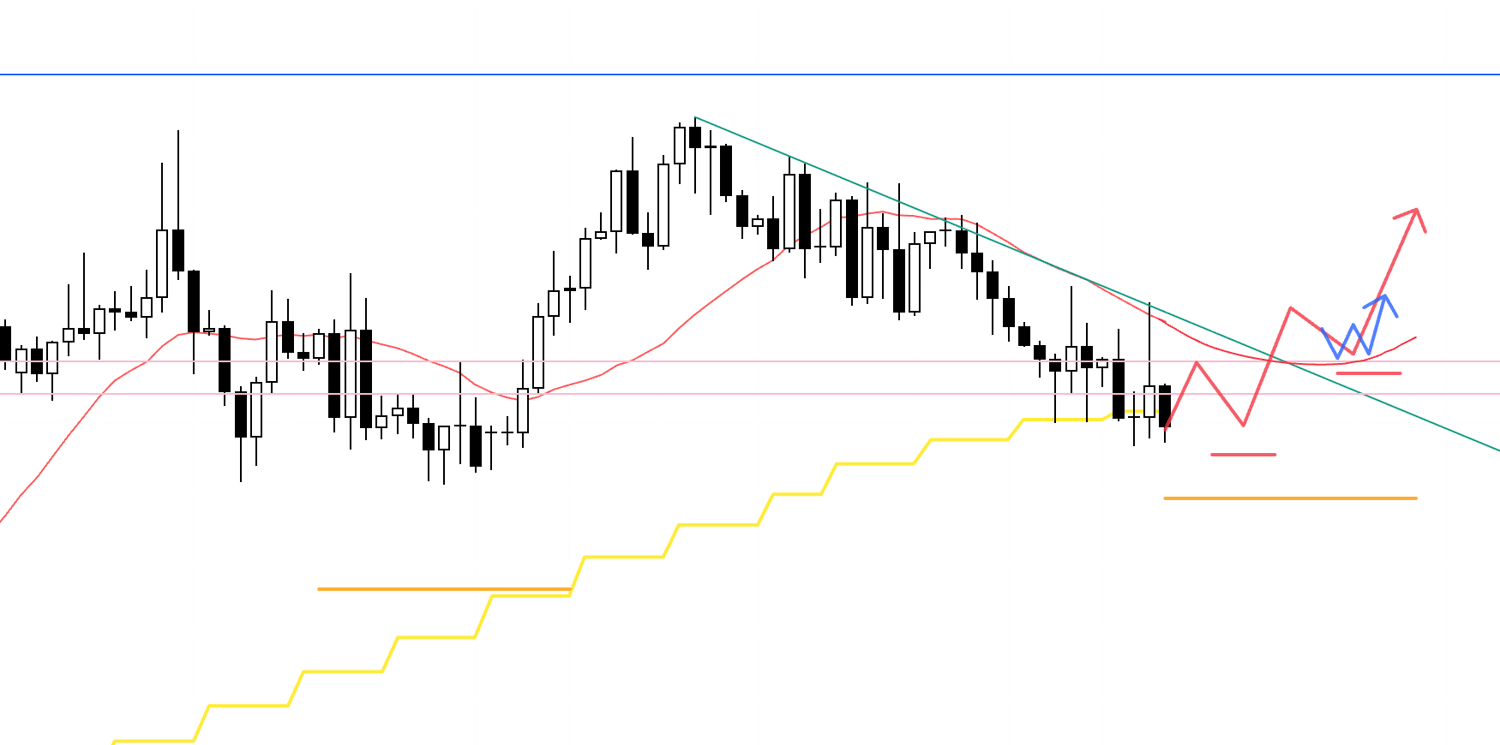
Since we couldn’t break the prior high, you could argue that the upside momentum is fading.
Even so, we’re still in an uptrend on the 1D, so it’s hard to sell immediately from here.
The point where it becomes easier for me to sell is, as shown on this chart, when we break below the moving average on the 1D and then get capped by the moving average as well, forming a clear lower-high point.
Even in that case, the blue line just below is also a level I want to keep an eye on.
It’s also a pullback-buy level on the weekly.
That said, there’s enough room on the timeframe I trade, so if conditions line up for selling, I’d like to consider it while weighing risk/reward.
With that in mind, let’s look at the 4h chart.
4h
On the 4h, if price finds support at some level like this and forms a higher-low point, I’ll consider buying on lower timeframes.
4h
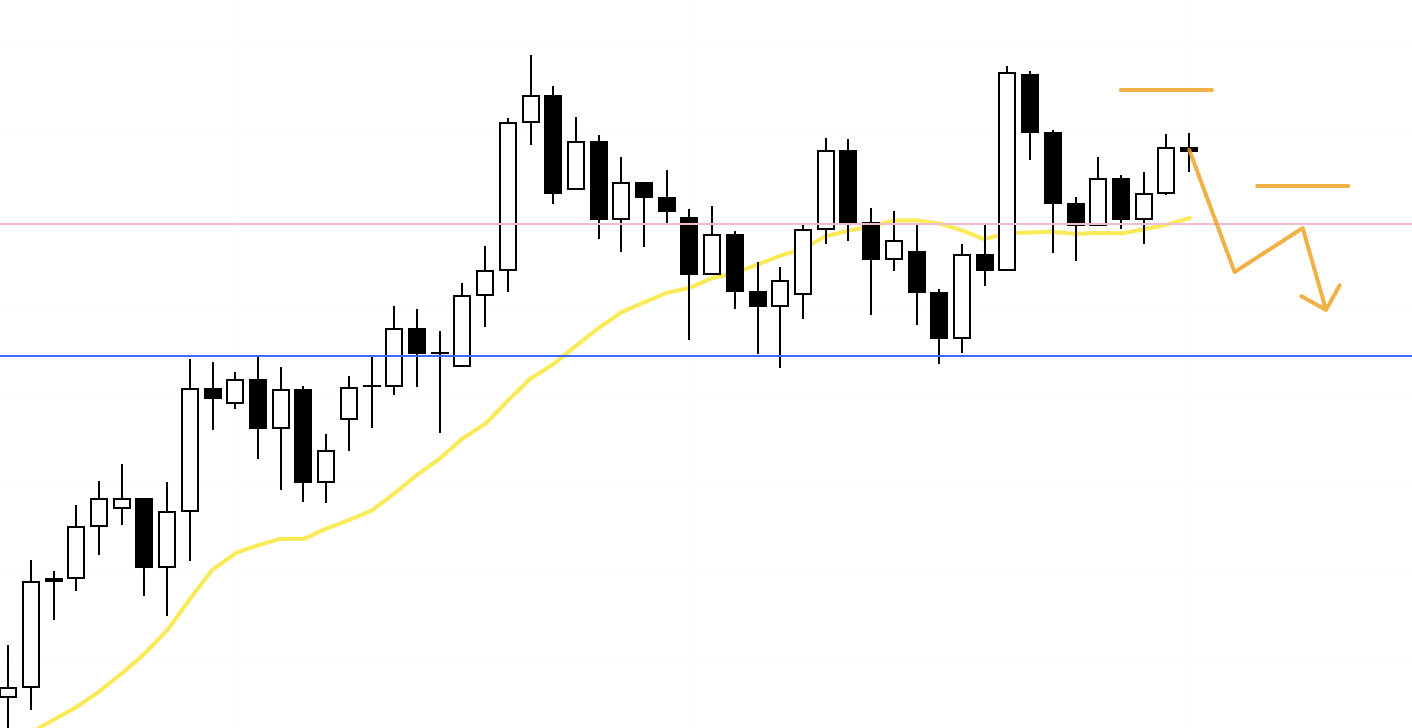
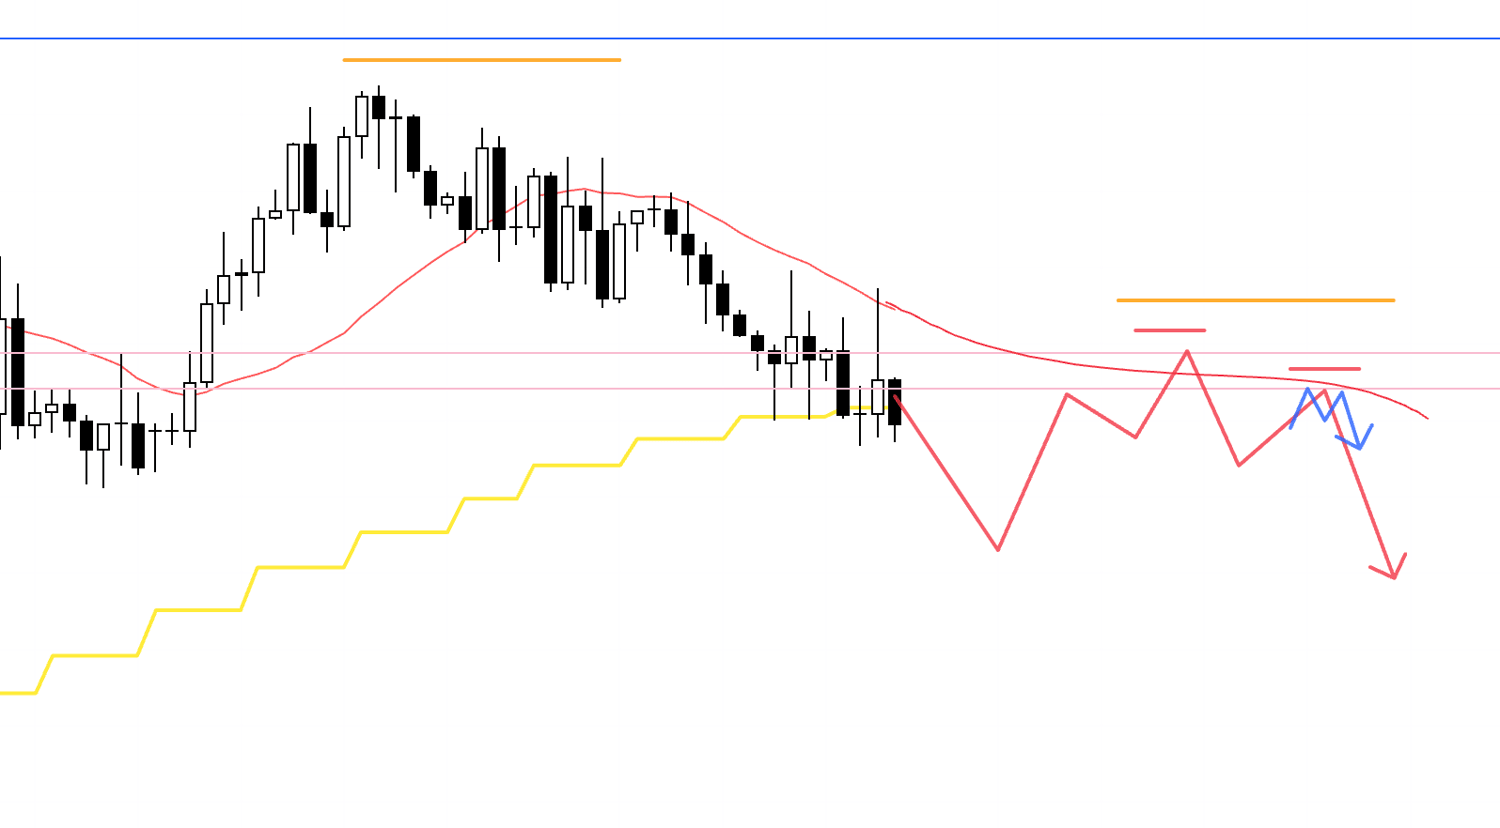
After the move up, if we ultimately fail to take out the prior high and then print a lower high on the 4h, I’ll consider a sell to follow the drop that closes the gap to the 1D moving average (yellow).
In this case, the 4h could still be an area where buying the pullback is in play, so I’ll also take into account whether we’ve broken below the 4h moving average (red).
The 1D is in an uptrend, and buying interest tends to increase as price gets cheaper, so I’ll focus on whether an entry with strong risk/reward shows up.
If I’m in a position and price reaches the area around the blue line below, I’ll respond by securing partial profits, such as taking half off.
4h
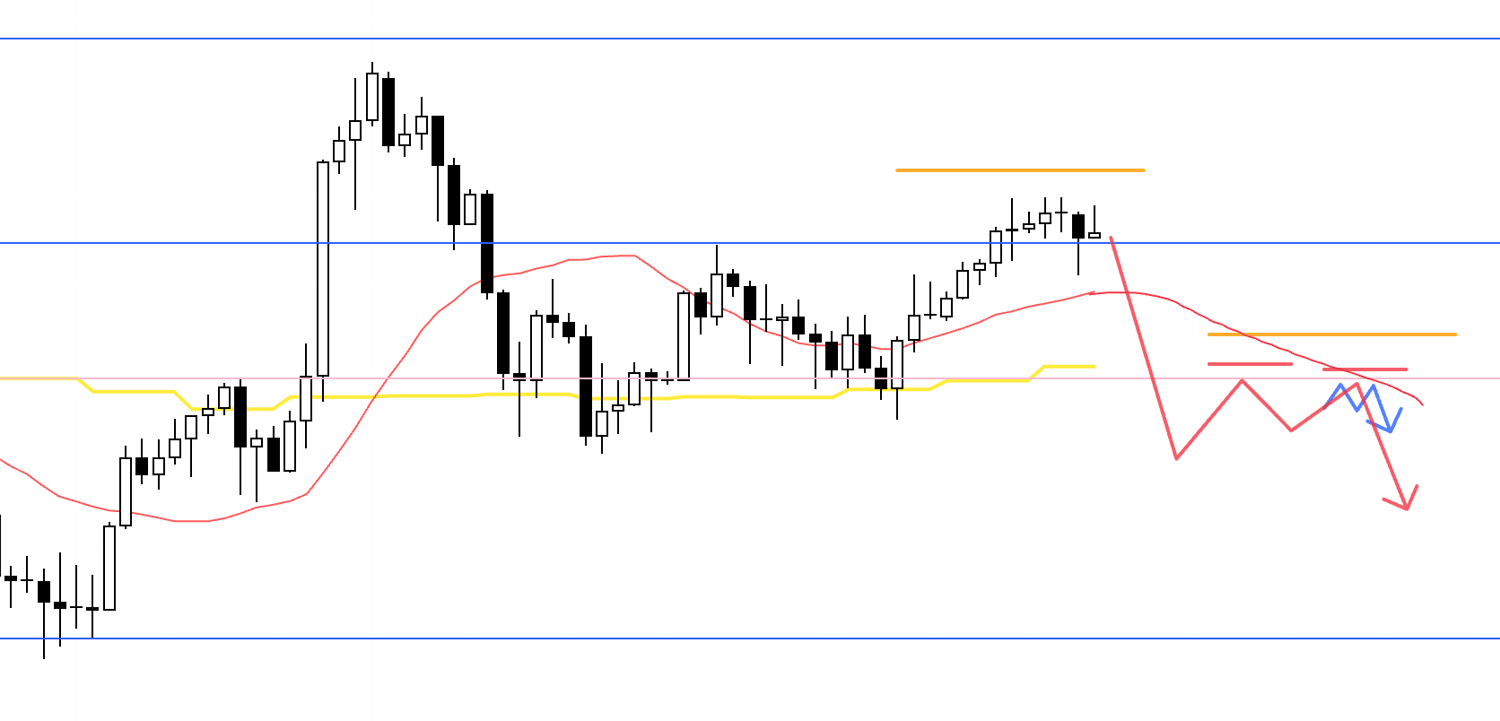
If we break below the 1D moving average like this, and within the 1D lower-high structure we also form a lower-high point on the 4h, I’ll then consider selling on lower timeframes.
In that case, I’ll check whether an entry appears where the risk/reward to the blue line below lines up.
Next, let’s take a look at EURUSD.
EURUSD
1D
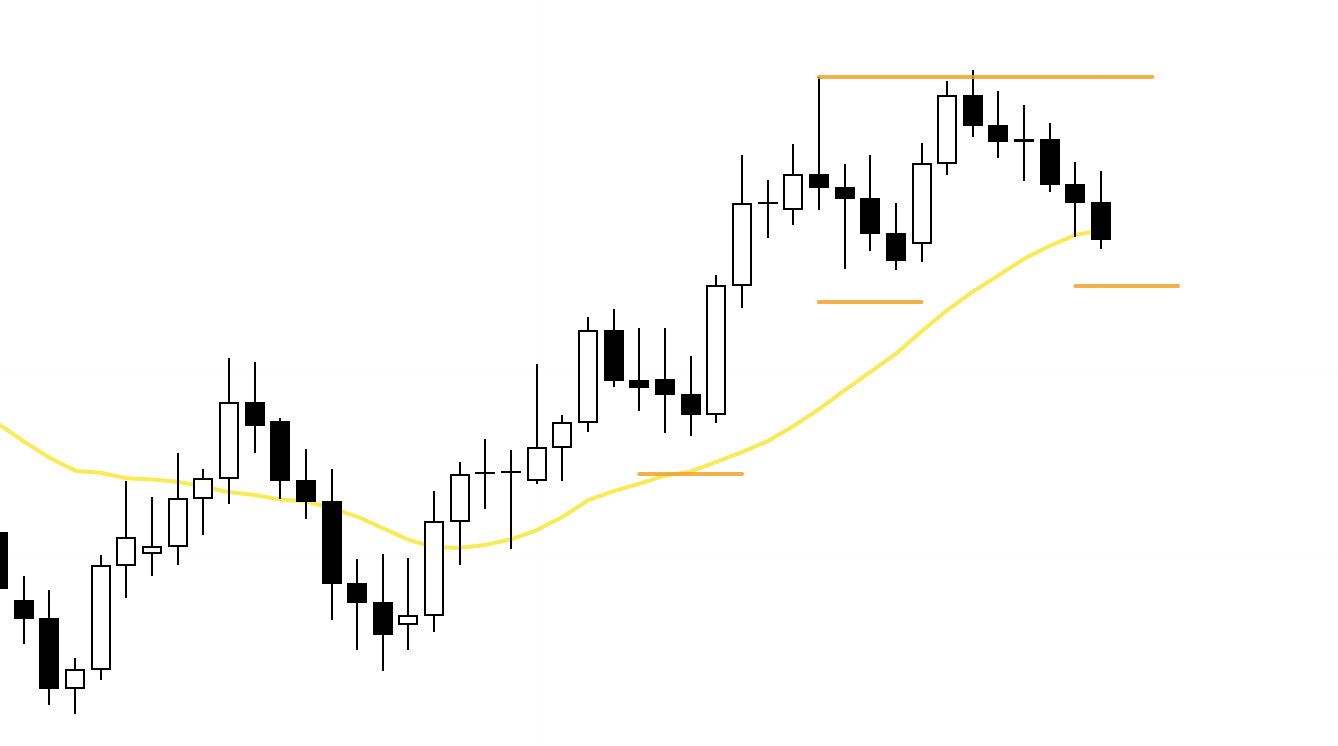
EURUSD is also in an uptrend, printing higher lows and new highs, but like USDJPY, it’s pulling back after failing to cleanly break the prior high.
However, it still hasn’t broken the prior low, and this is also a pullback-buy area, so I can’t start selling immediately.
1D
So here as well, as we saw on USDJPY, if we break below the moving average and form a new lower-high point, I’ll consider selling on lower timeframes to follow the drop as the first leg of a 1D downtrend.
Let’s look at the 4h as well.
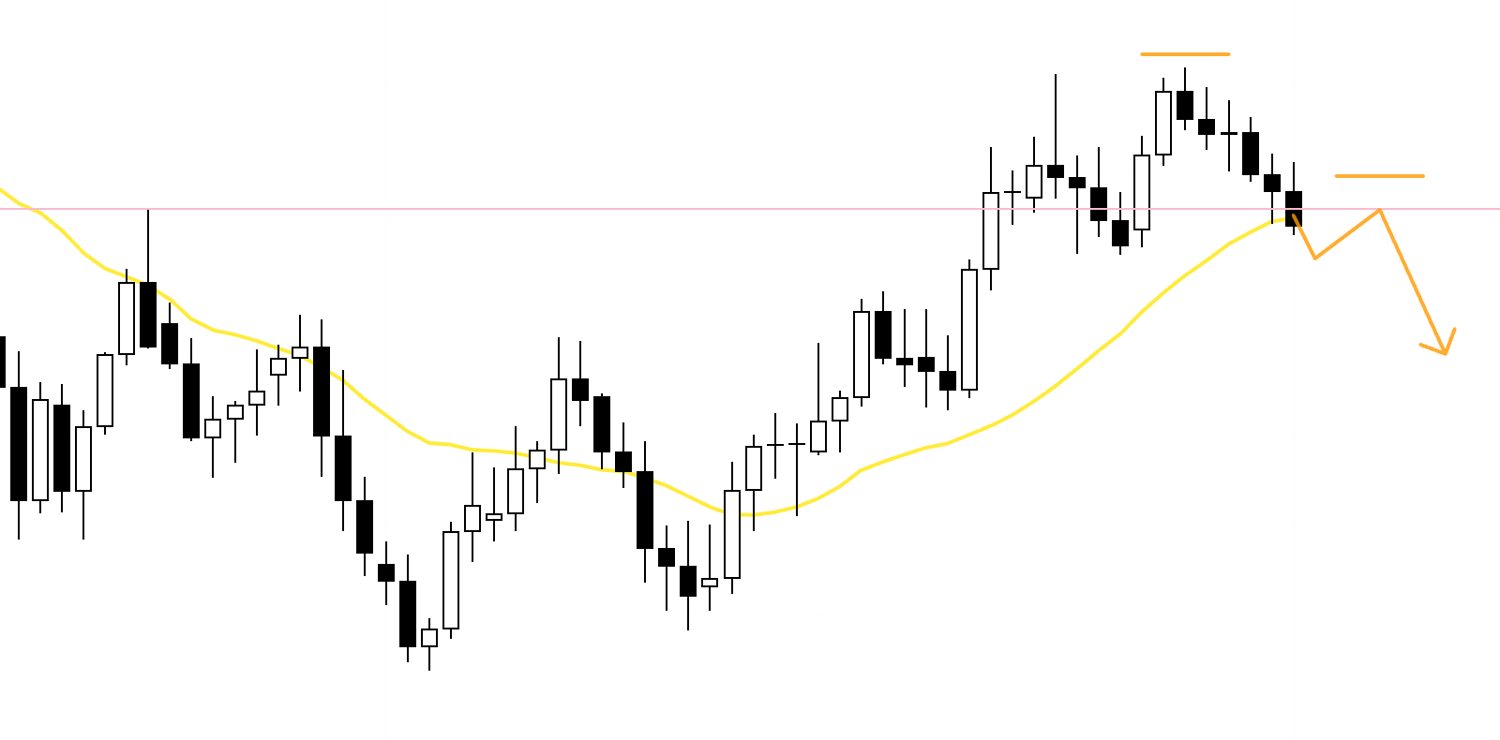
4h

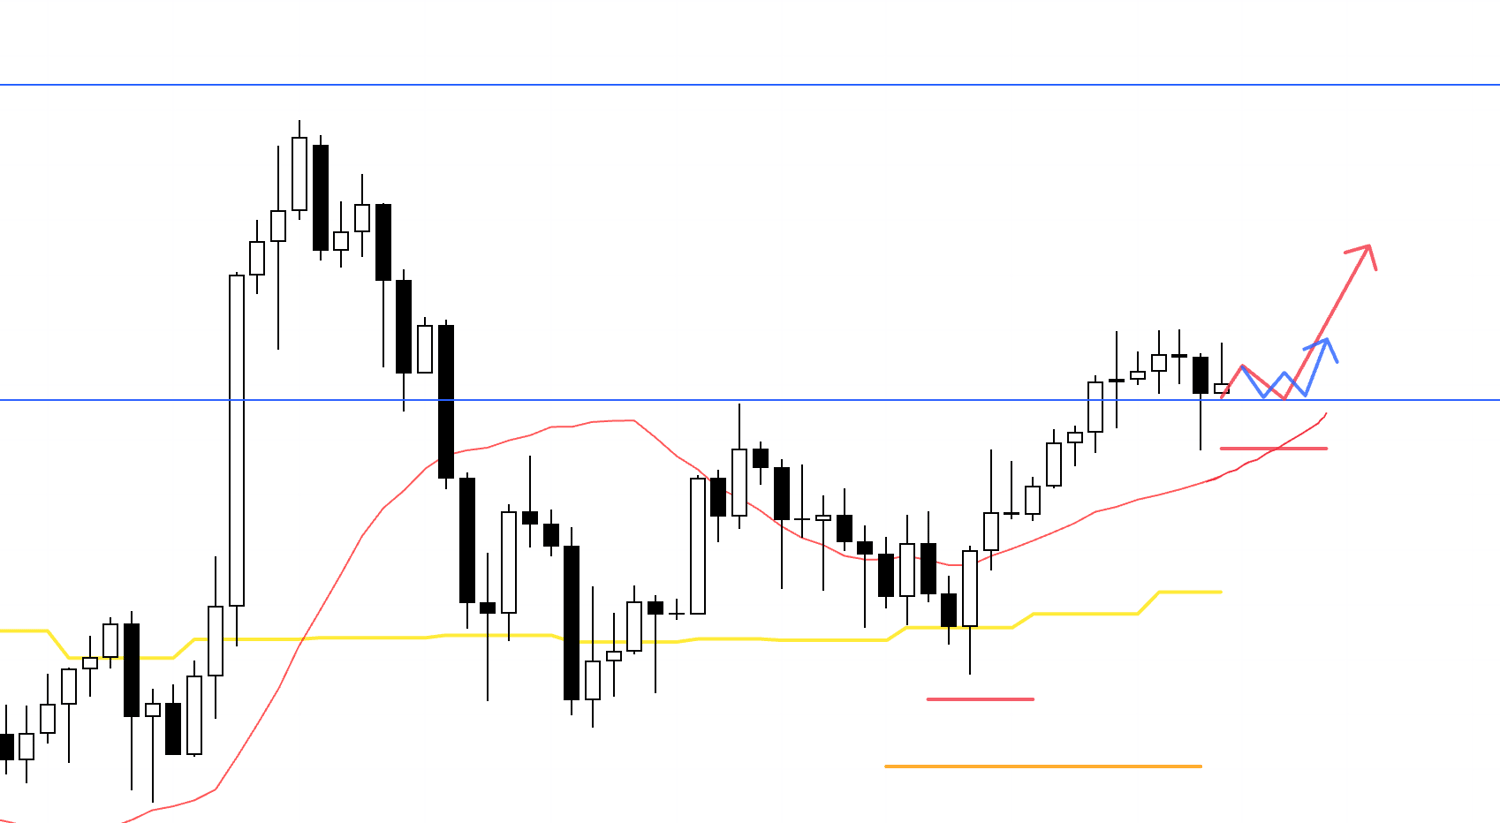
Right now we’re at a 1D pullback-buy area, so if the 4h breaks above the downtrend line (green) and forms a higher-low point on the 4h, I’ll consider buying on lower timeframes.
4h
On the other hand, if we break below the 1D moving average (yellow) and form a 1D lower-high point, then within that structure I’ll consider selling on lower timeframes off a 4h lower-high point.
That’s it.
These are the scenarios as of now, and once the week starts, I want to watch how price actually moves and update or rebuild the scenarios as needed.
This trade scenario is purely my own plan, so if you haven’t settled on how you trade yet, I hope it can be helpful as a reference for building your own strategy.
But if your trading is already established, don’t let my trade plan distract you, and make sure you follow your own rules.
Thanks for reading to the end.