

In this report I will review the key points of my trading this week, focusing on the actual trades I took.
This Weekly Trade Report is published every Saturday.
When you read it together with Trade Scenarios, which I post every Sunday, I believe it will give you a useful reference for how I think in advance and how I actually execute trades based on those scenarios.
This is not advice saying “you should trade like this,” nor am I claiming that this is the correct answer.
It is not about showcasing individual winning or losing trades, nor is it about recommending a specific strategy based on those results.
My purpose is to show, at a practical level, how I repeatedly follow a consistent process based on pre-defined scenarios, and to offer that as a reference for your own strategy building and for achieving consistency in your process.
The outcomes I show are nothing more than my personal results, and they do not guarantee your future profits.
Please keep that firmly in mind, and when it comes to your own trading, make sure you carry out your own testing and preparation, and trade entirely under your own responsibility.
My trading is based on buying pullbacks and selling rallies on the 4h timeframe.
If you are interested in my pullback and rally strategy, please read my past blog posts on Dow Theory and multi-timeframe analysis.
Now, please take a look at the following charts.
USDJPY 4h

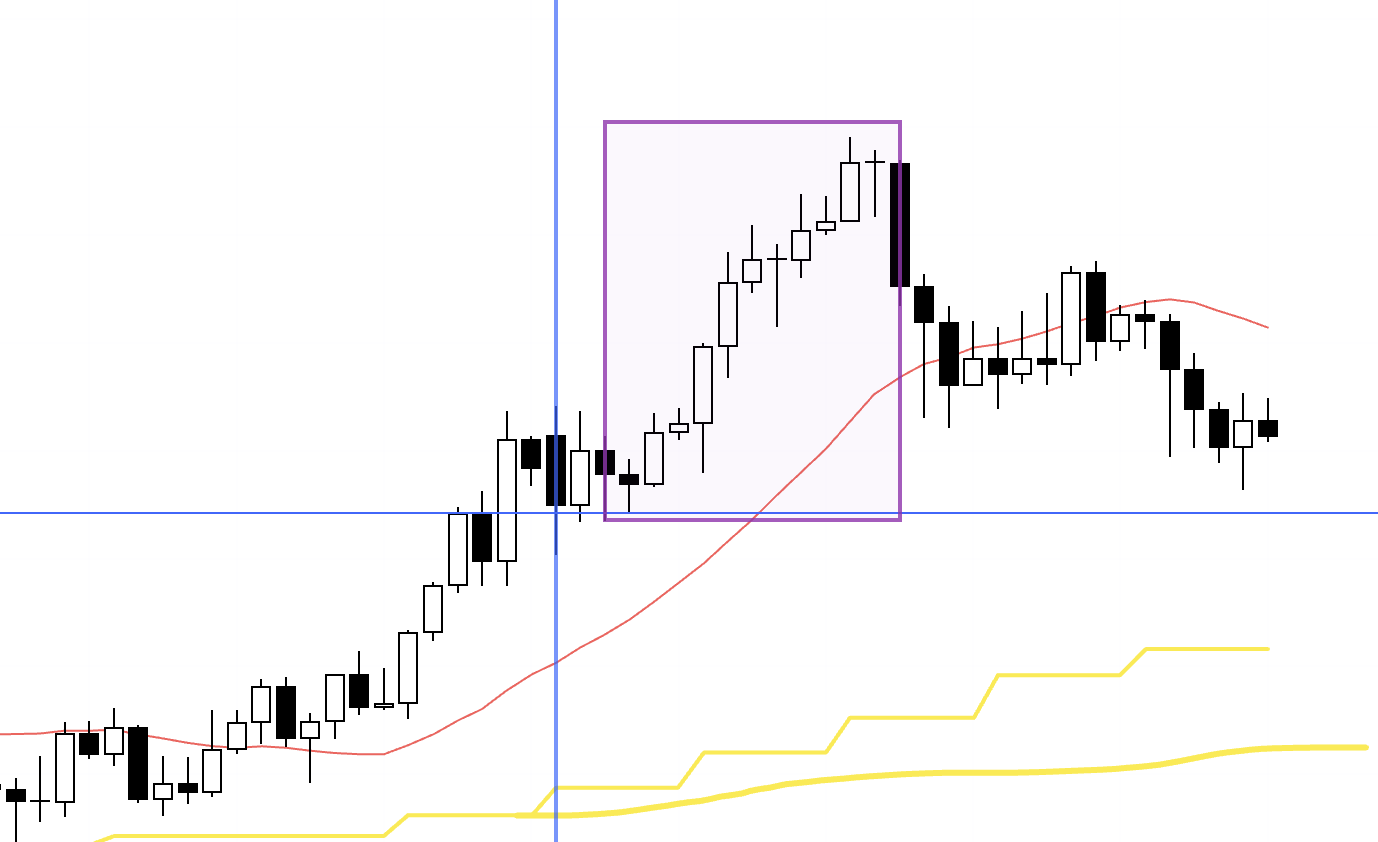
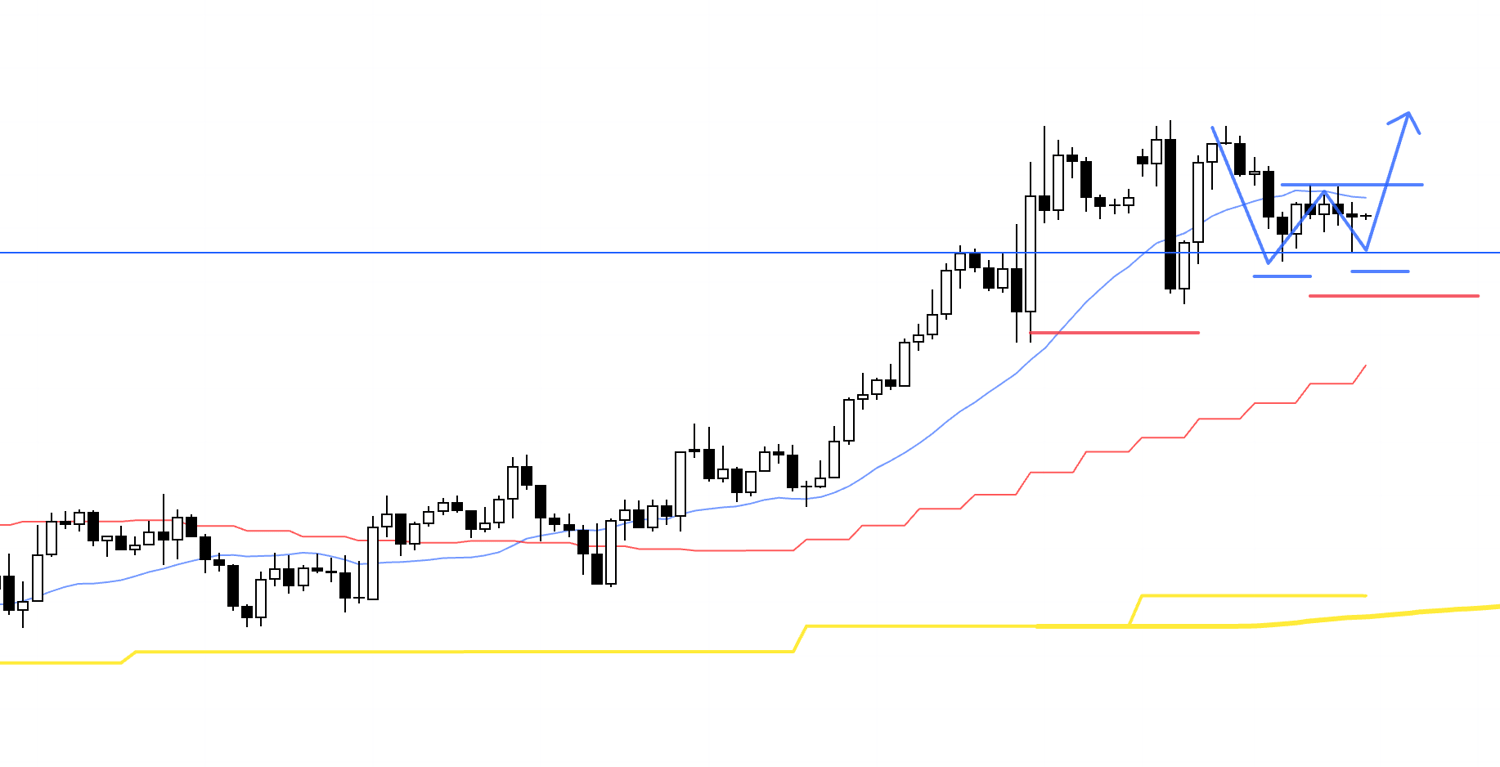
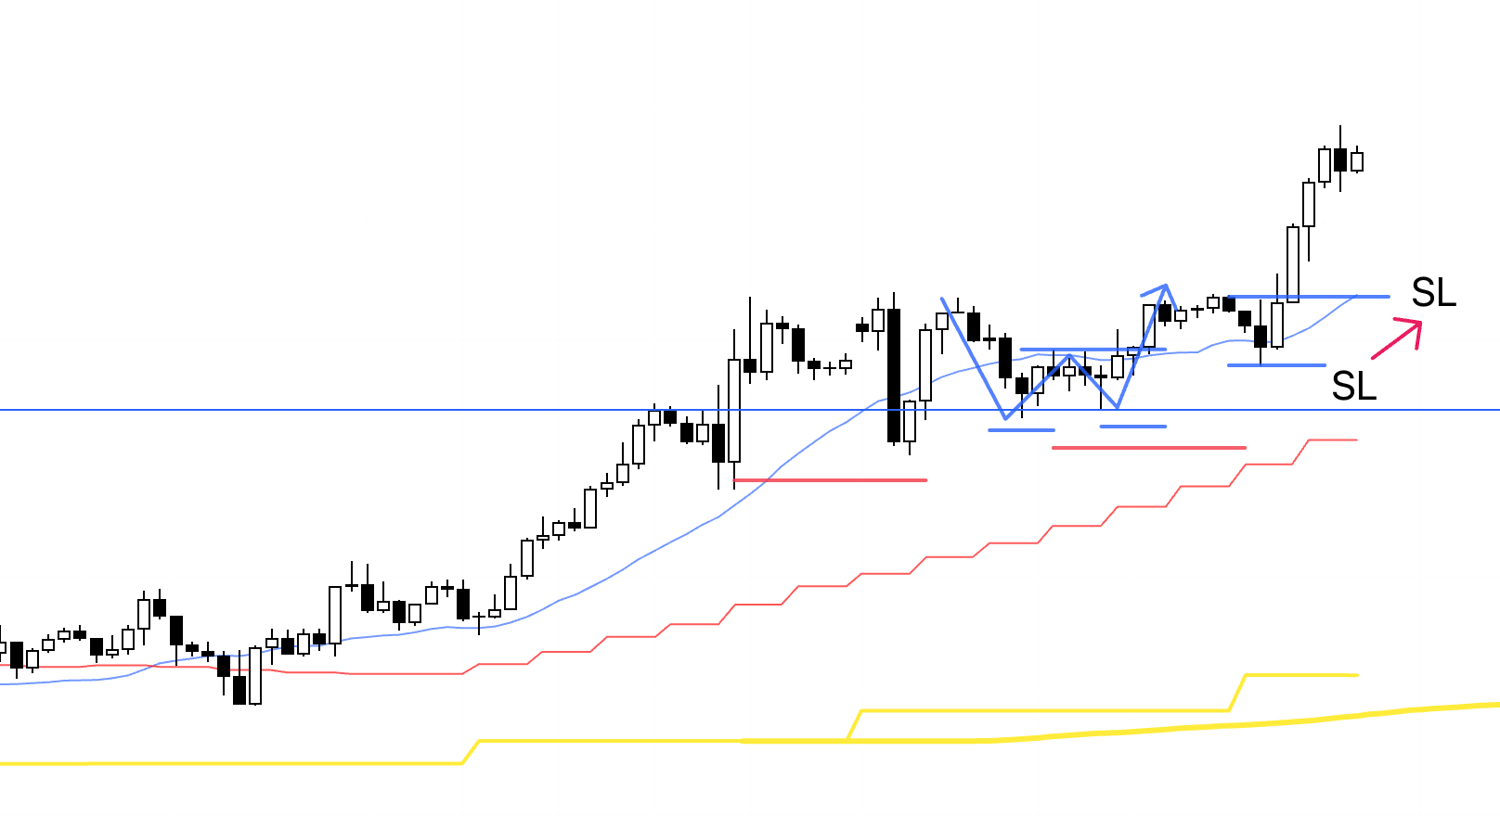
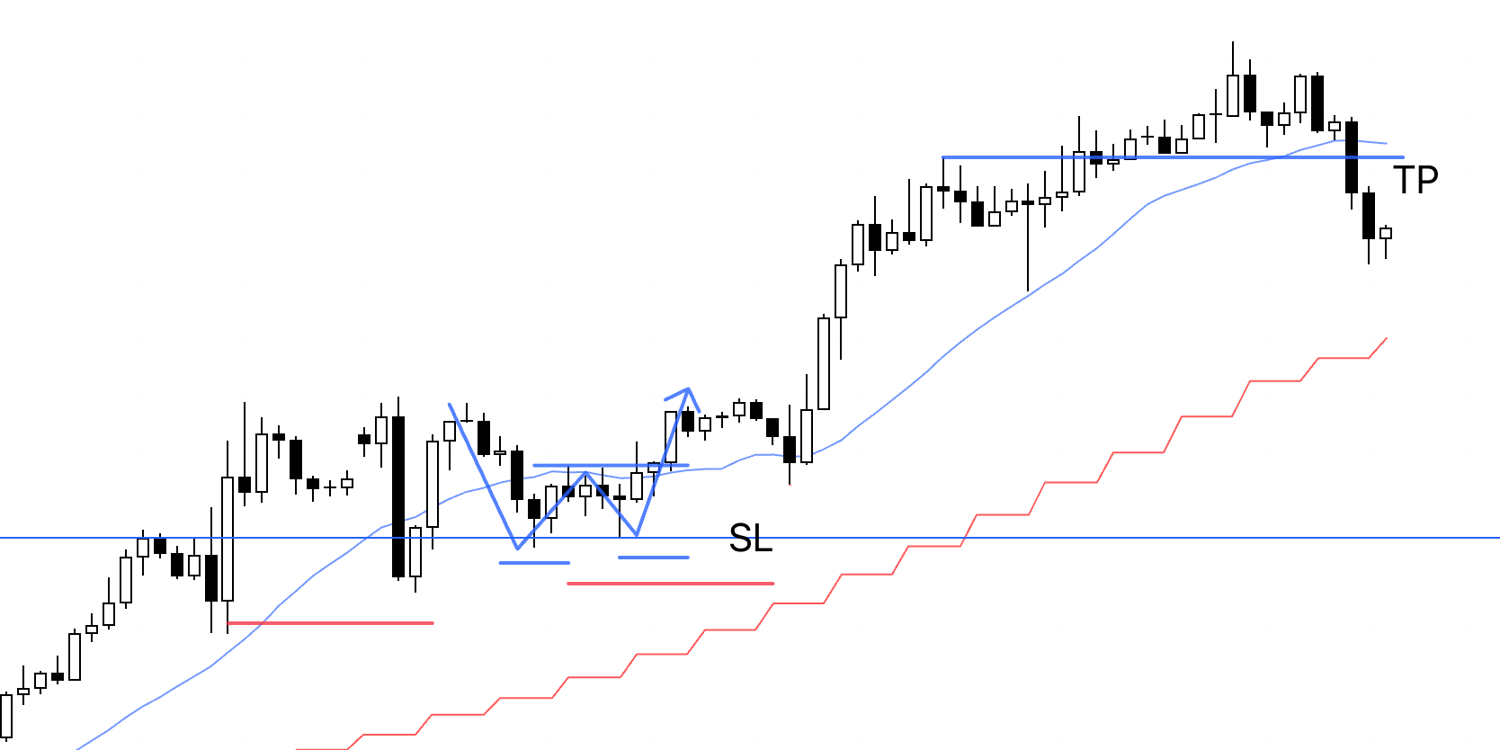
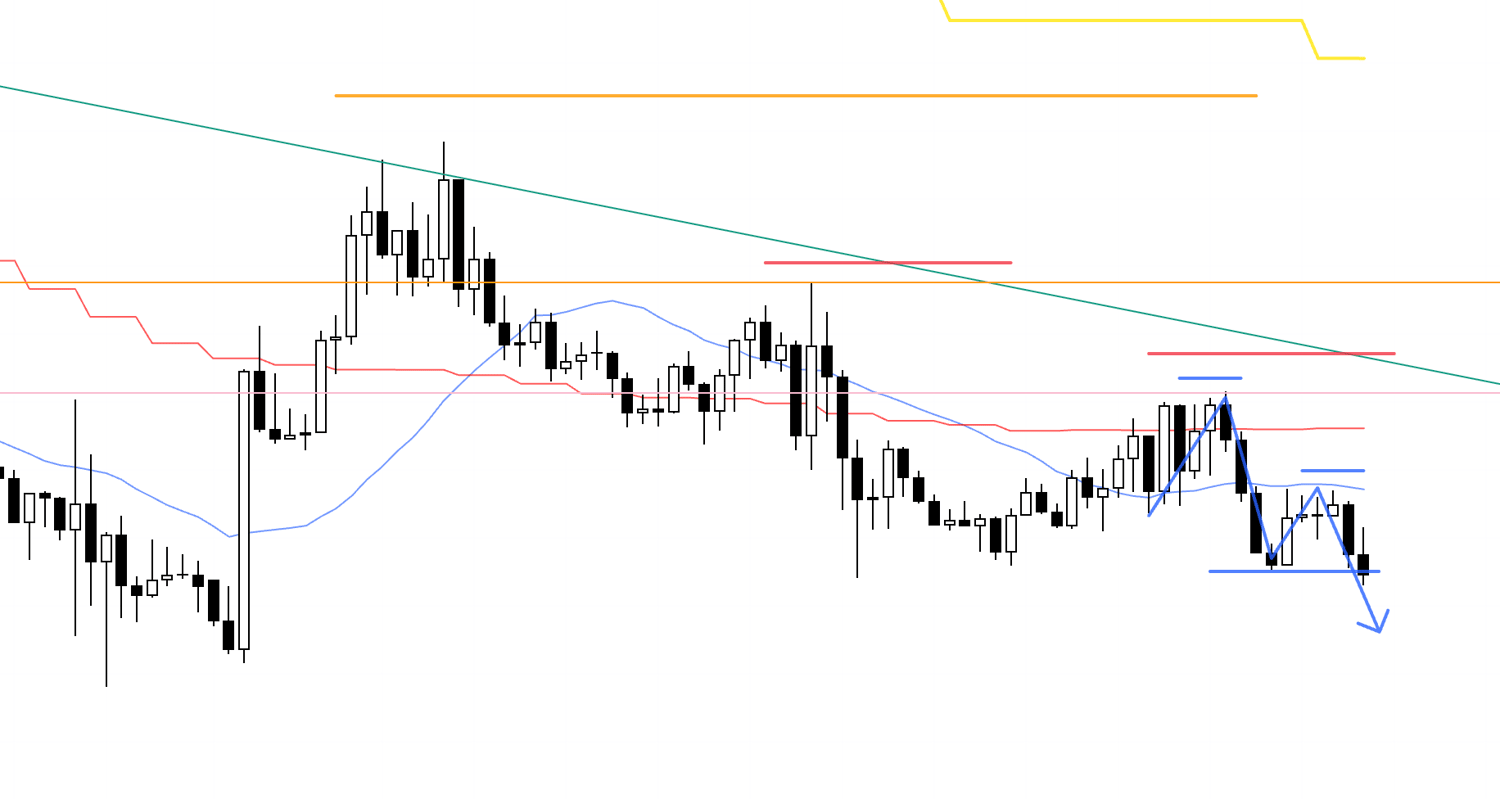
This is the USDJPY 4h chart.
This week’s action is what follows the blue vertical line on the chart.
This week, I traded USDJPY in the boxed area.
It was a long taken from the scenario I laid out in last Sunday’s scenario post.
I recorded my thoughts and actions in real time as it unfolded, so I’ll share that log later.
Next, please take a look at the EURUSD chart below.
EURUSD 4h
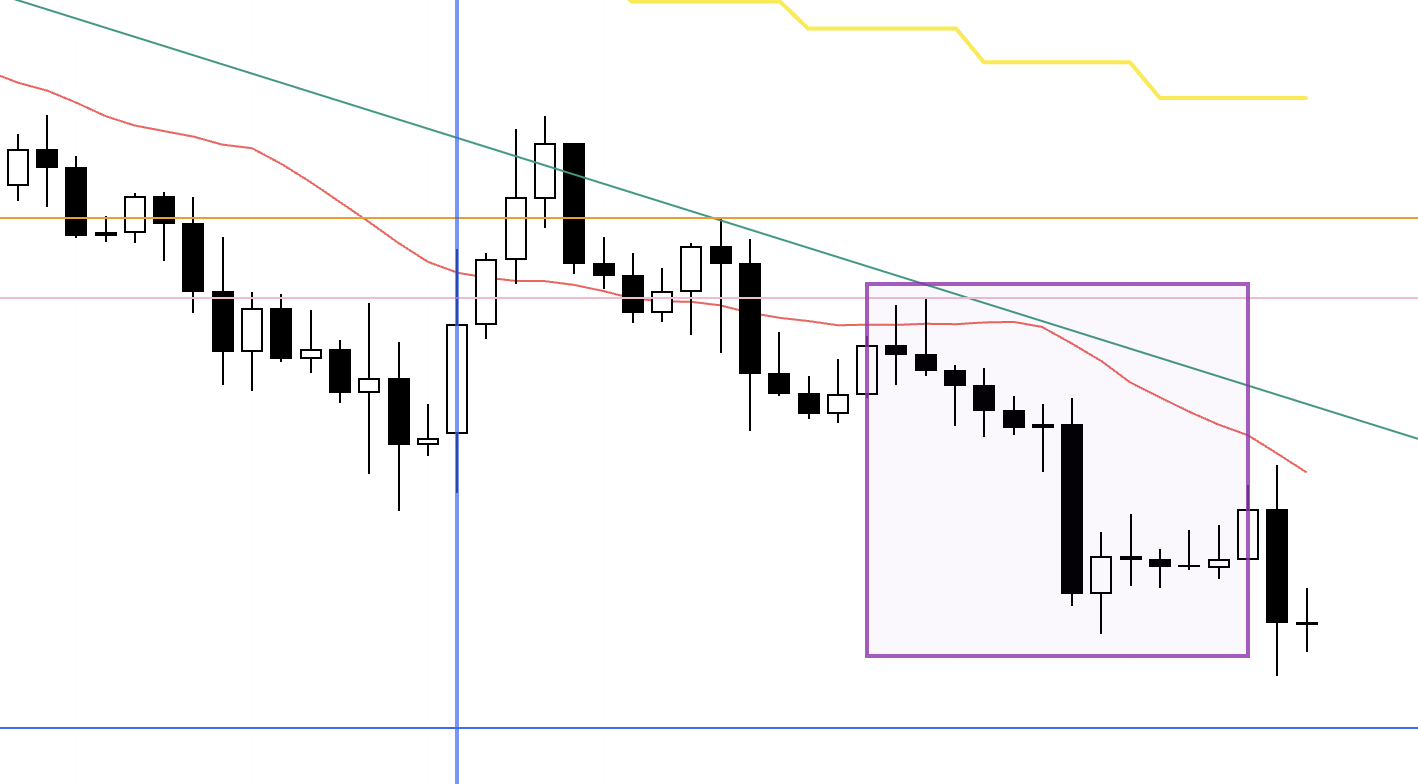
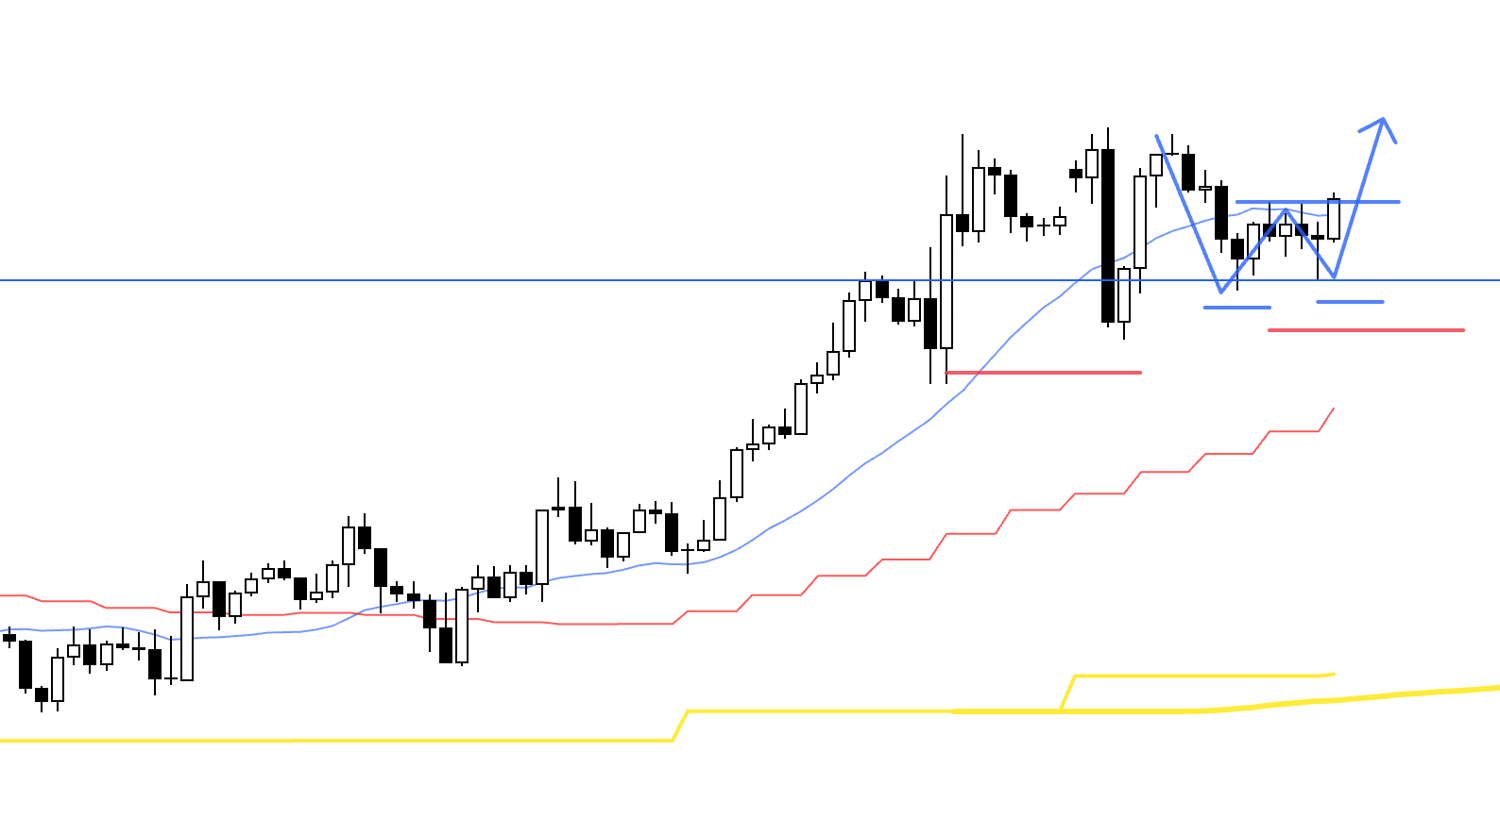
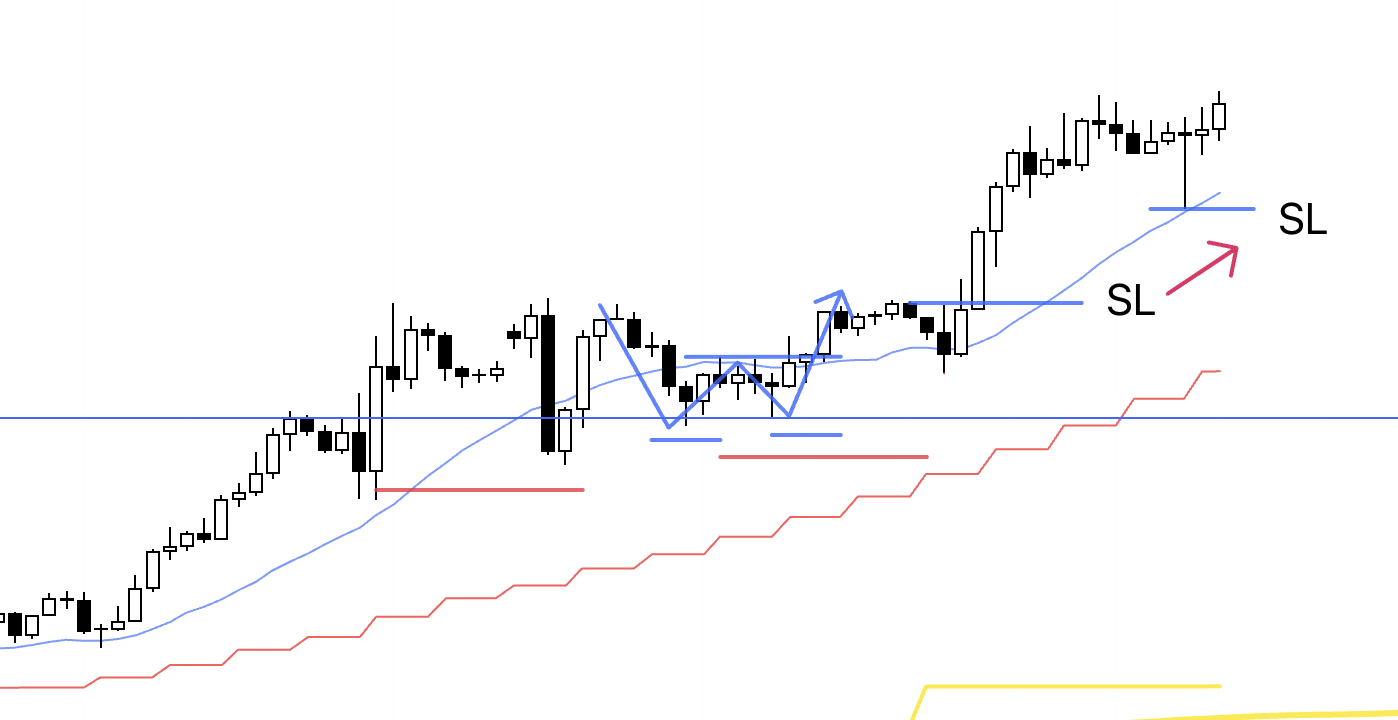
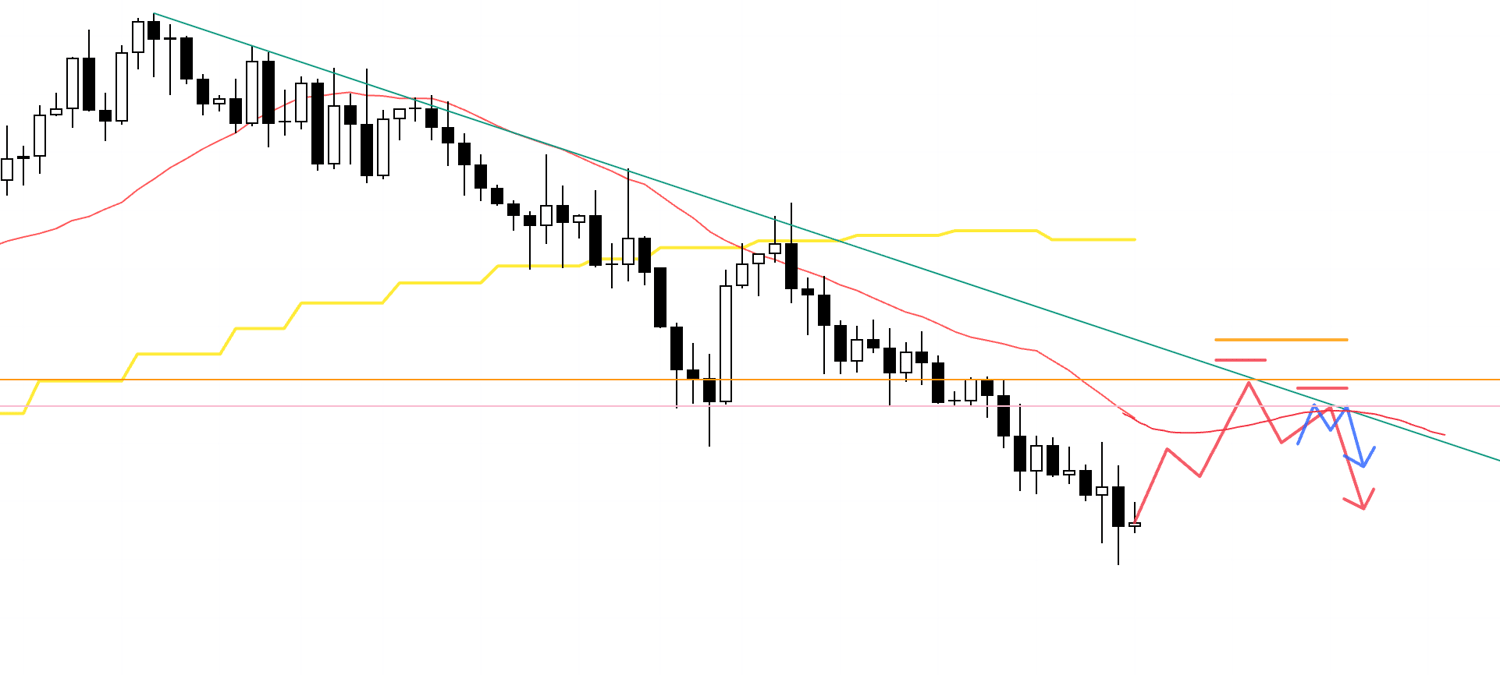
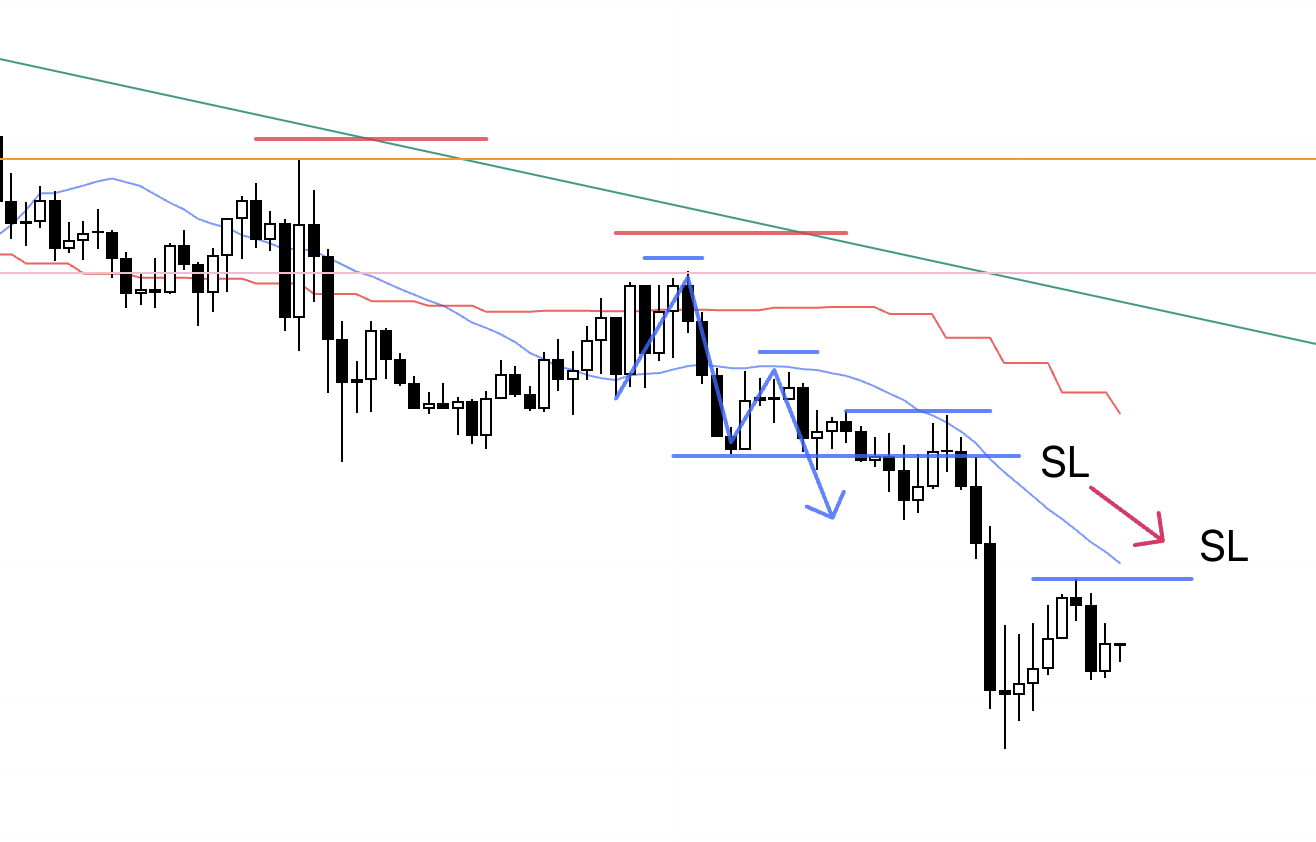
This is the EURUSD 4h chart.
I took one trade in EURUSD in the boxed area.
This one also played out exactly in line with the scenario I had set in last Sunday’s scenario post.
Now I’ll break down the levels I traded this week below, while introducing my in-the-moment notes from each trade.
January 12 (Mon)
USDJPY
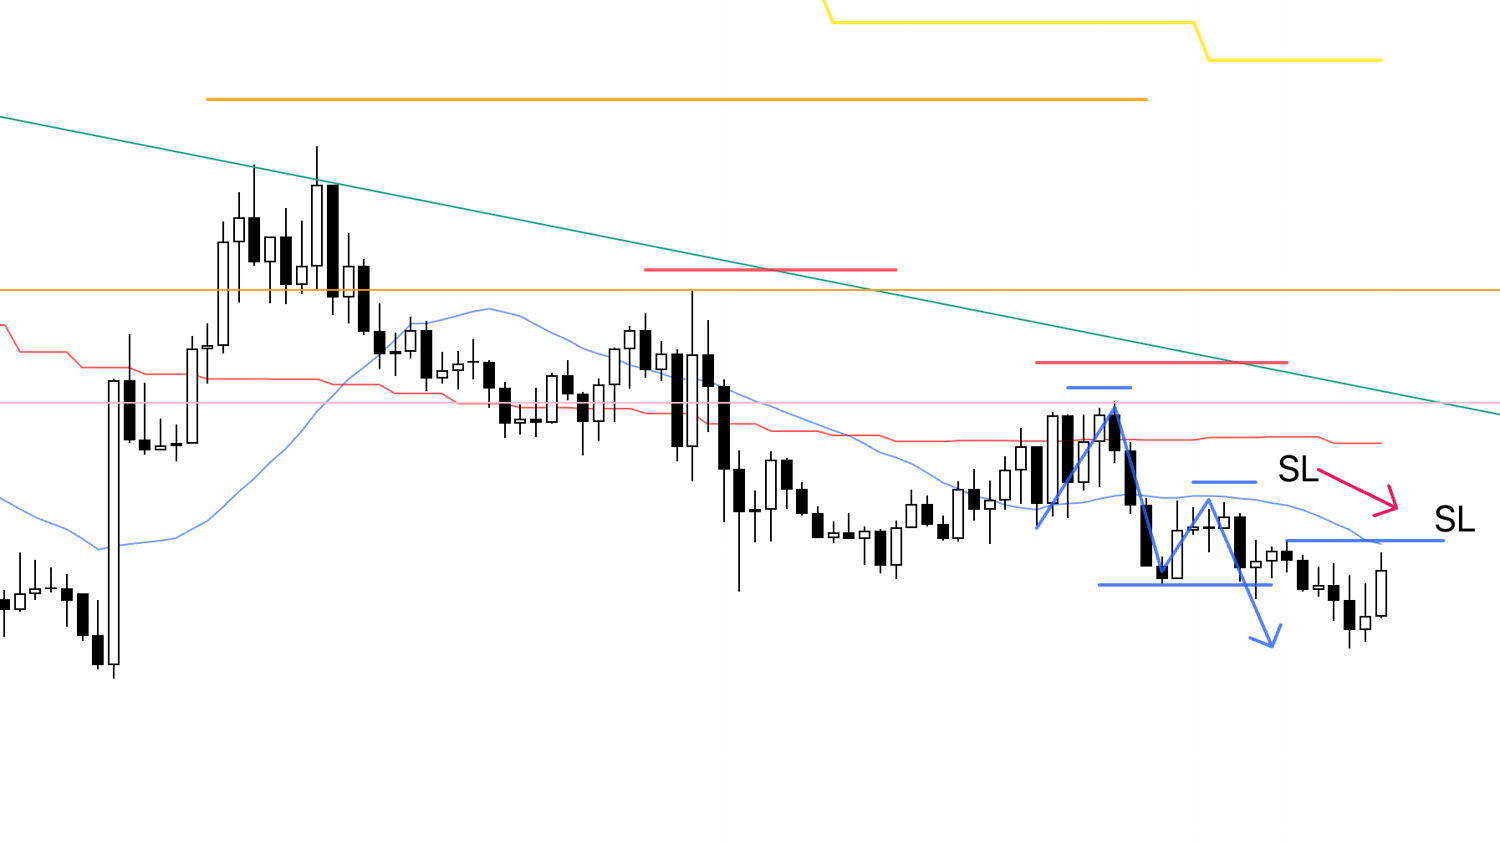
4h chart from Sunday’s scenario post
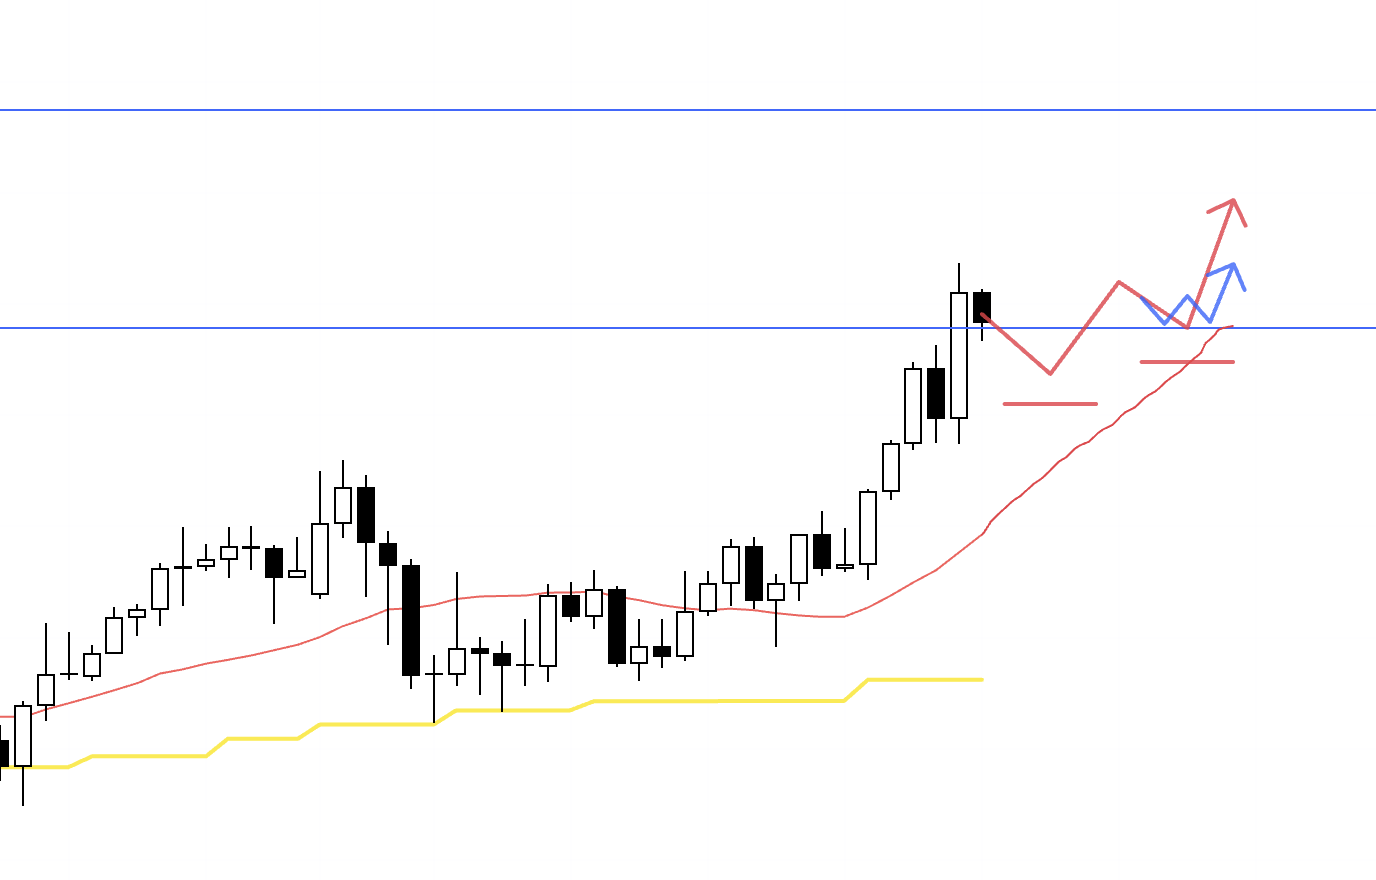
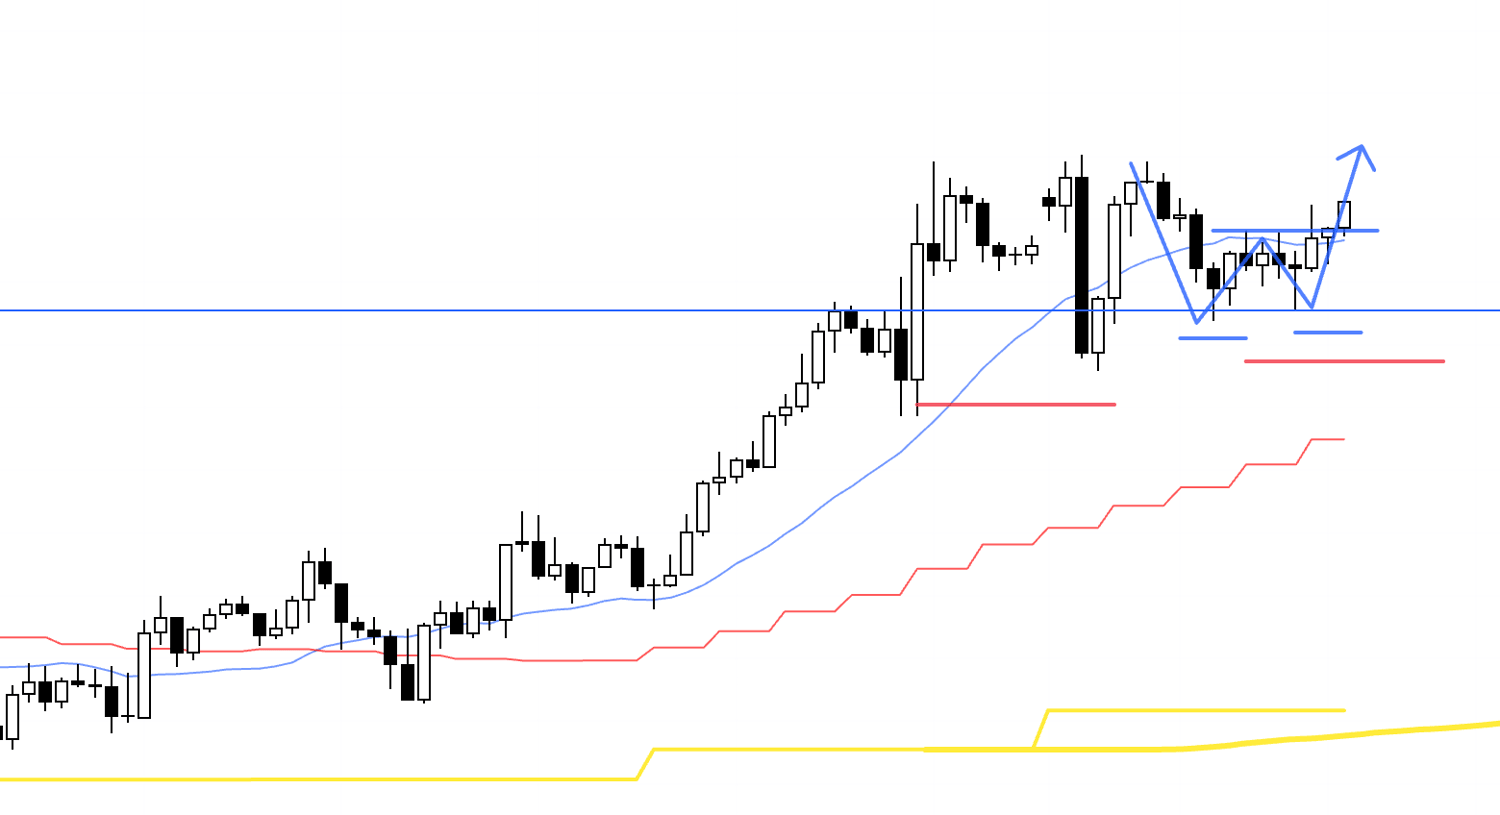
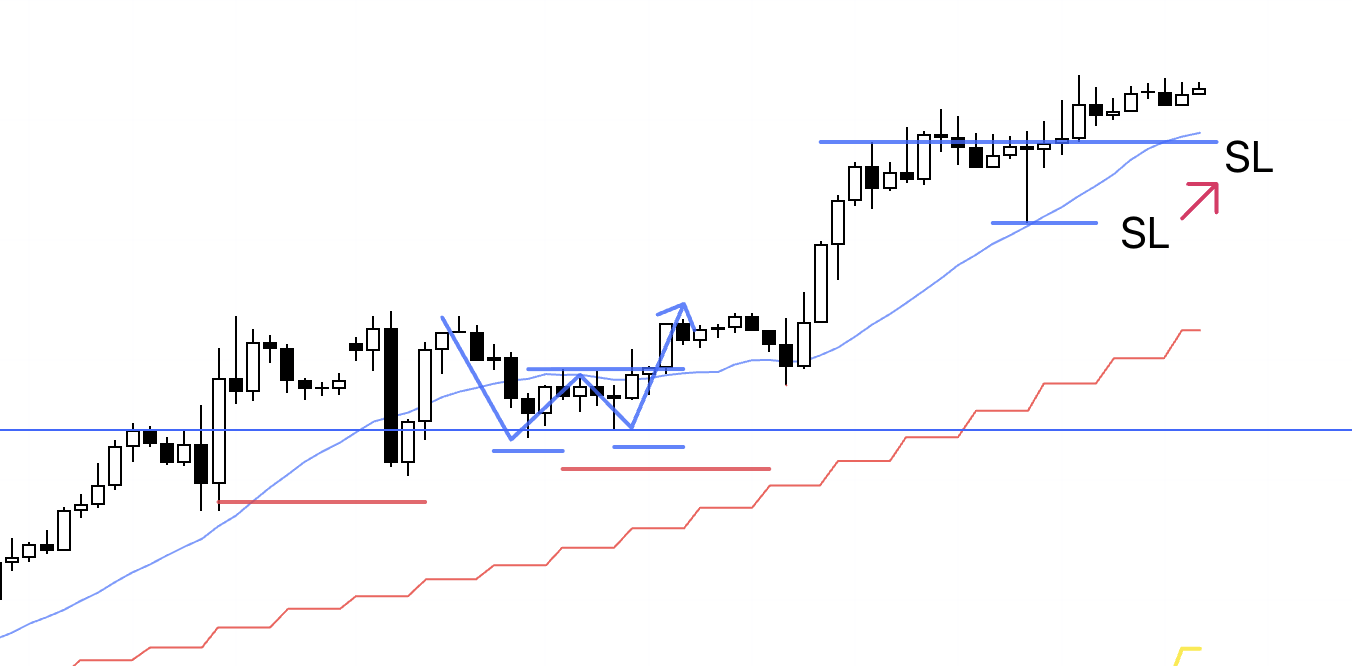
This is the chart from Sunday’s scenario post.
The 4h higher-low pivot I was watching for in the scenario did form, so I placed a buy order.
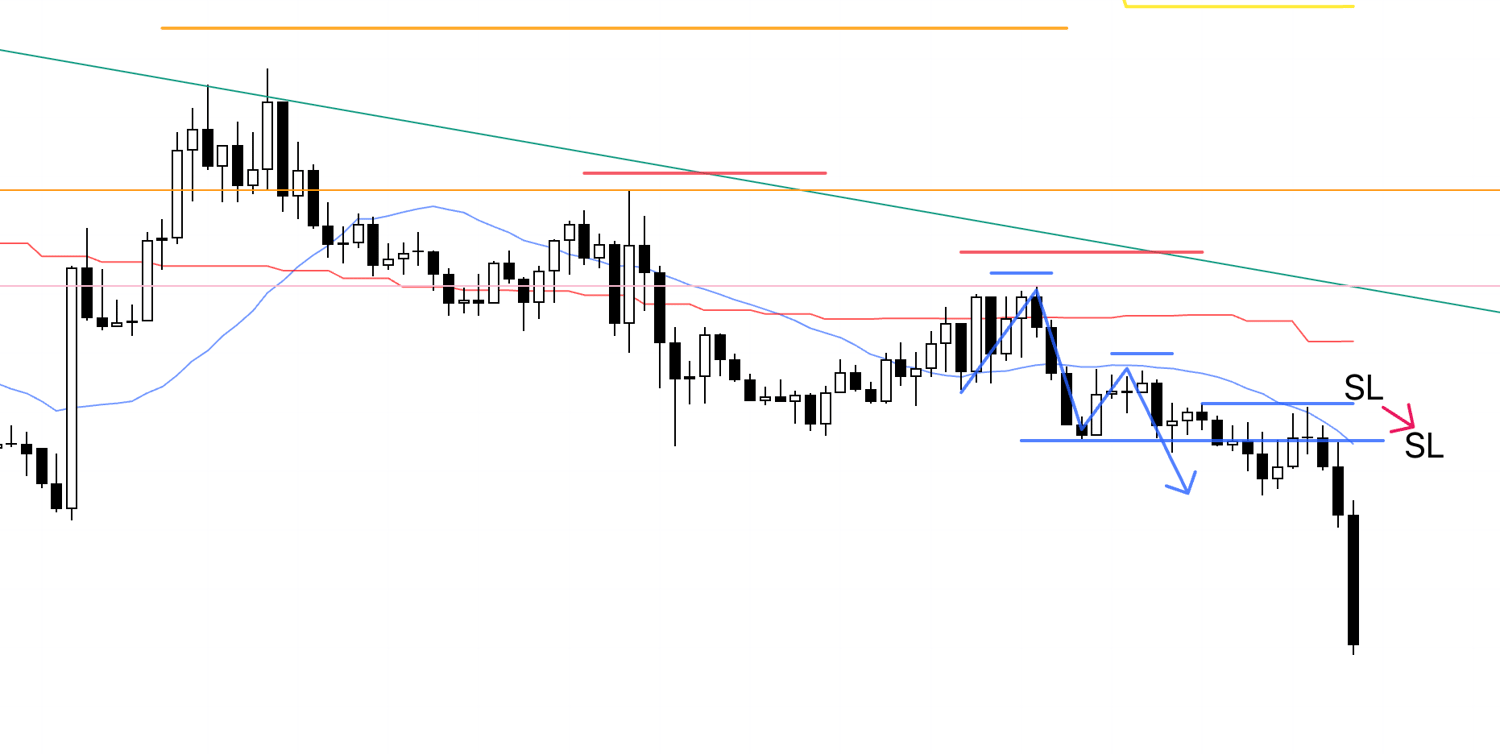
4h
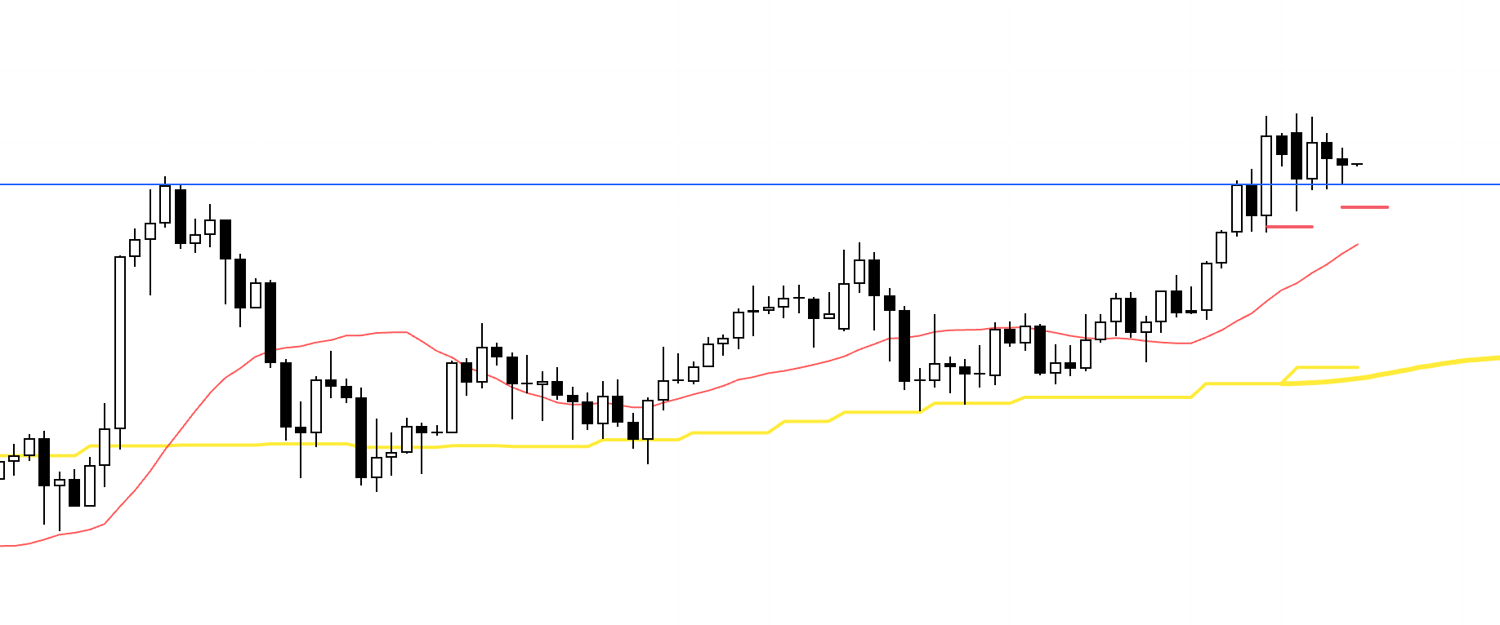
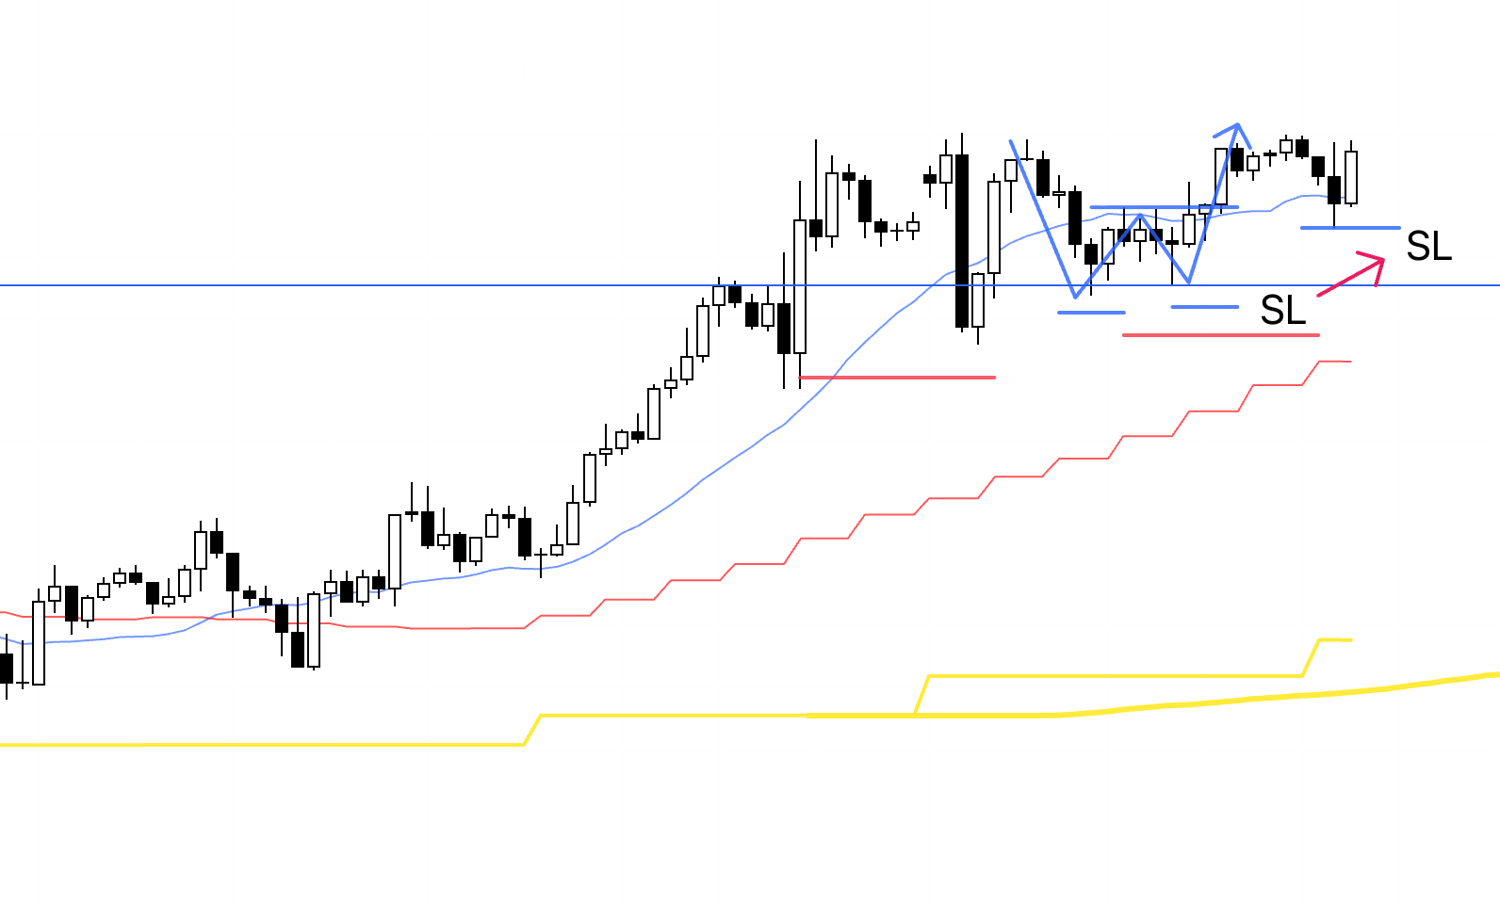
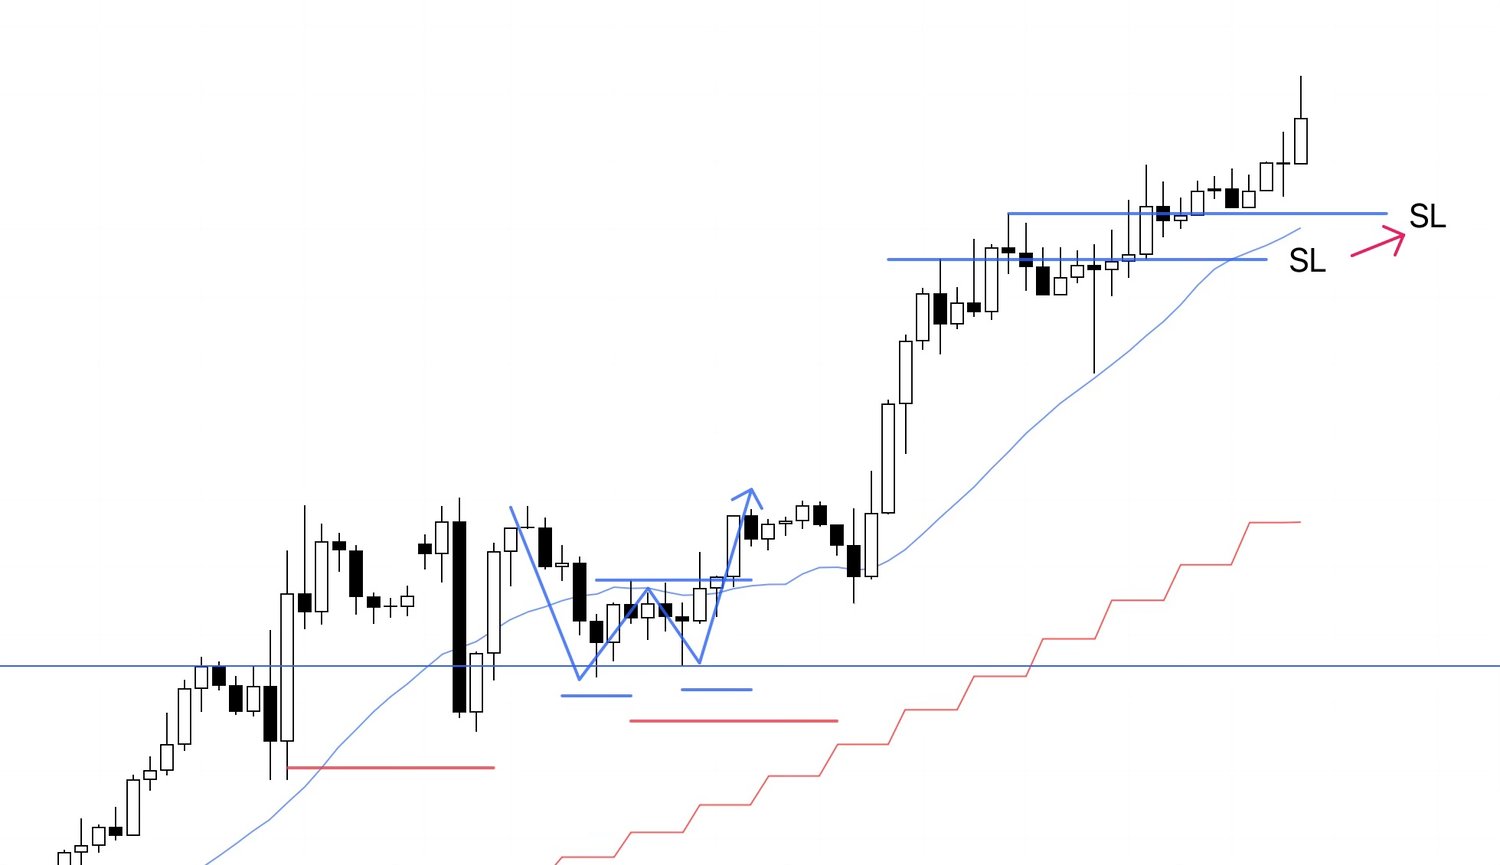
This is the current live 4h chart.
It formed a 4h higher-low pivot as if it were being supported by the prior swing high.
Let’s look at the 1h as well.
1h
On the 1h, the uptrend broke once, and now it’s trying to start a fresh uptrend again.
A restart of an uptrend while being supported by this blue line is a point where the upside edge rises sharply, so it’s absolutely a level I want to trade.
1h
My stop order was triggered and I’m in.
My SL is below the swing low.
I’ll hold this until the 1h trend breaks.
1h
I’m going to bed now.
1h
After waking up, I moved my SL higher.
1h
I moved my SL higher.
1h
I moved my SL higher.
I’m going to bed now.
1h
After waking up, I moved my SL higher.
1h
I moved my SL higher.
1h
Price hit the trailing stop I had been stepping up, and this trade is over.
January 15 (Thu)
EURUSD
4h chart from Sunday’s scenario post
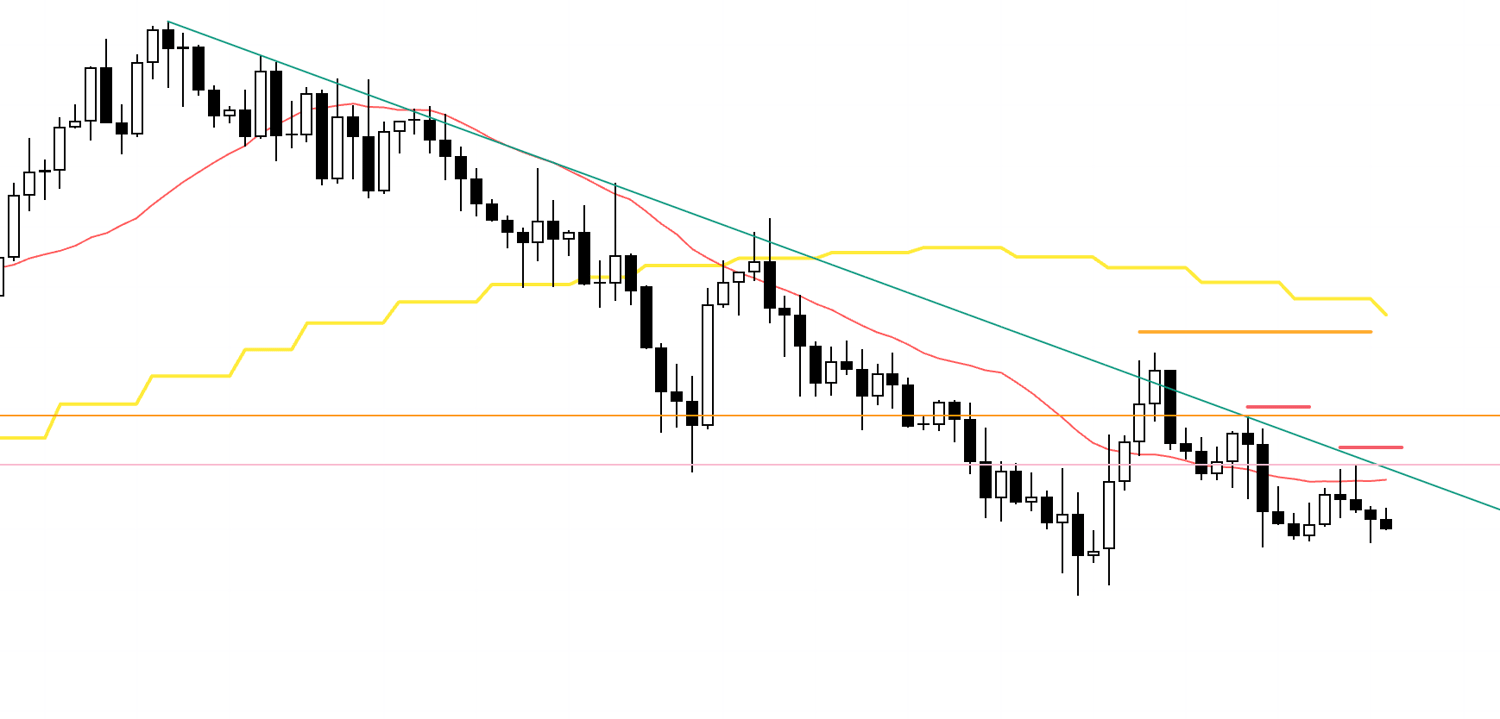
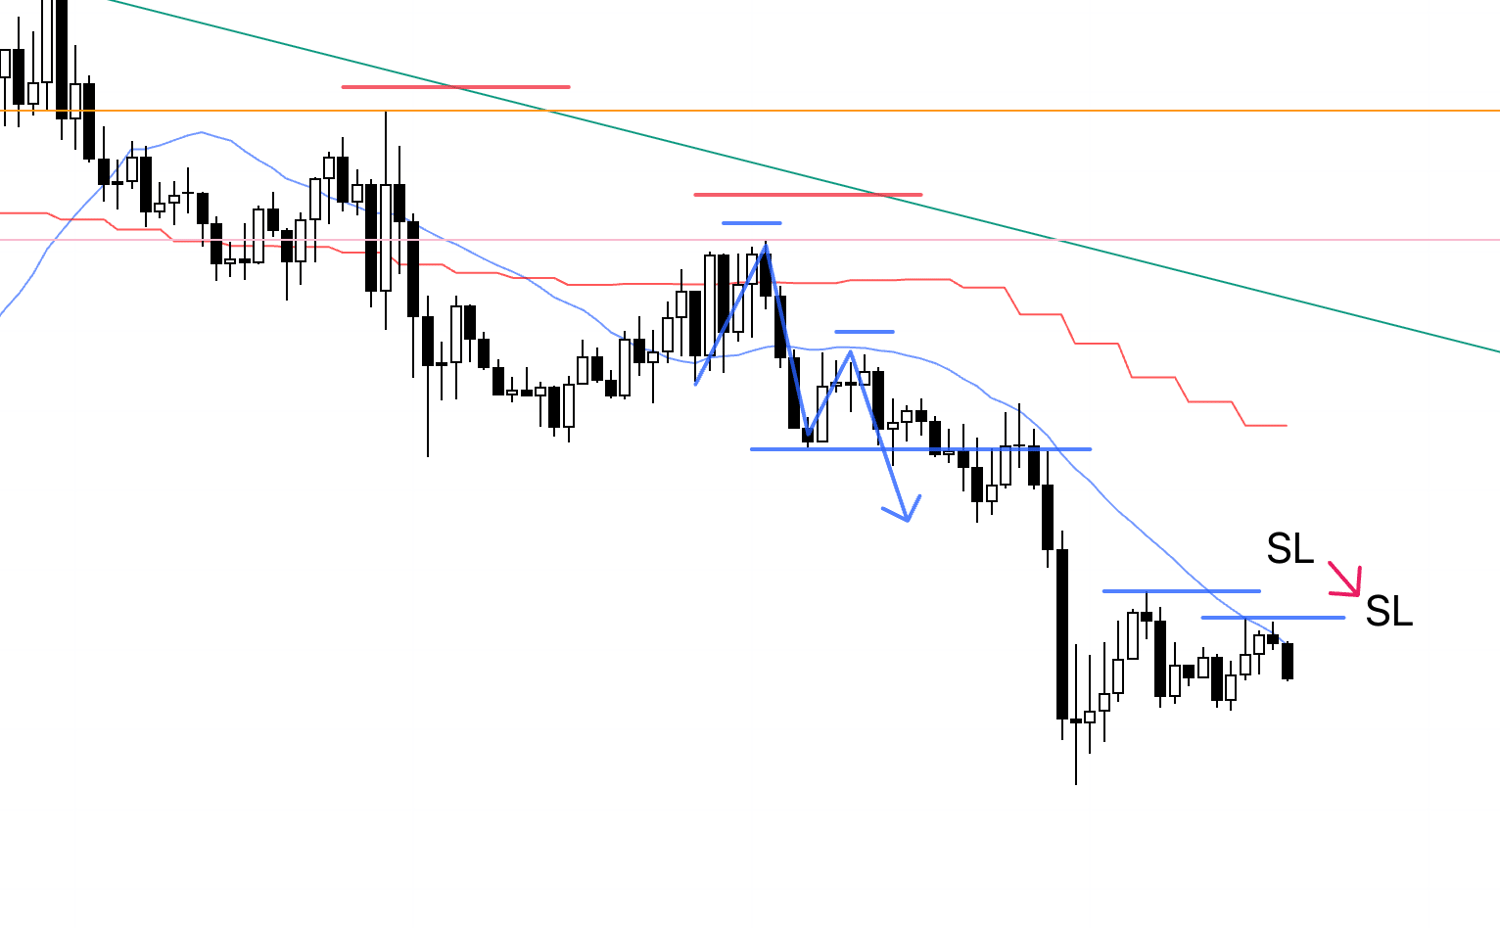
This is the 4h chart from Sunday’s scenario post.
I had built a short scenario at the point where, after the 4h downtrend was broken once, price would start a fresh downtrend again.
If it forms a lower-high pivot while also being capped by the green trendline, the edge for shorts increases.
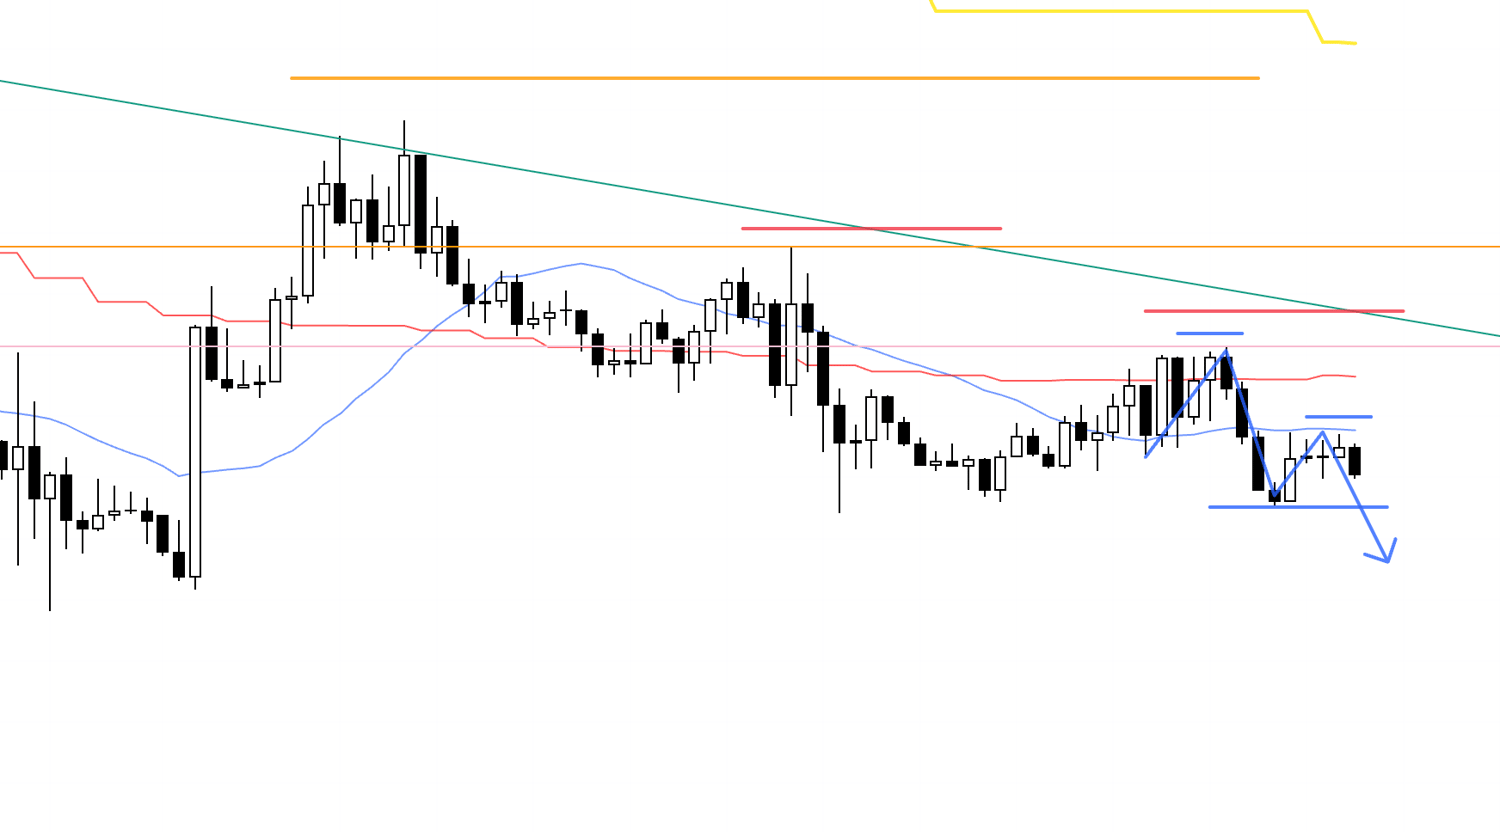
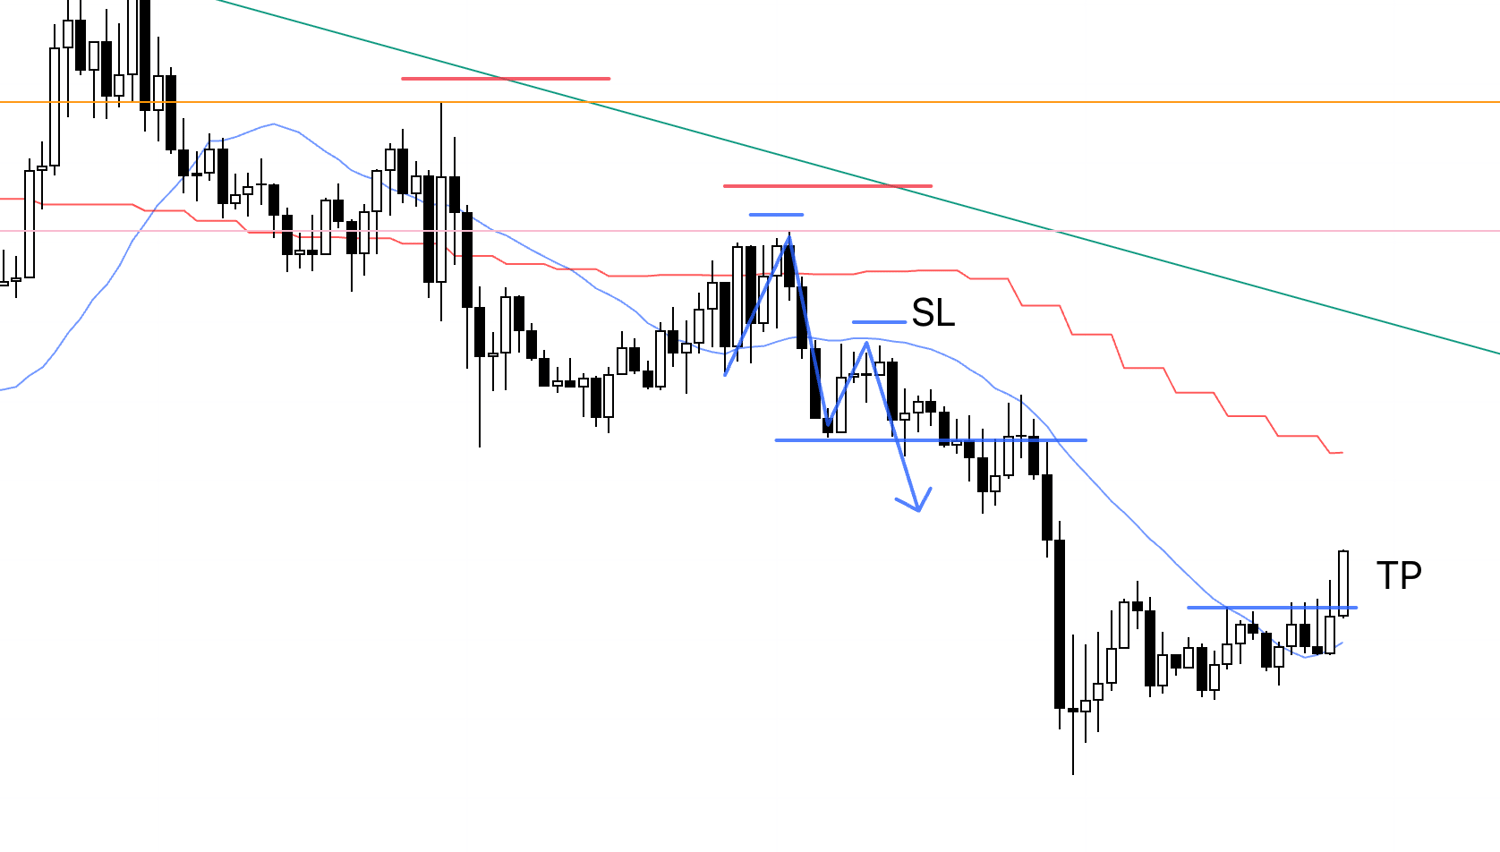
4h
This is the current live 4h chart.
I wanted to enter on the previous lower-high pivot, but that point overlapped a scheduled news event, so I couldn’t trade it.
However, this lower-high pivot is also being capped by the prior swing low (pink line), and if the lower timeframes reverse here, the edge for shorts increases.
1h
On the 1h, the point where a fresh downtrend begins (the switch from higher lows with higher-high breaks to lower highs with lower-low breaks) is the break of the most recent swing low (blue line), so the entry comes from here.
1h
My stop order was triggered and I’m in.
I’ll hold this until the 1h trend breaks.
1h
I lowered my SL slightly.
1h
I lowered my SL.
1h
After waking up, I lowered my SL.
1h
I lowered my SL a little more.
1h
Price hit the trailing stop I had been stepping down, and this trade ends here.
That’s all.
This week as well, I didn’t do anything special.
As always, I built my scenarios in advance and simply executed them as written.
For me, most of the work is already done at the scenario-building stage.
I already know what needs to happen for a buy edge to appear, and what needs to happen for a sell edge to appear, so it’s simply "If that happens, I buy".
This isn’t a prophecy, and it isn’t a prediction.
I just do it if it happens, and I don’t if it doesn’t.
Even after I’m in a position, I’ve already decided in advance what has to happen for me to close it.
I’ve thoroughly tested whether repeating that entire flow creates a structure where profits tend to accumulate, so there’s nothing left for me to think about trade by trade.
What matters is reproducibility.
How far you’ve been able to define your trading in advance, and whether you’ve actually tested it and repeated the practice, is everything.
I wrote a post on X about system building, including the six conditions I require for my system, so if you’re interested, please give it a read.
Only once you can define your trading can you truly test it, and it’s precisely that definition that creates reproducibility.
If you feel that "testing and live trading end up being completely different things", it may be worth taking another look at your strategy definition and checking whether anything is still vague.
In many cases, these issues get reframed as an emotions problem, but if you have clear definitions and you’ve practiced them repeatedly, reproducibility will improve.
And, as expected, it’s extremely important to hold positions at places where price can really run.
For that, whether it’s a point that "draws in orders from higher timeframes" is crucial.
That’s why I use multi-timeframe analysis, deliberately targeting areas where traders operating across different horizons are likely to place orders in the same direction at the same level, and I only trade where an order cascade can occur.
By doing so, it becomes harder to lose, and risk-reward also tends to improve.
With this kind of higher-timeframe context in place, truly high-edge points are not all that common.
What’s critical is whether you can properly wait for those points, and whether you can keep repeating trades only at those points.
Thanks for reading to the end.
I hope my blog can offer a useful hint to those who are about to build a strategy, and to those who are struggling to achieve consistency.