


Hello.
I’ll lay out my trading scenarios for the coming week.
I publish this “Trade Scenarios” blog every Sunday.
And every Saturday I post a “Weekly Trade Report” where I explain how I actually thought about the market and executed my trades during the week.
By reading this trading-scenario blog together with the Weekly Trade Report, I think you’ll be able to use my process as a practical reference for how to think ahead of time, what to wait for, and how to execute in a consistent way.
For the underlying strategy, please refer to my blog posts on Dow Theory and multi-timeframe analysis.
A “scenario” is not a forecast.
It is not a prediction, but my personal plan that says, “If the market does this, I will do that.”
I don’t try to predict the market, and this is not intended as such, so please keep that in mind.
Nor is this a set of instructions telling you what to buy or sell, or a service providing trading signals.
It does not guarantee any future profits; it is provided purely for educational purposes, using my own consistent process as the example.
I cannot take responsibility for any outcomes of the trades you place, so please trade at your own risk.
With that, let’s start with USDJPY.
(On my charts, the colors of the lines I draw represent each timeframe: orange for the daily, red for 4h, blue for 1h, and green for 15m.)
USDJPY
Daily
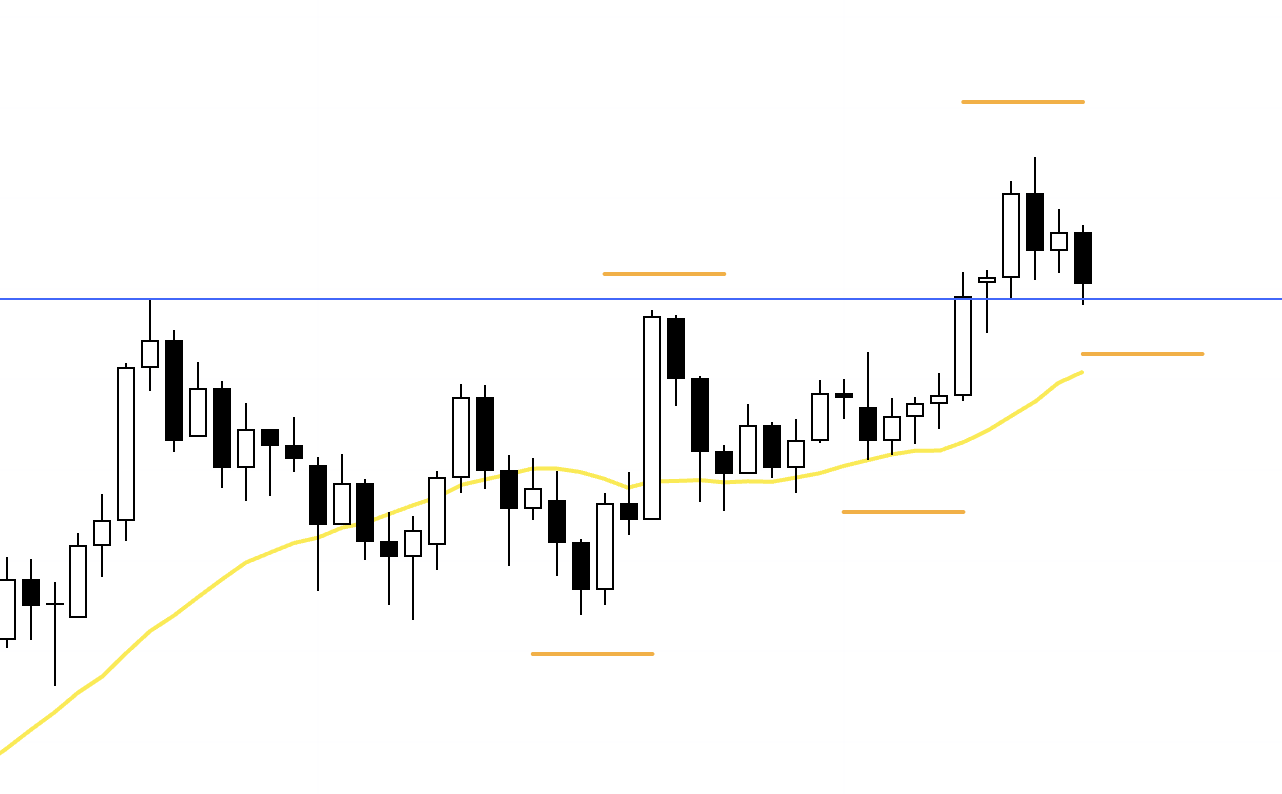
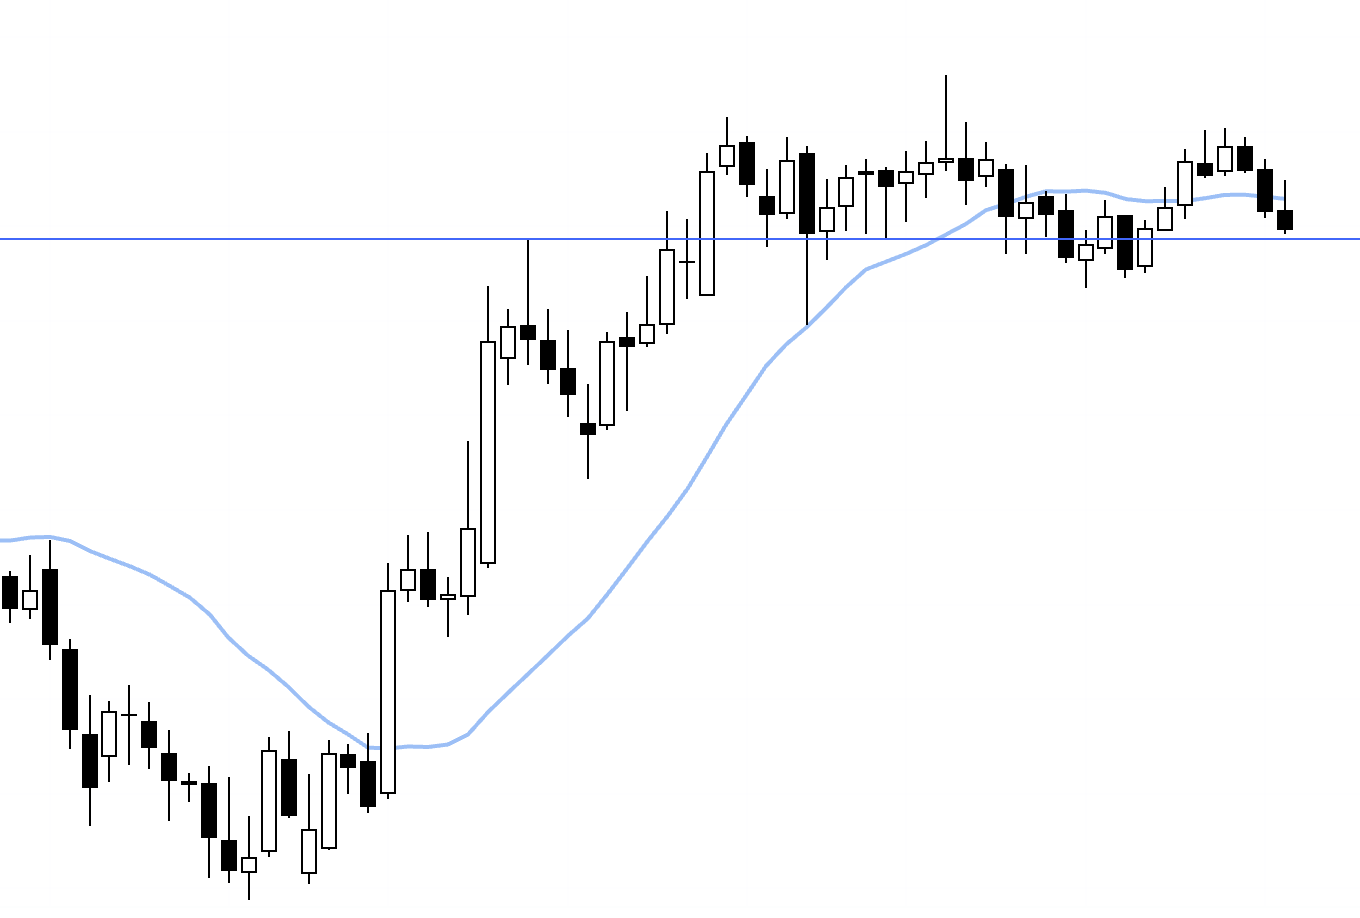
On the daily, price is repeatedly printing higher lows and breaking higher highs, so it’s in an uptrend.
It’s currently stalling at the prior high line (blue), and I’m watching whether buyers step in here as a buy-the-dip.
Now let’s look at the 4h.
4h
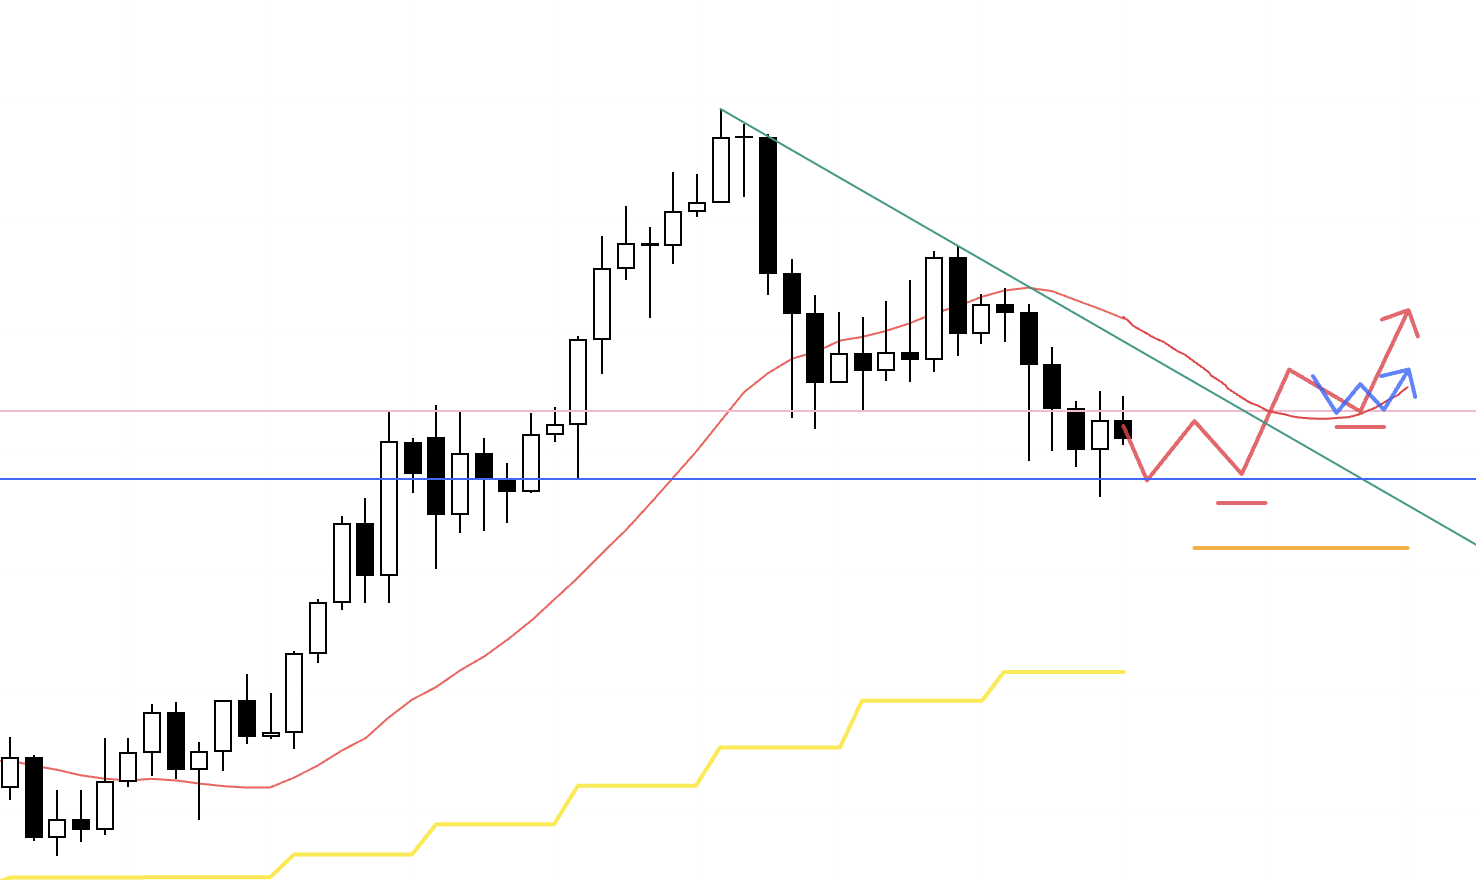
Right now we’re at a daily buy-the-dip area, but on the 4h the moving average (red) is acting like overhead resistance, and price is also being capped by the green trendline.
So I’m not looking to buy immediately from here.
At the pink horizontal line just above, there’s an ongoing tug-of-war between buyers and sellers.
If price breaks above that line, then forms a higher-low pivot while being supported by that line from below—and also shows support from the moving average, etc.—then I’ll consider longs.
4h
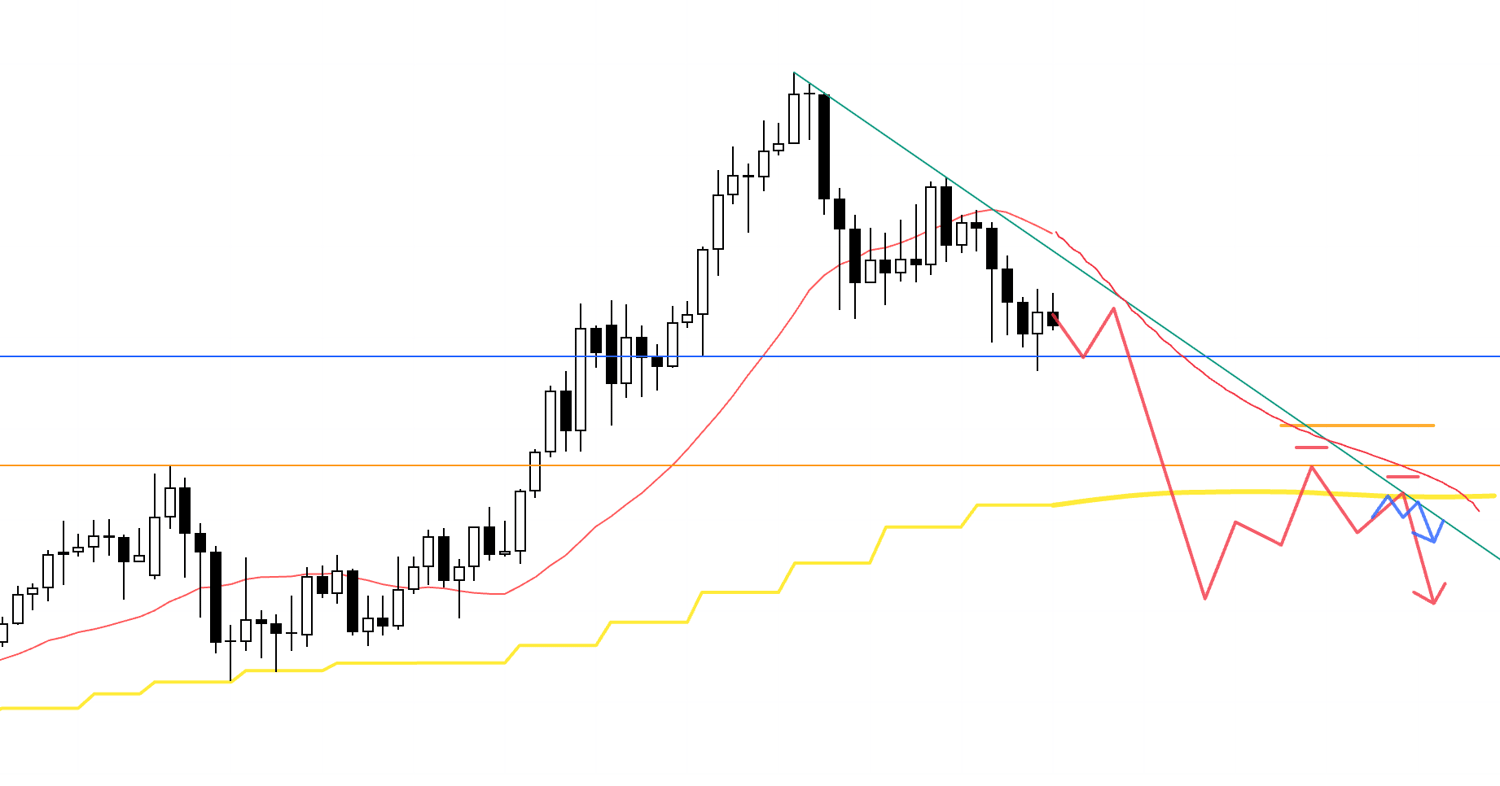
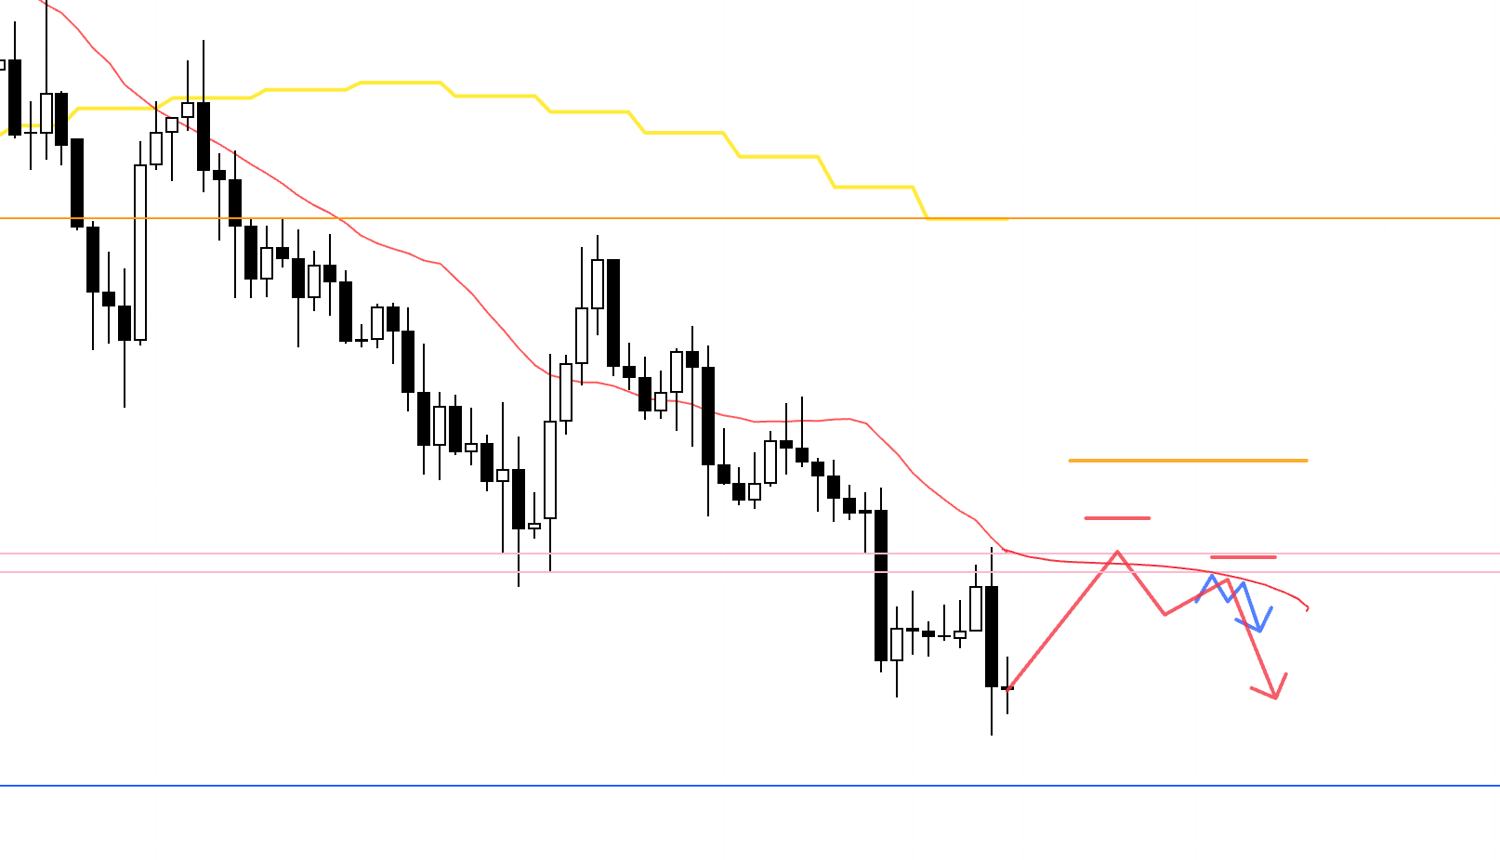
At the moment, because it would be going against the daily uptrend, I’m not looking to short immediately.
However, if—for example—price forms a daily lower-high pivot like this, and also shows rejection from the daily moving average (yellow), then I’ll follow the drop on the lower timeframes as an initial leg of a potential daily downtrend.
Next, let’s look at EURUSD.
EURUSD
Daily
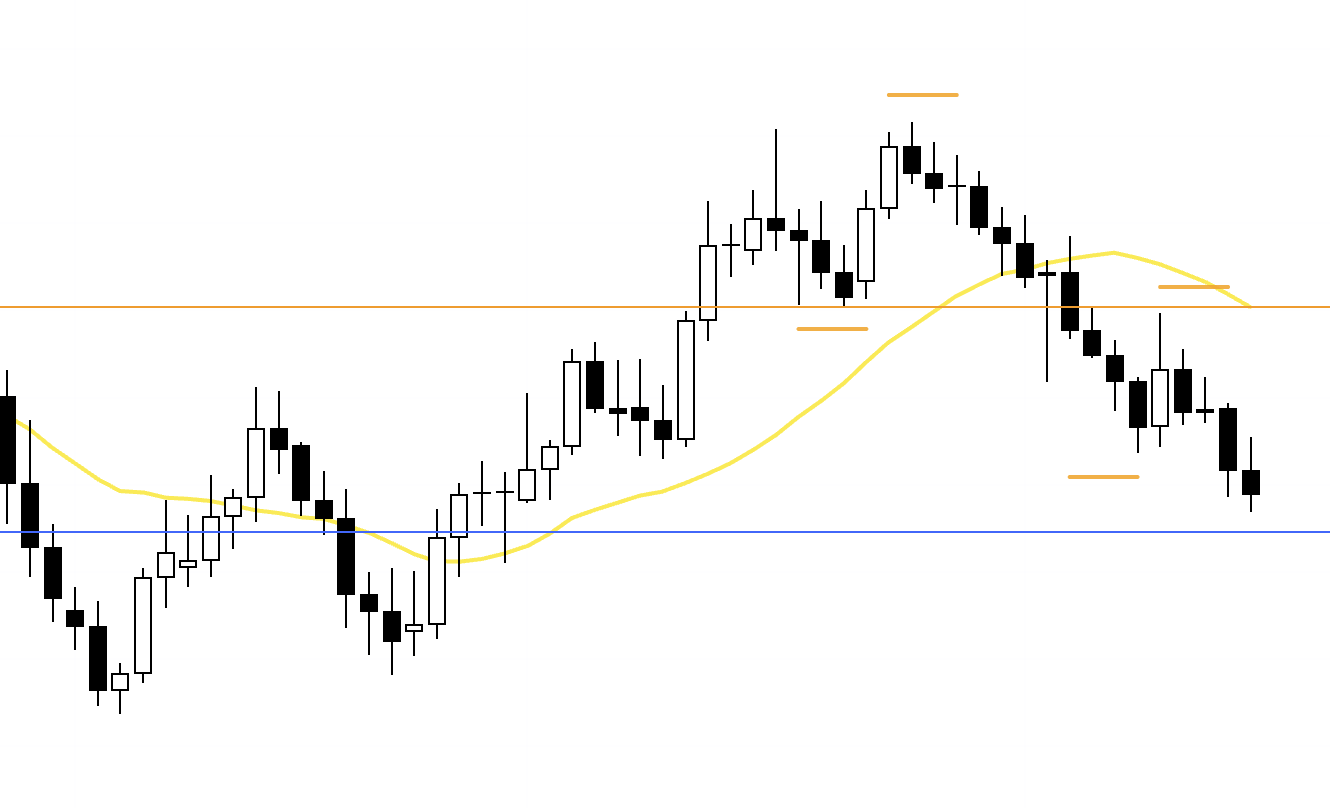
On the daily, we’ve printed a lower high and broken to a new low, so it’s in a downtrend.
Since price has already fallen, I’m not considering an immediate short from here, because it would carry the risk of selling into the lows.
And just below, there’s an important support line (blue) we need to be aware of.
To make it easier to see where this line is drawn from, let’s check the weekly.
Weekly
On the weekly, this blue line is clearly anchored by prior highs and lows.
Because it’s obvious and easy to read, there’s a chance traders continue to pay attention to it going forward.
In other words, the clearer the line is, the more likely it becomes a target for profit-taking orders when price reaches it—which also means there’s a risk of order concentration.
And on the weekly, it’s also the lower boundary of the range, and it can even look like a buy-the-dip area within an uptrend.
That makes this blue line even more important to watch.
With that in mind, let’s look at the 4h.
4h
Shorting immediately from here would be high risk.
But if price first retraces up toward the pink line and then forms a lower-high pivot as a daily pullback-sell setup, I’ll look for shorts on the lower timeframes.
However, because we need to respect the blue line below, I’ll judge at entry whether the risk-reward still makes sense.
4h
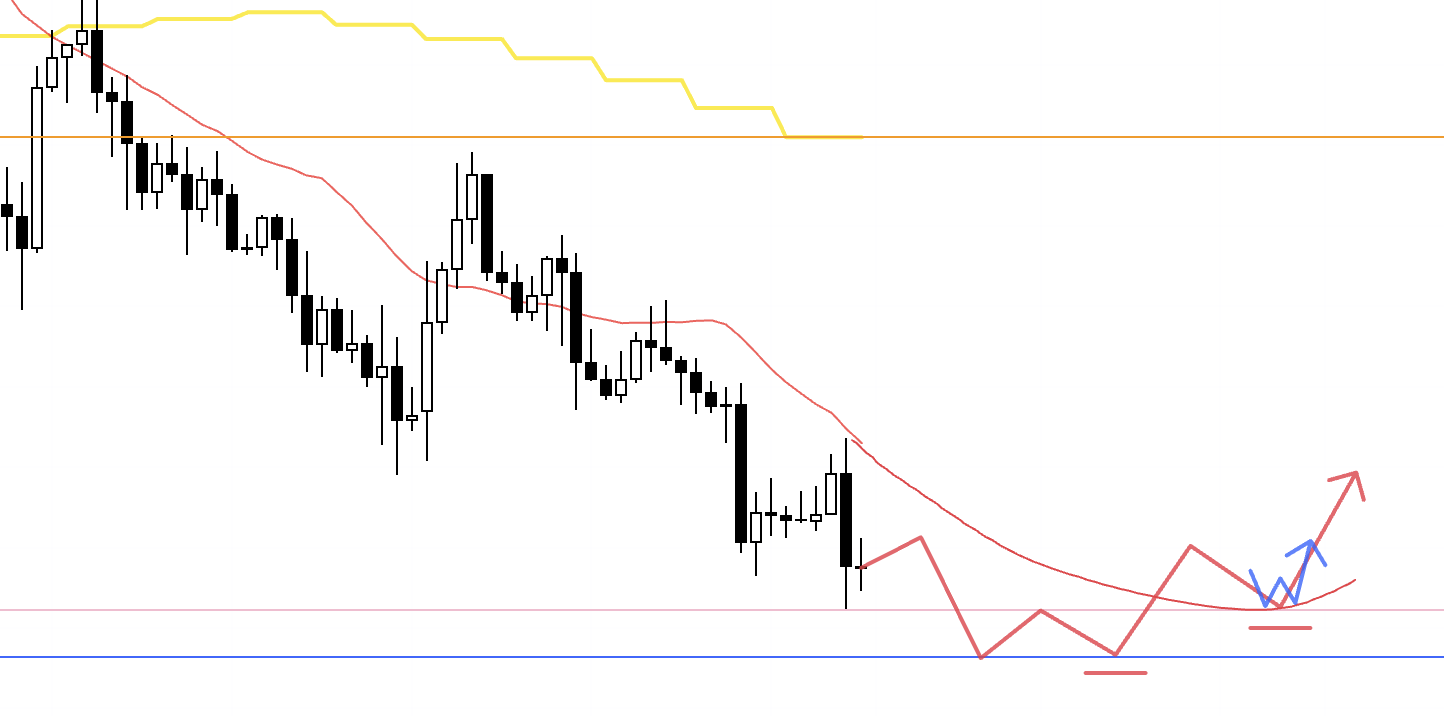
If the week opens and price keeps dropping, then shows a bounce supported by the blue line, I’ll consider longs by following the rally that closes the gap to the daily moving average (yellow).
In that case, it needs to be the first point where the 4h flips into an uptrend, and ideally price should also be supported by the moving average (red).
4h
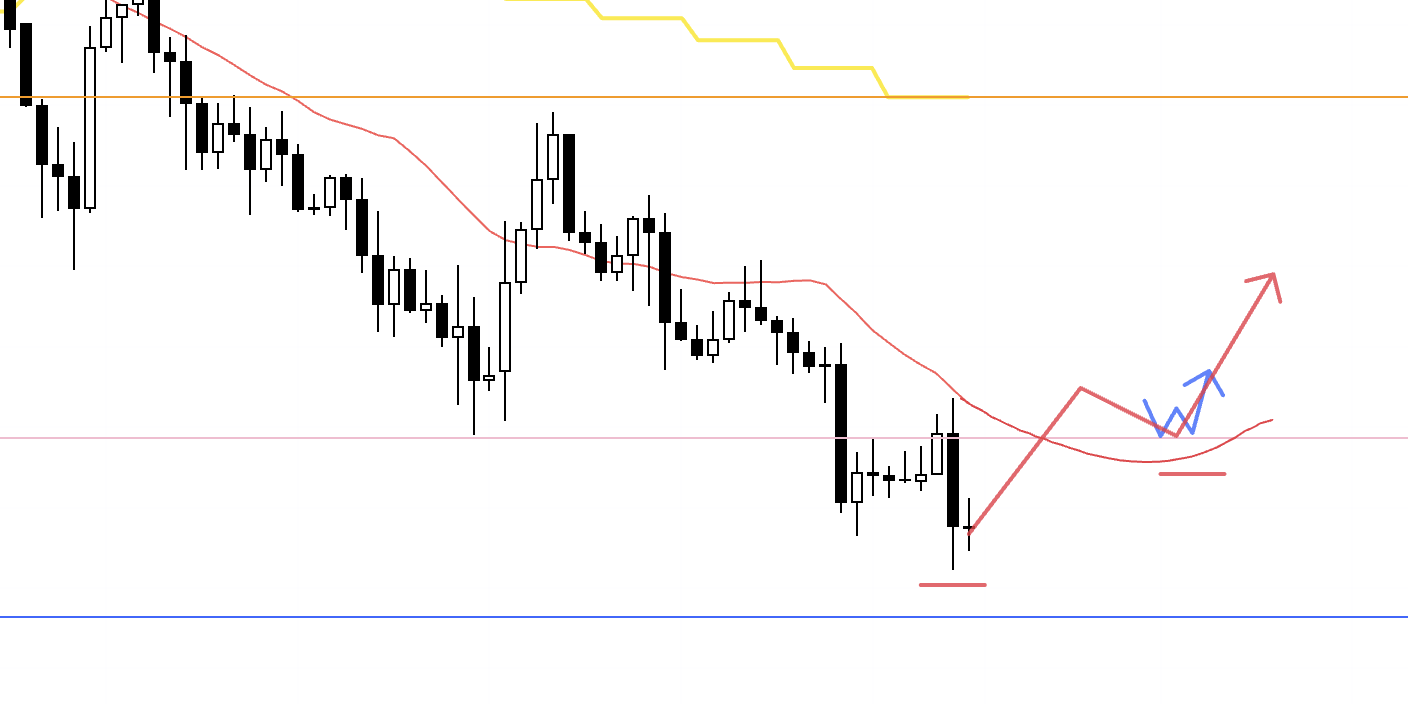
A structure like this is also possible, and there are various scenarios.
But for how the 4h actually flips trend, I want to judge it while watching the live chart.
That’s it.
These are the scenarios as of now, and as the week begins, I plan to update and rebuild them as needed while watching how price actually moves.
These trade scenarios are purely my own plan.
So if you’re still figuring out your trading approach, I hope you can use this as a reference for building your own strategy.
But if you already have your own trading rules fully established, don’t get distracted by my plan—stick to your rules thoroughly.
Thanks for reading to the end.