


Hello.
I’ll lay out my trading scenarios for the coming week.
I publish this “Trade Scenarios” blog every Sunday.
And every Saturday I post a “Weekly Trade Report” where I explain how I actually thought about the market and executed my trades during the week.
By reading this trading-scenario blog together with the Weekly Trade Report, I think you’ll be able to use my process as a practical reference for how to think ahead of time, what to wait for, and how to execute in a consistent way.
For the underlying strategy, please refer to my blog posts on Dow Theory and multi-timeframe analysis.
A “scenario” is not a forecast.
It is not a prediction, but my personal plan that says, “If the market does this, I will do that.”
I don’t try to predict the market, and this is not intended as such, so please keep that in mind.
Nor is this a set of instructions telling you what to buy or sell, or a service providing trading signals.
It does not guarantee any future profits; it is provided purely for educational purposes, using my own consistent process as the example.
I cannot take responsibility for any outcomes of the trades you place, so please trade at your own risk.
With that, let’s start with USDJPY.
(On my charts, the colors of the lines I draw represent each timeframe: orange for the daily, red for 4h, blue for 1h, and green for 15m.)
USDJPY
Daily
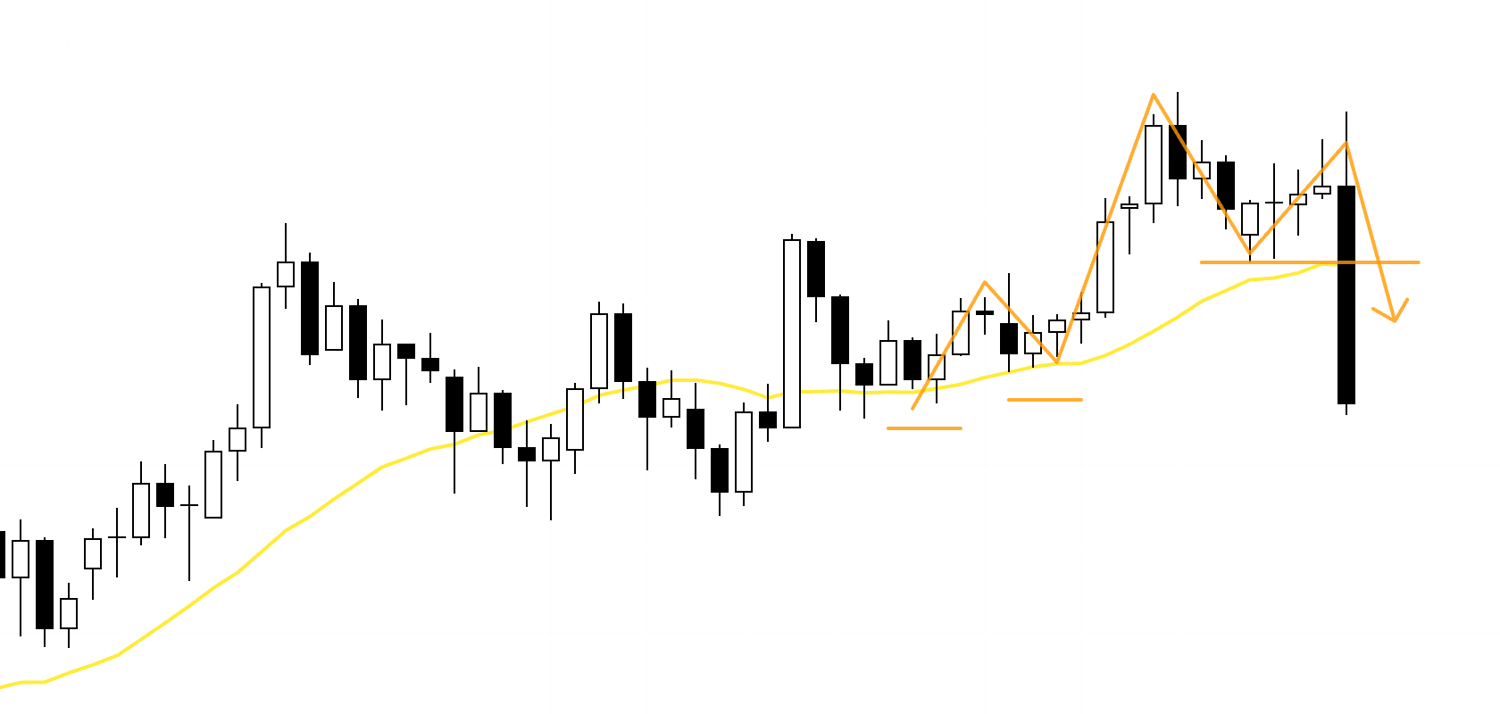
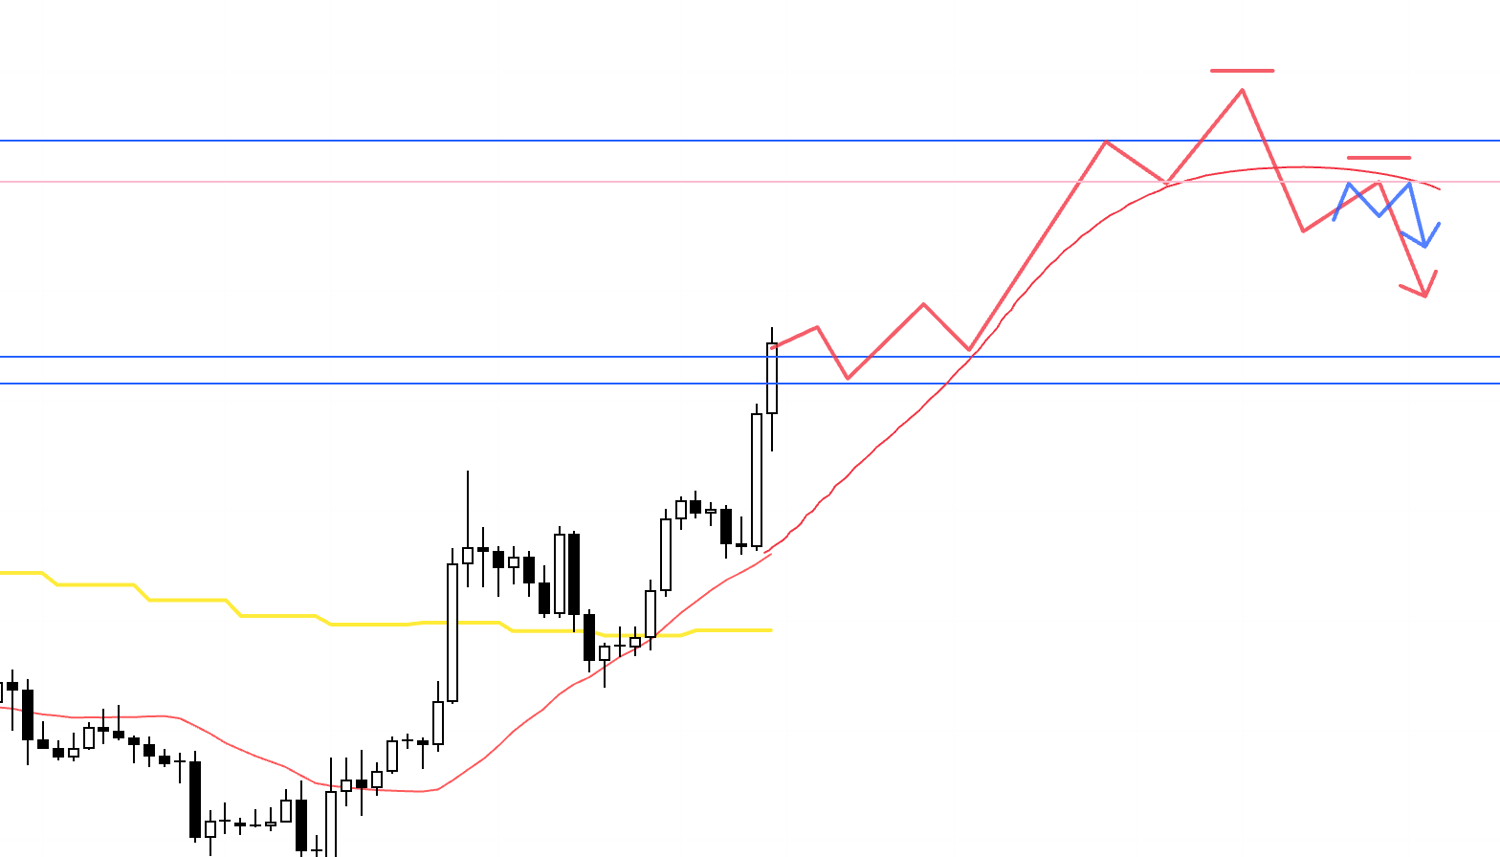
On the daily chart, price had been in an uptrend, printing higher lows and taking out prior highs.
However, breaking the most recent swing low has now invalidated that uptrend structure.
So the basic idea is to be selling into rallies.
At the same time, this leg down also functions as the pullback on the weekly timeframe, so we need to factor in the risk of weekly dip buyers stepping in.
Weekly
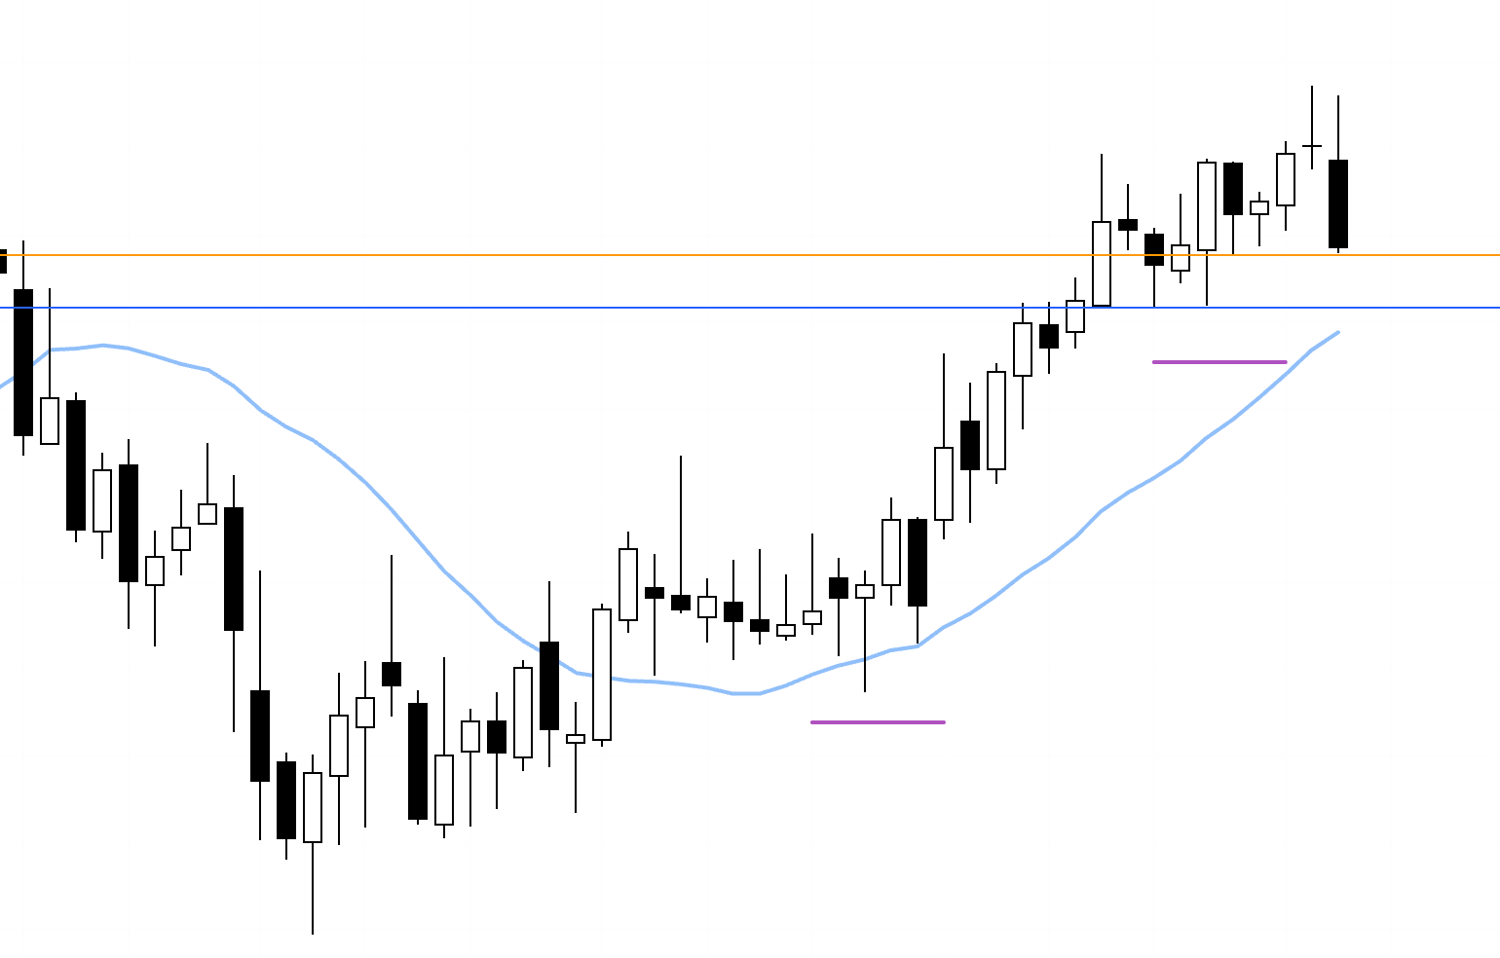
This is the weekly chart, where price is making higher lows and setting new highs, so we are clearly in an uptrend.
The current decline on the daily is the weekly pullback, and areas such as the orange and blue lines drawn on this chart are zones where buying interest is likely to emerge, so we need to build our plan with those levels in mind.
With that in mind, let’s drop down to the 4h chart.
4h
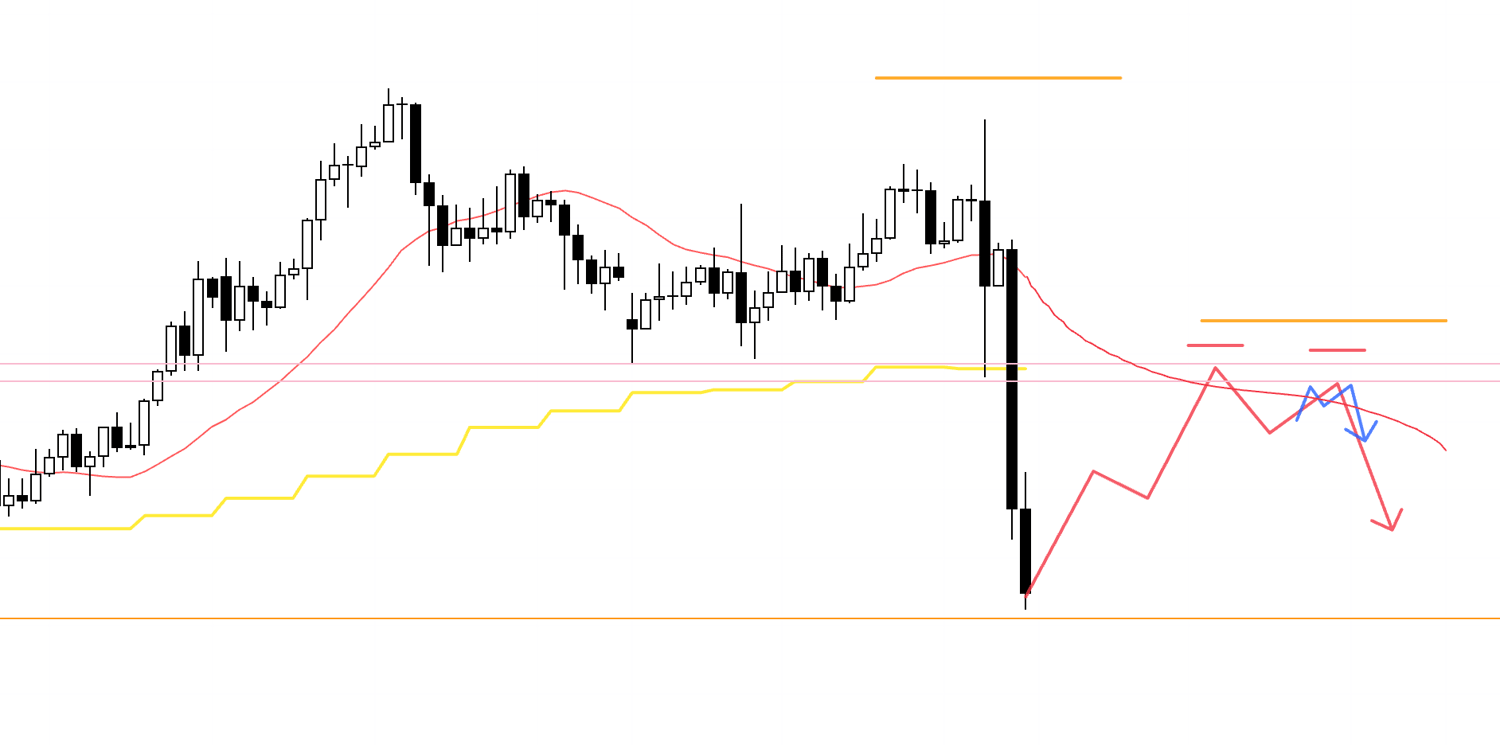
Right now price is sitting close to a key level, so jumping in short from here carries elevated risk.
Instead, I would like to first see a clear swing high form that is also visible on the daily chart, and then look for a lower high on the 4h that kicks off a fresh 4h downtrend.
Within that 4h lower‑high area, I will look for short setups on the lower timeframes such as the 1h.
4h
Alternatively, if price is cleanly capped by the orange line and forms something like a double top on the 4h, I will again look for shorts on the lower timeframes.
In that case, I will be gauging the distance down to the lower blue line and only take entries where the risk‑reward profile makes sense.
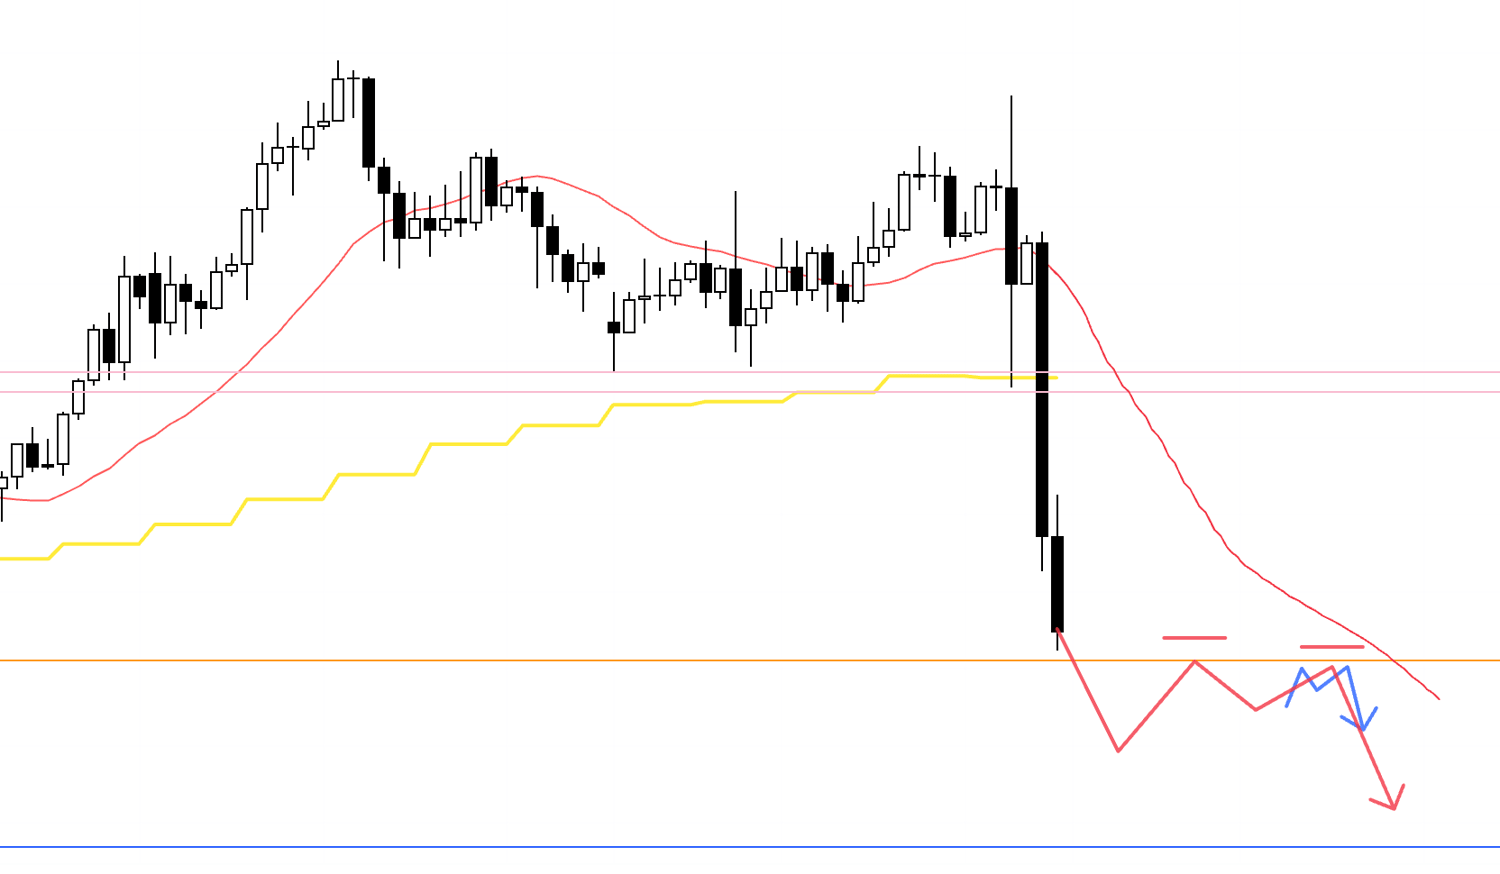
4h
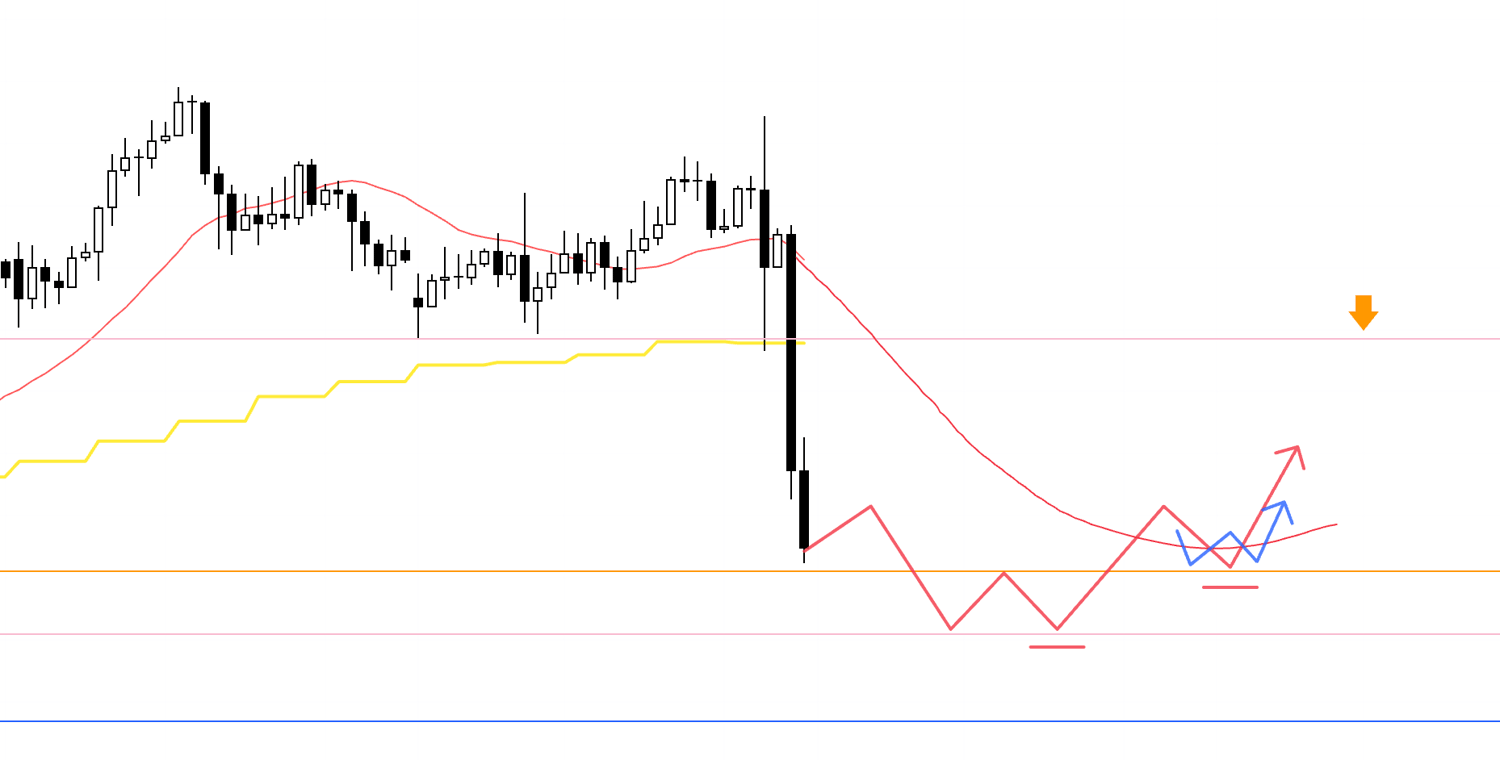
If we get an upswing like this that is forming the daily swing high, I will be open to taking longs on the lower timeframes.
When I do, I want to see price clearly supported by some line and ideally breaking above the 4h moving average (red), and I will make my decisions with those conditions in mind.
In this scenario, it is important to keep in mind that this rally is simply the move forming the daily swing high.
The higher price pushes, the more selling pressure is likely to build, so I will be selective and only take entries where the risk‑reward is attractive, and if I do get in, I will look to secure partial profits as price approaches nearby key levels.
Now let’s take a look at EURUSD.
EURUSD
Daily
On the daily chart, price has slightly taken out the previous high and, with higher lows in place, has shifted into an uptrend.
The next upside target is the upper blue line drawn from the previous high, so I will be watching to see whether there are opportunities to buy the dip within that remaining space.
4h
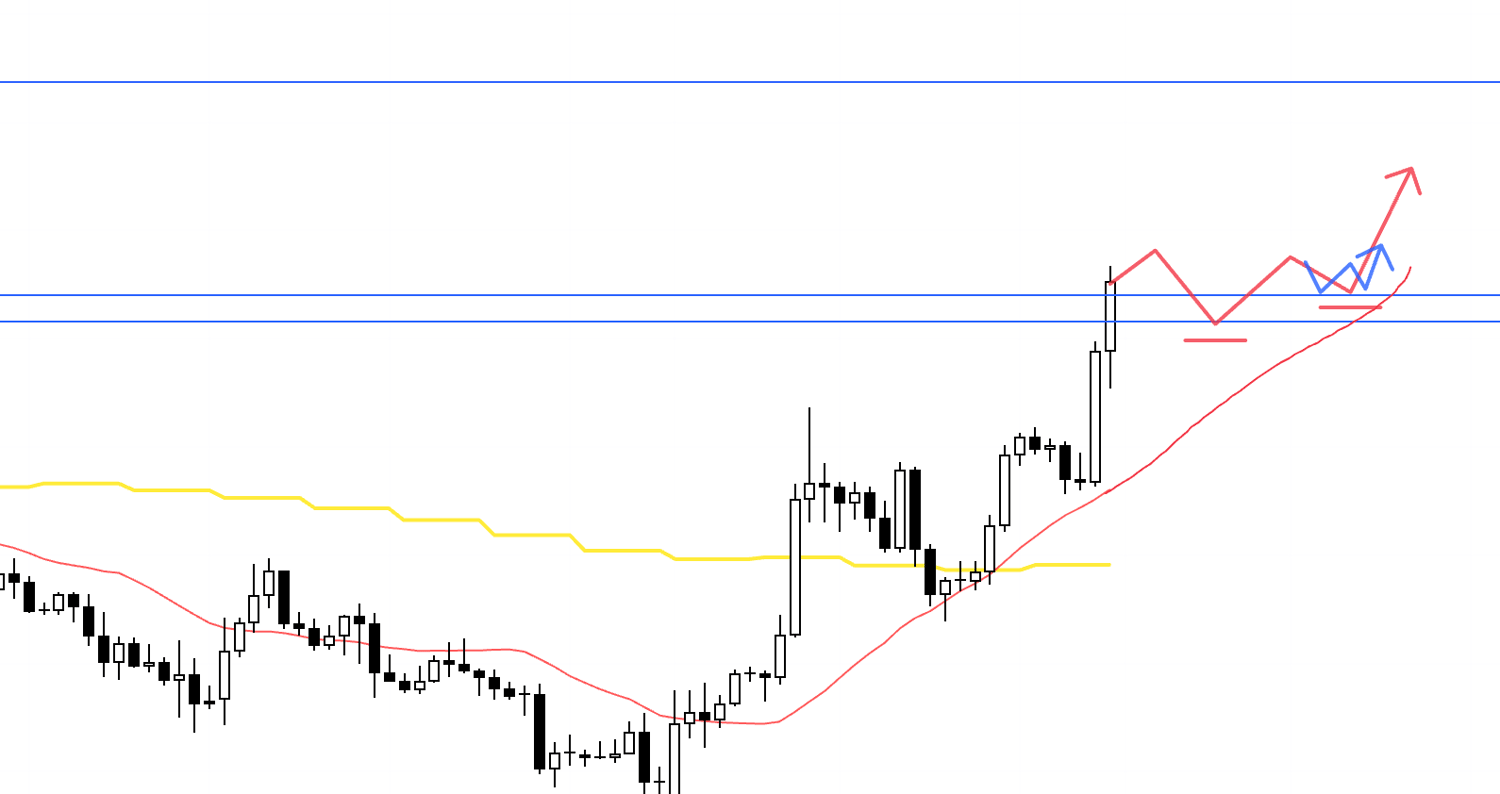
If the 4h lows start to rise while being supported by the blue line drawn from the previous high that you can also see on the daily, I will be looking for long setups on the lower timeframes.
4h
After a push higher, if price is capped by the upper blue line and then flips into a downtrend on the 4h, I will consider shorting, effectively riding the daily pullback lower.
In that case the trade would be counter to the daily trend, so again I will only take it if the risk‑reward is compelling, and if I am in, I will look to lock in partial profits once price reaches nearby key levels.
That’s it for now.
Because there are several nearby levels on EURUSD that are likely to be watched, I plan to build scenarios flexibly as the week kicks off, reacting to how price actually moves.
In my multi‑timeframe analysis, what I care about most are the points where orders from traders operating on different time horizons converge, creating an inevitable imbalance in one direction.
Conversely, in the “empty” zones where there are no clearly defined highs or lows that the market is focused on, there tends to be far less resting liquidity acting as resistance, so price can travel more easily in one direction.
So ideally, the points where I take entries are places that attract order flow from the higher timeframes and, once price starts moving in that direction, have relatively little opposing flow.
When you are long and there is an obvious high or low sitting just above, that level becomes a natural take‑profit target and a magnet for fresh countertrend selling, meaning sell orders cluster there and your edge on the upside is reduced.
With that in mind, I try to trade the moves that fill the space between key levels.
Setting the SL at a point that is protected by a key level helps improve both win rate and risk‑reward.
Combined with multi‑timeframe analysis that draws in order flow from the higher timeframes, this approach allows me to keep taking trades that are logically consistent.
I hope some of this is useful to you.
These are only the scenarios as they stand right now, and once the week actually gets underway I will be updating and rebuilding them in real time based on how price behaves.
These trade scenarios are nothing more than my own plan.
If you are still in the process of defining your style, feel free to use them as one reference when building your own strategy, but if your trading is already well‑established, please stick to your own rules and do not let my plan knock you off course.
Thanks for reading all the way to the end.