

In this report I will review the key points of my trading this week, focusing on the actual trades I took.
This Weekly Trade Report is published every Saturday.
When you read it together with Trade Scenarios, which I post every Sunday, I believe it will give you a useful reference for how I think in advance and how I actually execute trades based on those scenarios.
This is not advice saying “you should trade like this,” nor am I claiming that this is the correct answer.
It is not about showcasing individual winning or losing trades, nor is it about recommending a specific strategy based on those results.
My purpose is to show, at a practical level, how I repeatedly follow a consistent process based on pre-defined scenarios, and to offer that as a reference for your own strategy building and for achieving consistency in your process.
The outcomes I show are nothing more than my personal results, and they do not guarantee your future profits.
Please keep that firmly in mind, and when it comes to your own trading, make sure you carry out your own testing and preparation, and trade entirely under your own responsibility.
My trading is based on buying pullbacks and selling rallies on the 4h timeframe.
If you are interested in my pullback and rally strategy, please read my past blog posts on Dow Theory and multi-timeframe analysis.
Now, please take a look at the following charts.
USDJPY 4h
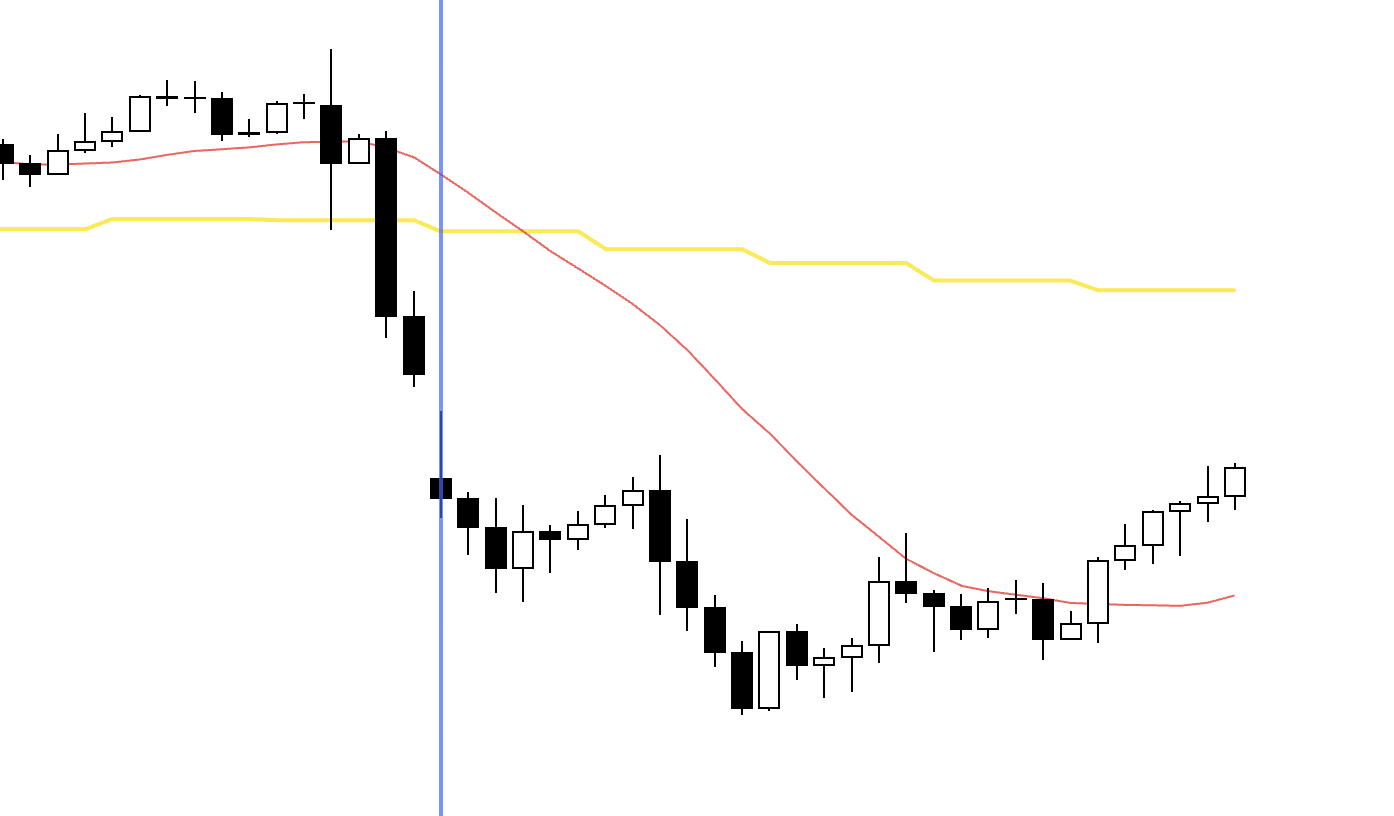
This is the USDJPY 4h chart.
Price action for this week is the portion to the right of the blue vertical line on the chart.
USDJPY never developed into a chart I could trade, so I did not take a single trade in it this week.
4h
In the latter half of the week, I was waiting for a higher‑low structure like this to form, but price just kept rising without giving that setup, so there was no trade for me.
Next, please take a look at the EURUSD chart below.
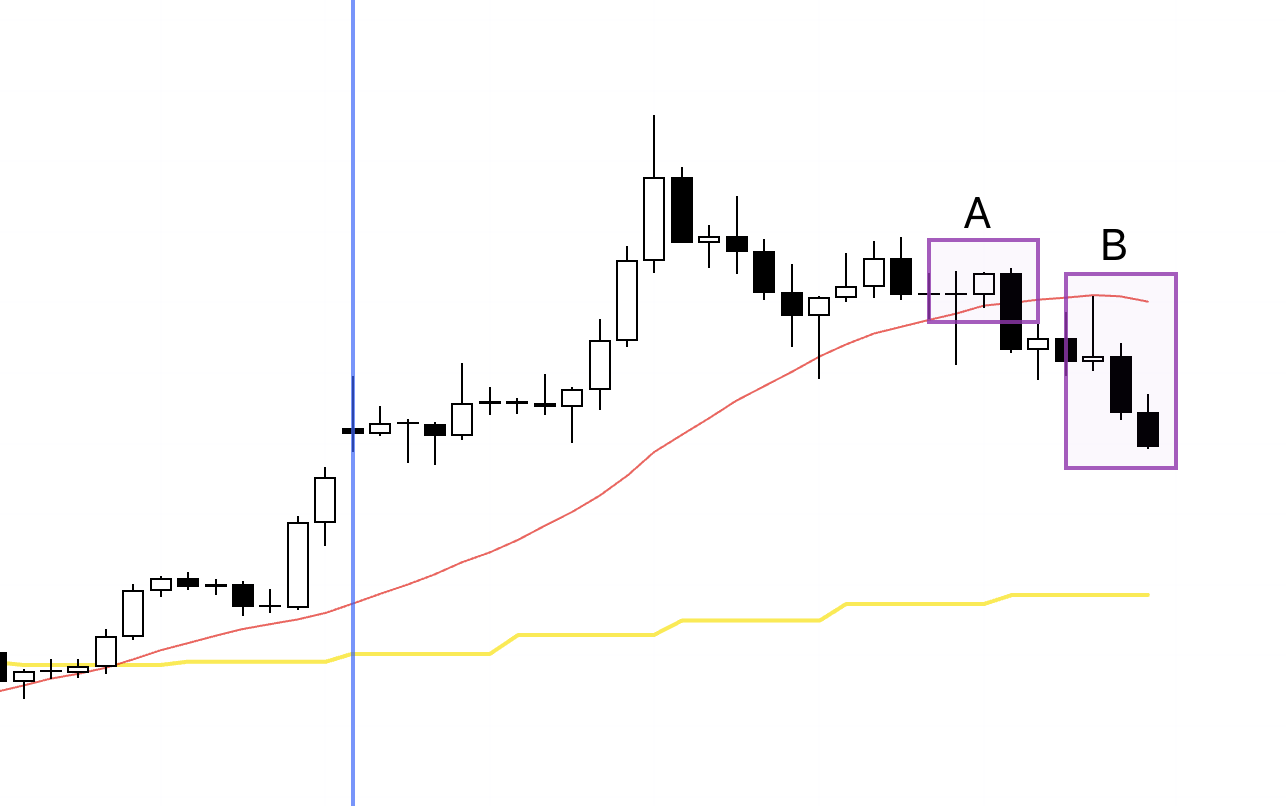
EURUSD 4h

This is the EURUSD 4h chart.
I also did not take any trades in EURUSD this week.
However, the two areas highlighted by the rectangles are spots where, if conditions had aligned, my rules would have required me to take a trade, so I will walk through them.
Let’s drop down to the 1h.
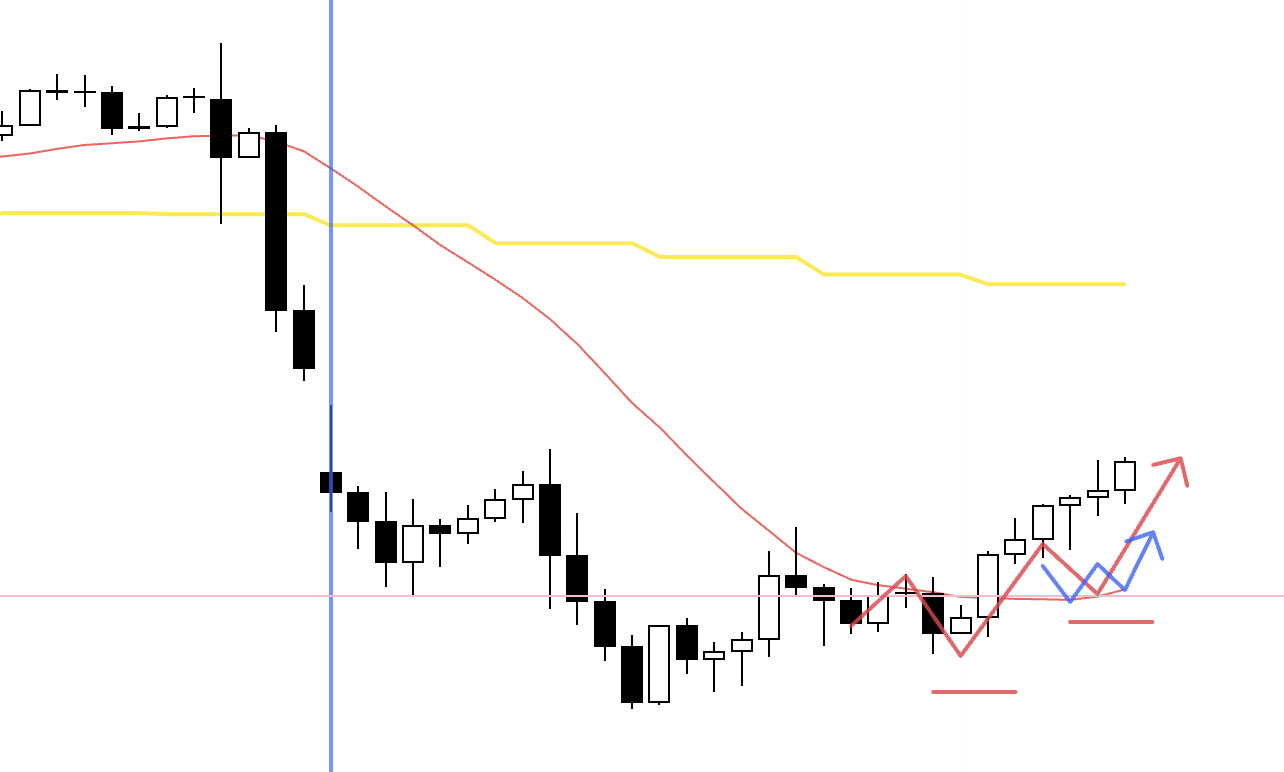
1h
This is the 1h chart for section A.
Here, as a higher‑low point on the 4h, price was cleanly supported by the previous high and other levels (the pink horizontal line), and it also became a spot where dip‑buying on the daily chart was likely to come in.
So if, as indicated by the blue arrows on the chart, the 1h had formed a higher low and then broken to a new high, it would have been a setup I needed to take.
This time, however, price broke below the low as it was and never transitioned into an uptrend on the 1h, so I stayed out.
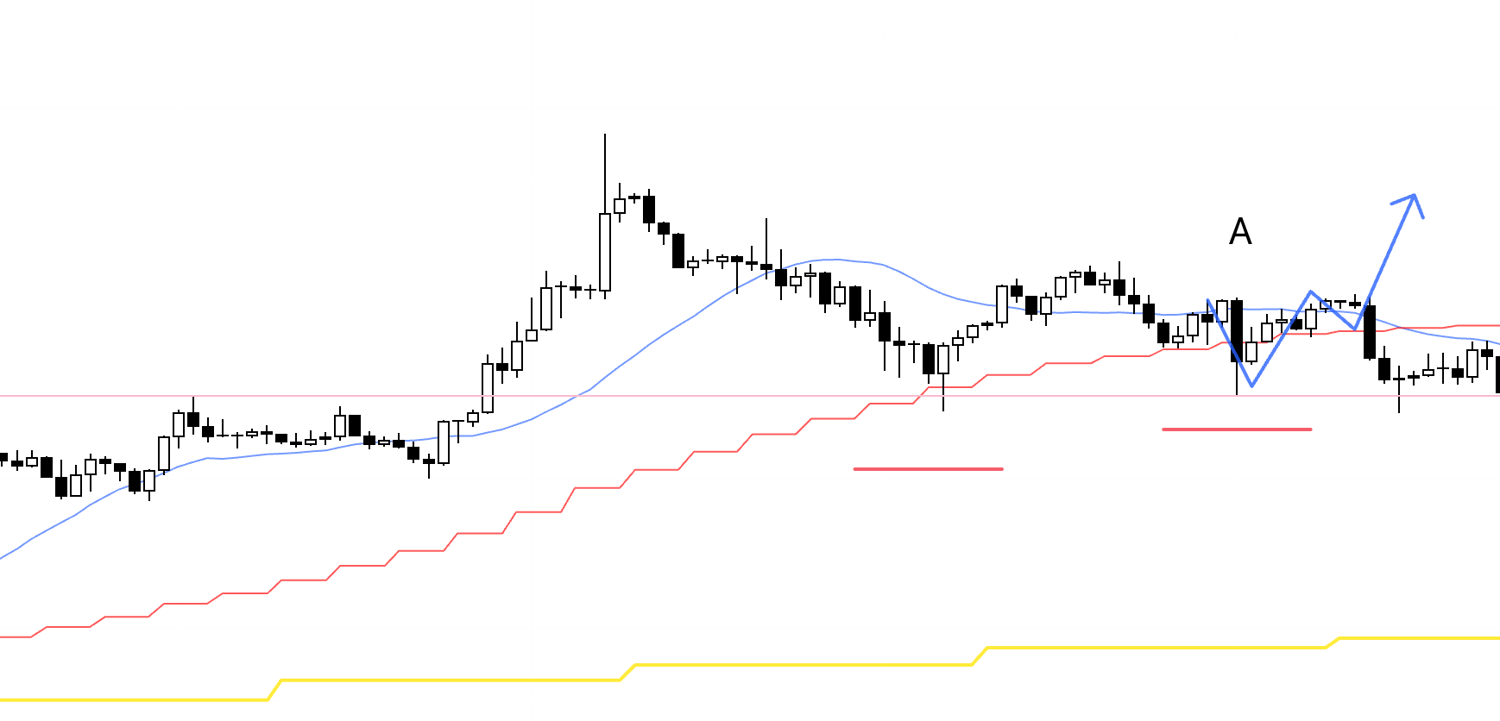
1h
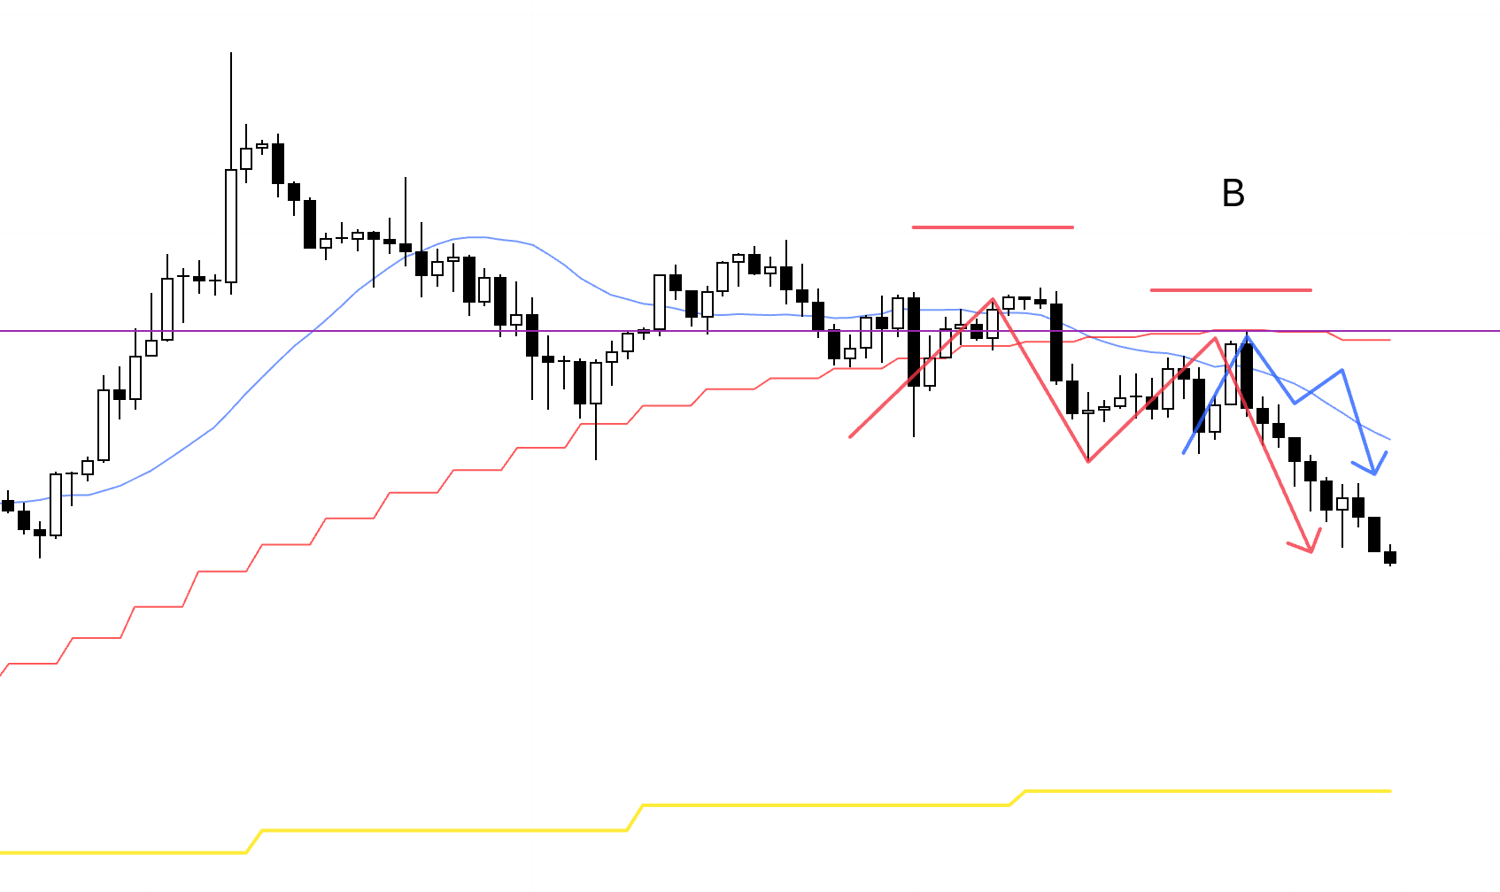
This is the 1h chart for section B.
At A, I was looking to buy the pullback within the 4h higher‑low structure, but at B, I needed to look for a short at the 4h lower‑high point.
By the time we reached the situation at B, price had already broken below the red 4h moving average and was being capped from above, so I was planning to sell on a 1h lower high followed by a break of the prior low.
But price simply fell straight from there without putting in a clear lower high, so I passed on this trade as well.
This decline is essentially a move to close the gap with the daily moving average and corresponds to the pullback leg that forms the dip on the daily chart, so if you were to trade it, you would need to factor in the risk that the deeper it falls, the stronger the buying interest becomes.
If I had taken a position here, I would likely have managed it by, for example, securing half the profit as price reached key levels.
That’s it.
This week, various news events drove volatility higher and produced big moves in the market, but for me personally there was nowhere to trade.
No matter how much the charts move, you never need to think, "If I don’t grab this move, I’m missing out," and you must not let yourself be swayed by huge P&L posts on social media or by the news flow.
What really matters is to look only at whether the market environment matches your own rules and supports taking a trade, and then to keep making the same decisions and taking the same actions over and over again.
I am not trading for the result of the one trade right in front of me.
I keep repeating the same actions because I am convinced that when I repeat them over time, I will be rewarded.
This is how you behave in a market driven by short‑term randomness, and this is the consistency a trader needs in order to extract profit from that randomness.
If your rules tell you that you cannot trade, then no matter how far the charts move, that move is not your trade.
There is no need to feel frustrated about it, and if you do feel frustrated, that is a very dangerous sign.
And even if, hypothetically, you lose while following your rules, that is nothing more than a single, rule‑based loss.
You must not treat it as something special by saying things like, "If only that news hadn’t come out."
Unless you yourself fully understand the nature of probability and completely acquire the mindset and behavior needed to use probability, it will be very hard for you to actually harness it.
The market is always one of a kind.
But you should remain consistent today and tomorrow.
That is what truly matters.
Thank you for reading to the end.
I hope this blog can be a source of ideas for those who are about to build their strategy, and for those who are struggling because they still haven’t been able to achieve consistency.