


Hello.
I am laying out trading scenarios for the week ahead.
This “Trade Scenarios” blog is posted every Sunday.
Every Saturday I also publish a “Weekly Trade Report” that walks through how I thought and executed my trades over the preceding week.
Read together, these two pieces show a consistent, practitioner‑level process for how I think in advance, what I wait for, and how I execute when conditions are met.
For my framework, please refer to my posts on Dow Theory and multi‑timeframe analysis.
A scenario is not a prediction.
It is not about guessing direction, but a personal conditional plan: “if this happens, I will do that.”
I do not forecast the market, and this is not a forecast, so please keep that in mind.
Nor is this an instruction to buy or sell or a signal service.
It does not guarantee future profits.
It is offered for educational purposes to illustrate how I implement a consistent process.
I cannot take responsibility for the outcome of any trades you undertake, so trade at your own risk.
Let’s begin with USDJPY.
(On my charts, line colors denote timeframes as follows: orange for the daily, red for 4h, blue for 1h, and green for 15m.)
〜・〜・〜・〜・〜・〜・〜・〜・〜・〜・〜・〜・〜・〜・
USDJPY
Weekly
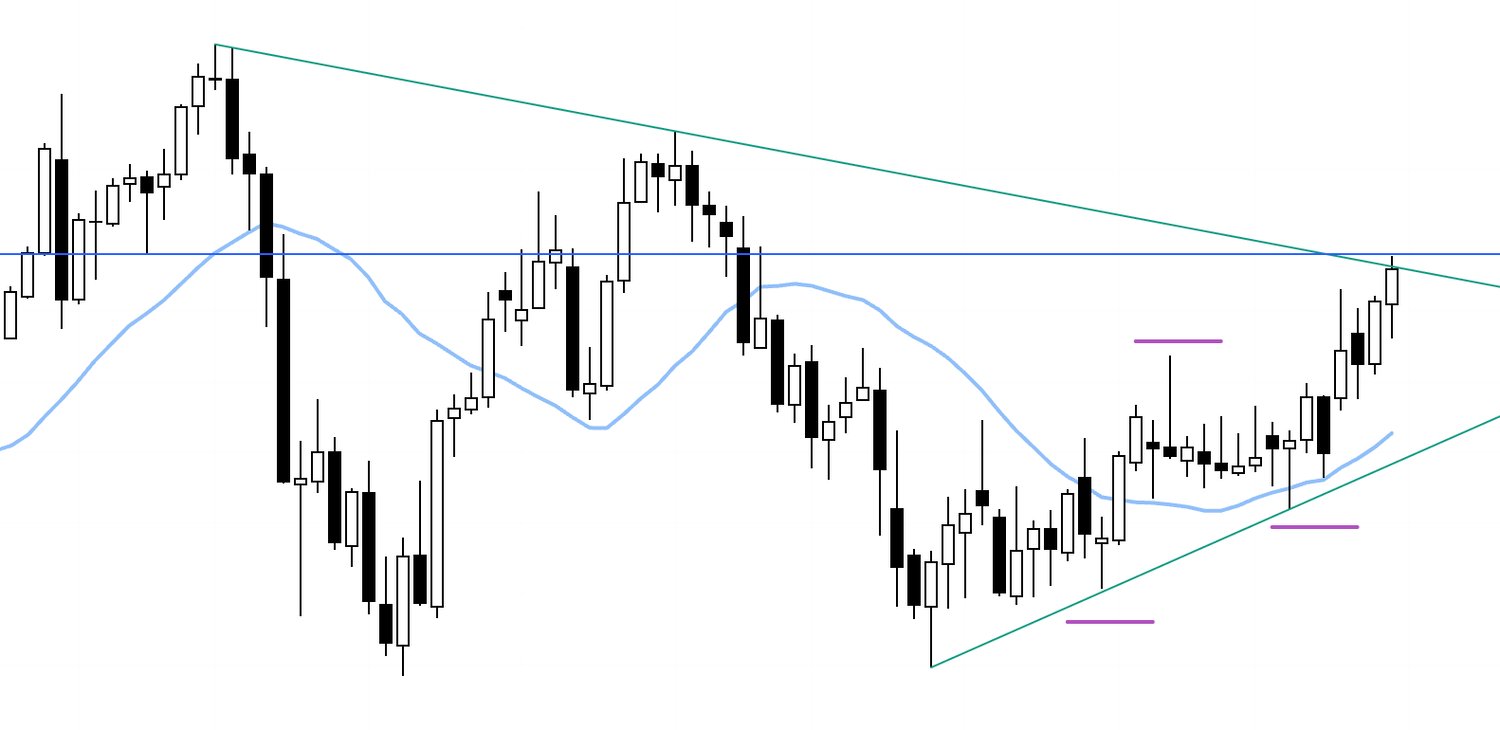
On the weekly chart, price has been printing higher lows and taking out prior highs, extending the uptrend, and has now reached a descending trendline drawn from lower highs visible even on the monthly.
The question is not whether we break above this inflection and keep rising, or react lower to build a pullback.
What matters is to have scenarios ready so that, whichever path the market chooses, you can act on the facts you see.
Daily
The daily likewise shows a series of higher lows and higher highs, i.e., an uptrend.
Given we are near a key level, I want to see whether price pushes through that level and then holds it as support for a further leg higher, or whether arrival at the level triggers concentrated profit‑taking from longs, forcing a pullback before the advance resumes.
Those are the first branches I intend to track.
With that in mind, let’s look at the 4h.
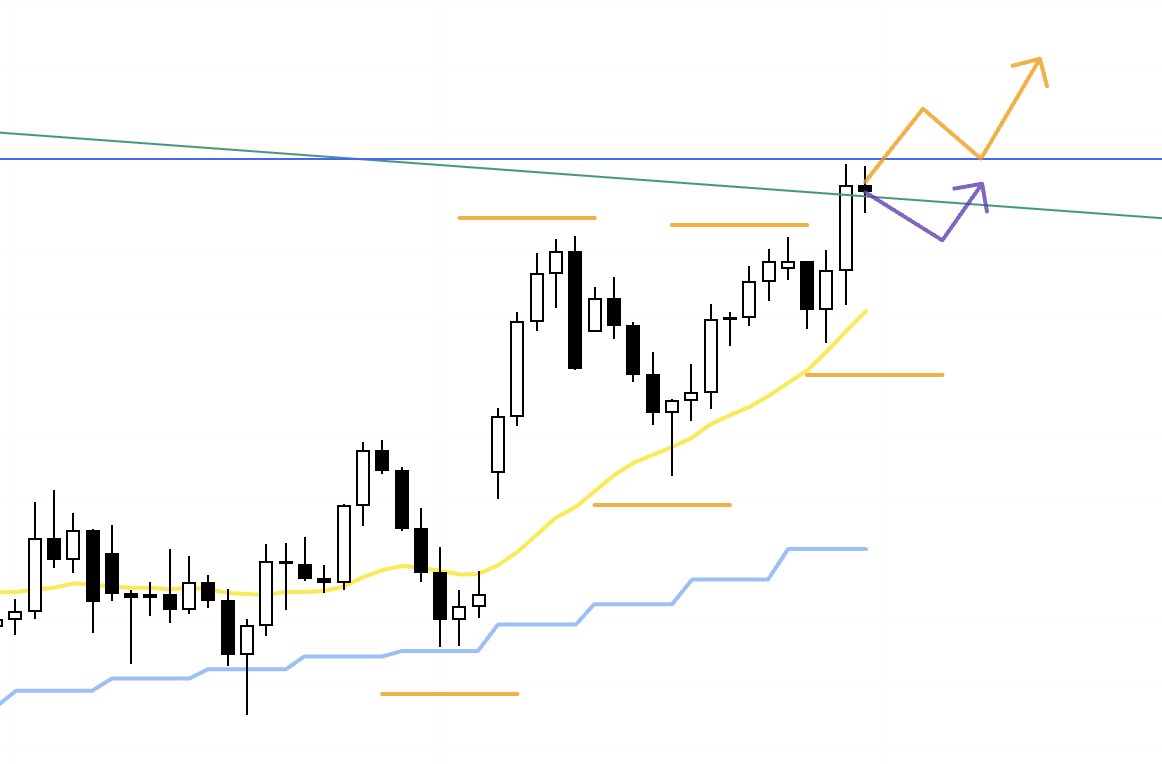
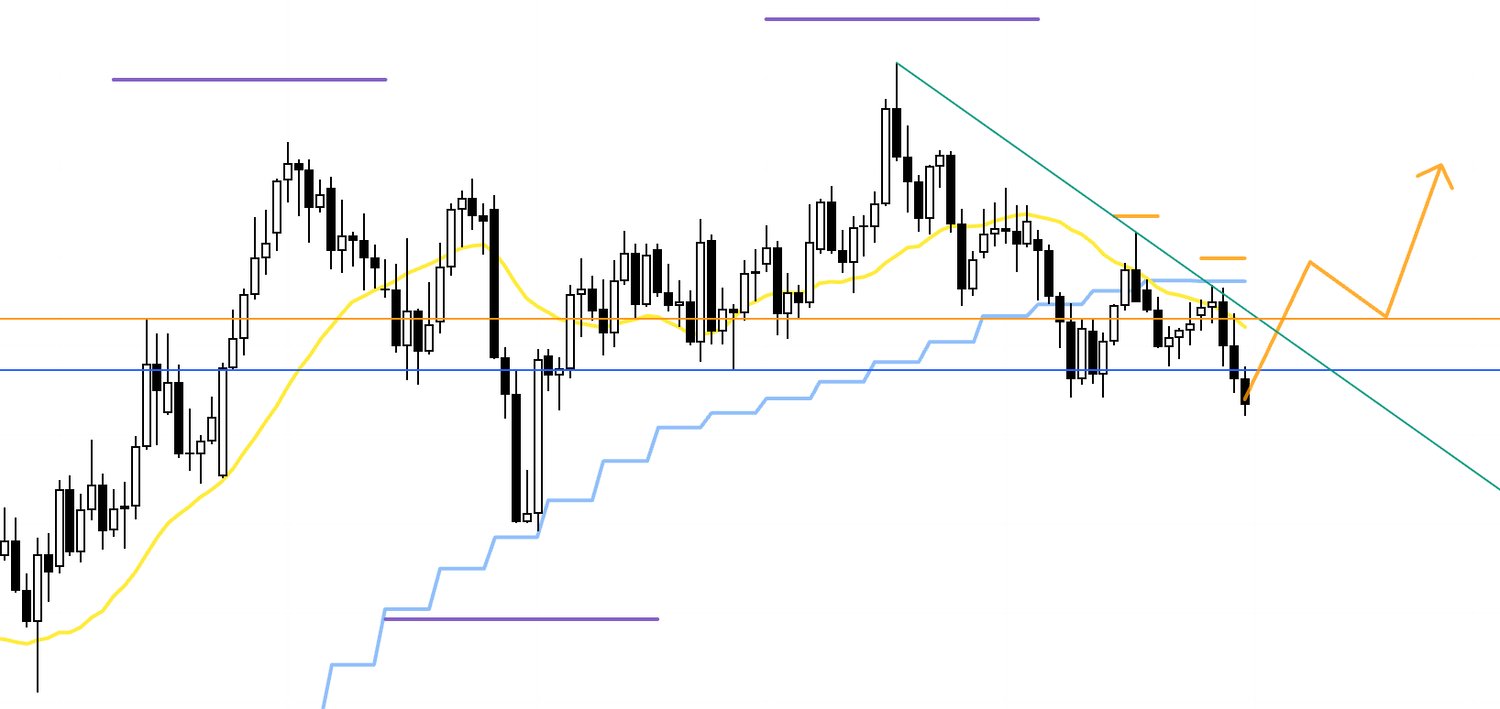
4h
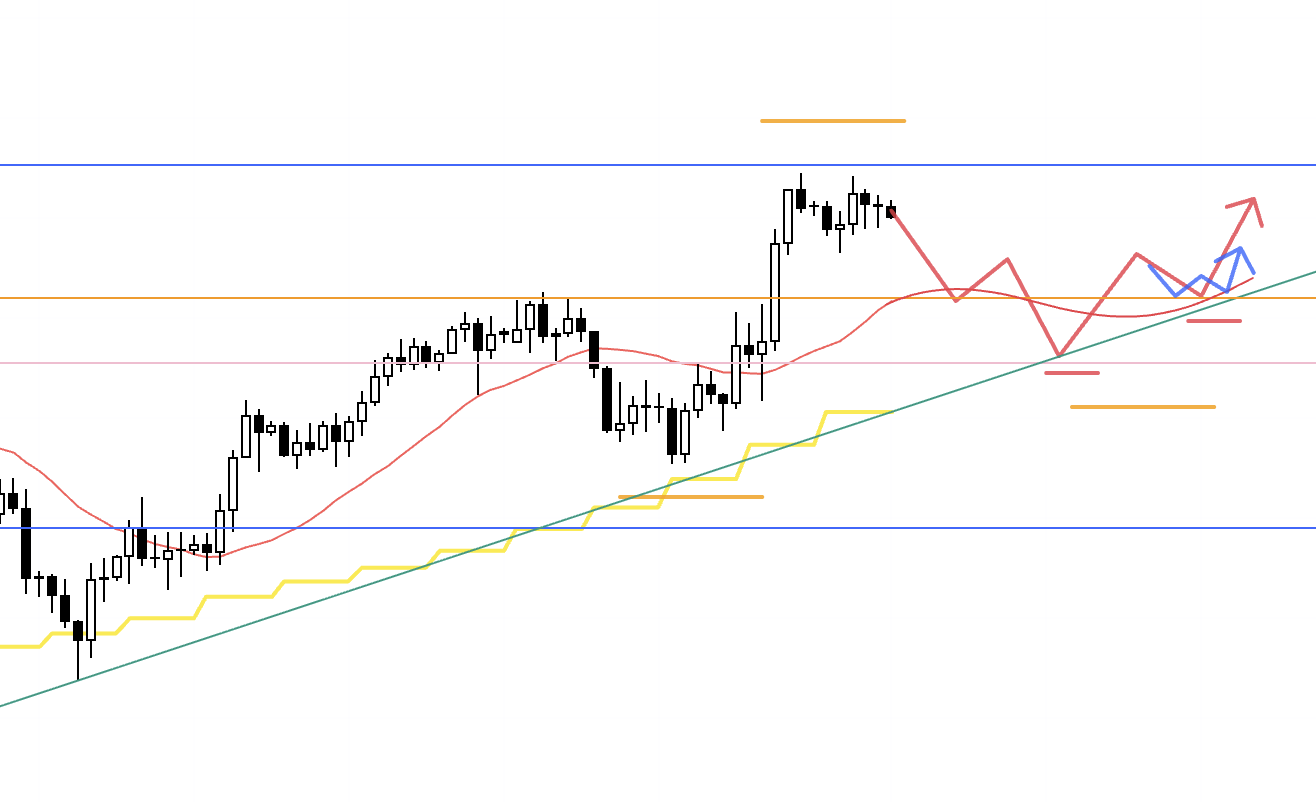
With a major level close overhead, pressing longs right here carries elevated risk.
If we first break above the level and then form a 4h higher‑low pivot while that level holds as support, I will drop to lower timeframes to evaluate longs.
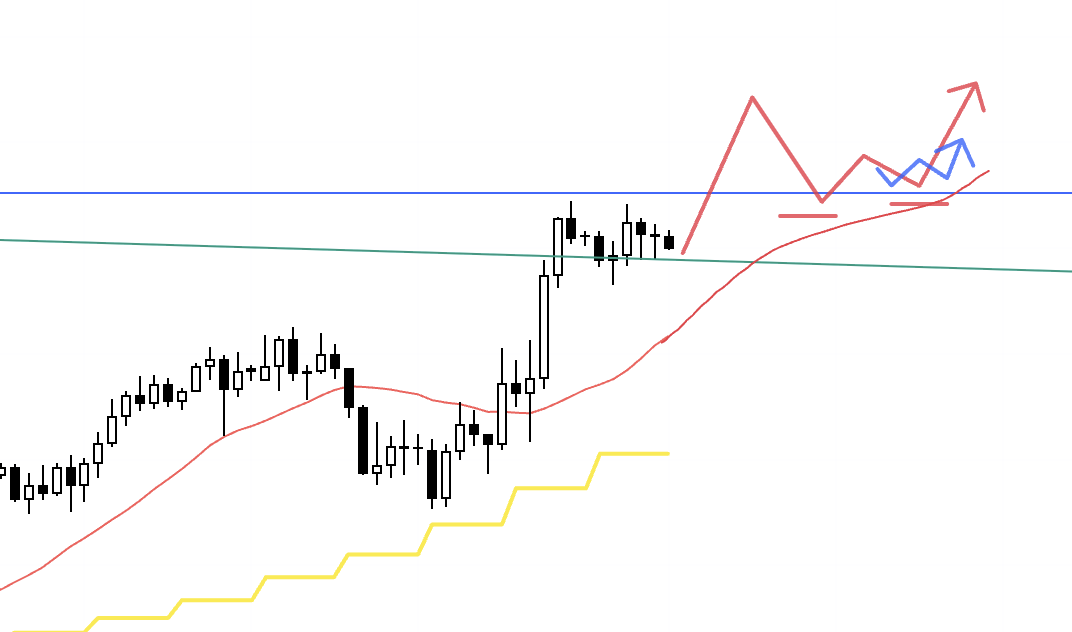
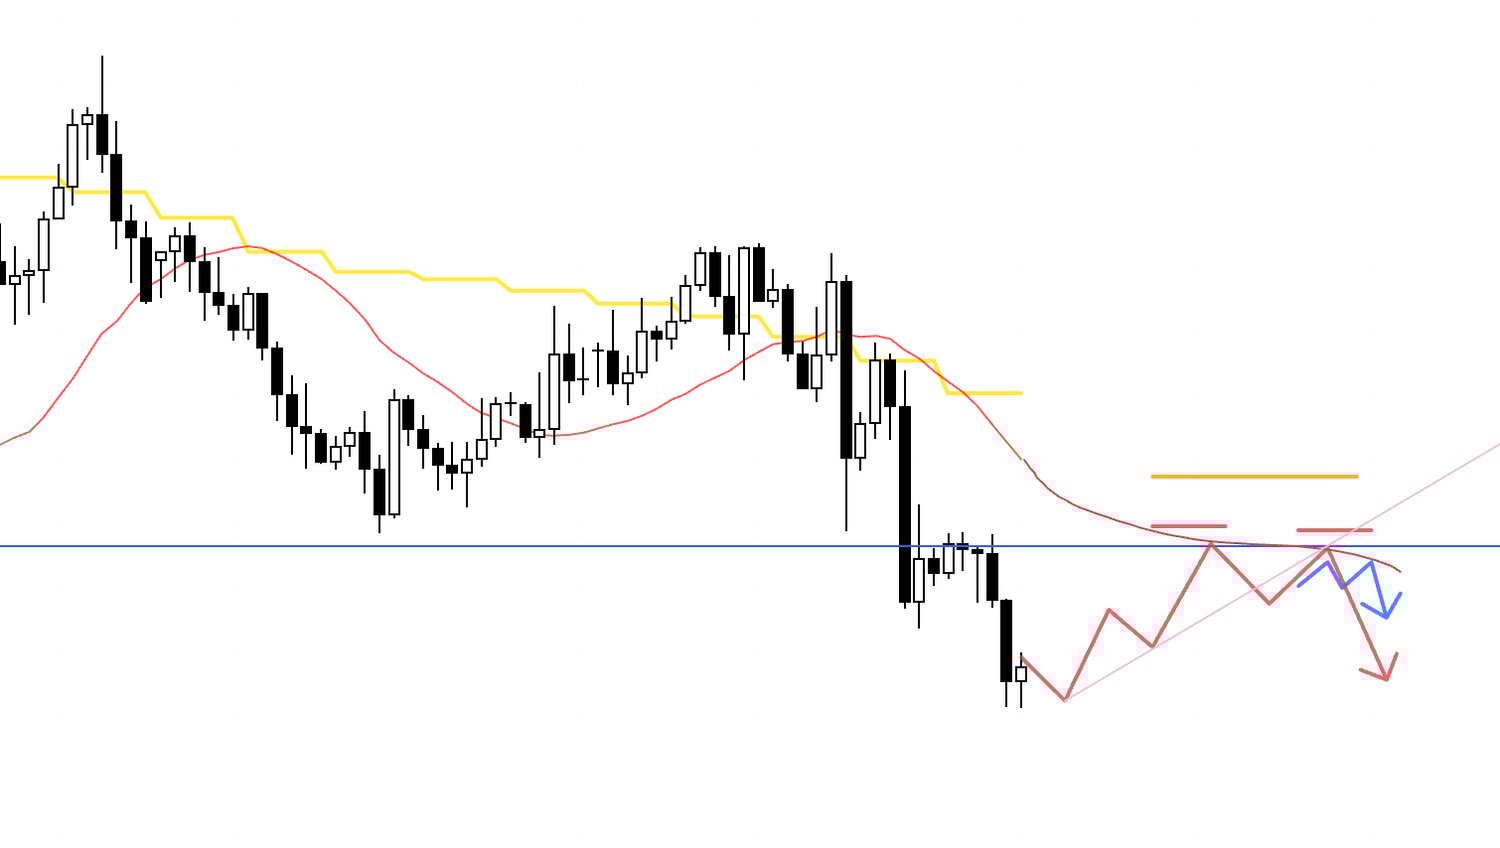
4h
Alternatively, if we dip first and then, as a daily pullback buy, form another 4h higher‑low pivot, I will again look to the lower timeframes for long setups.
In that case, be mindful of the overhead resistance line in blue.
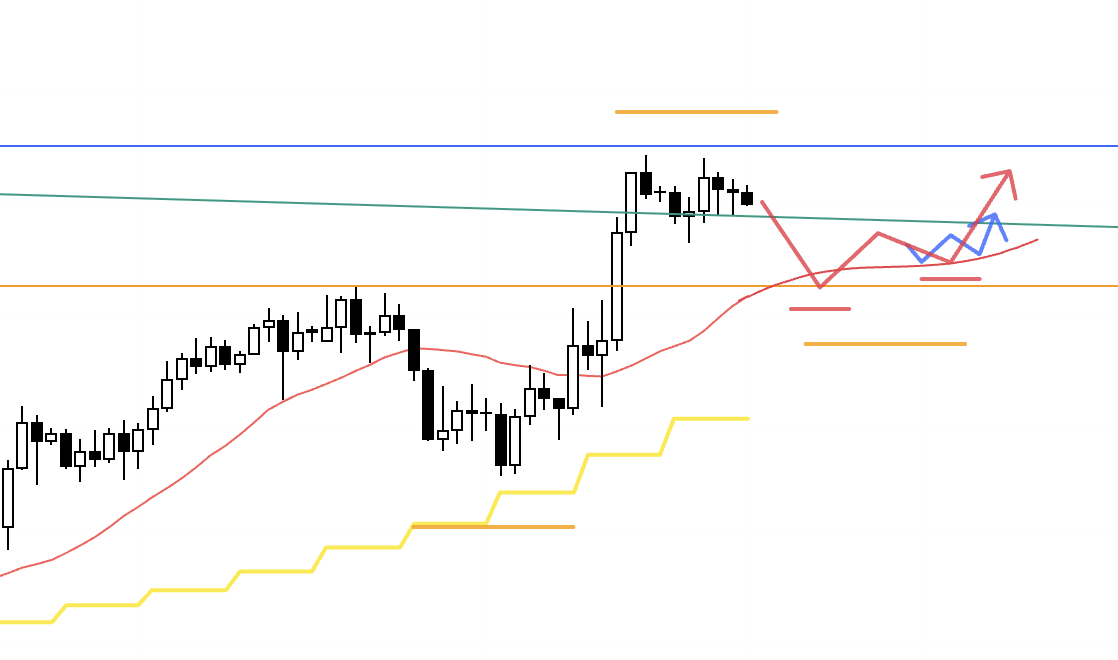
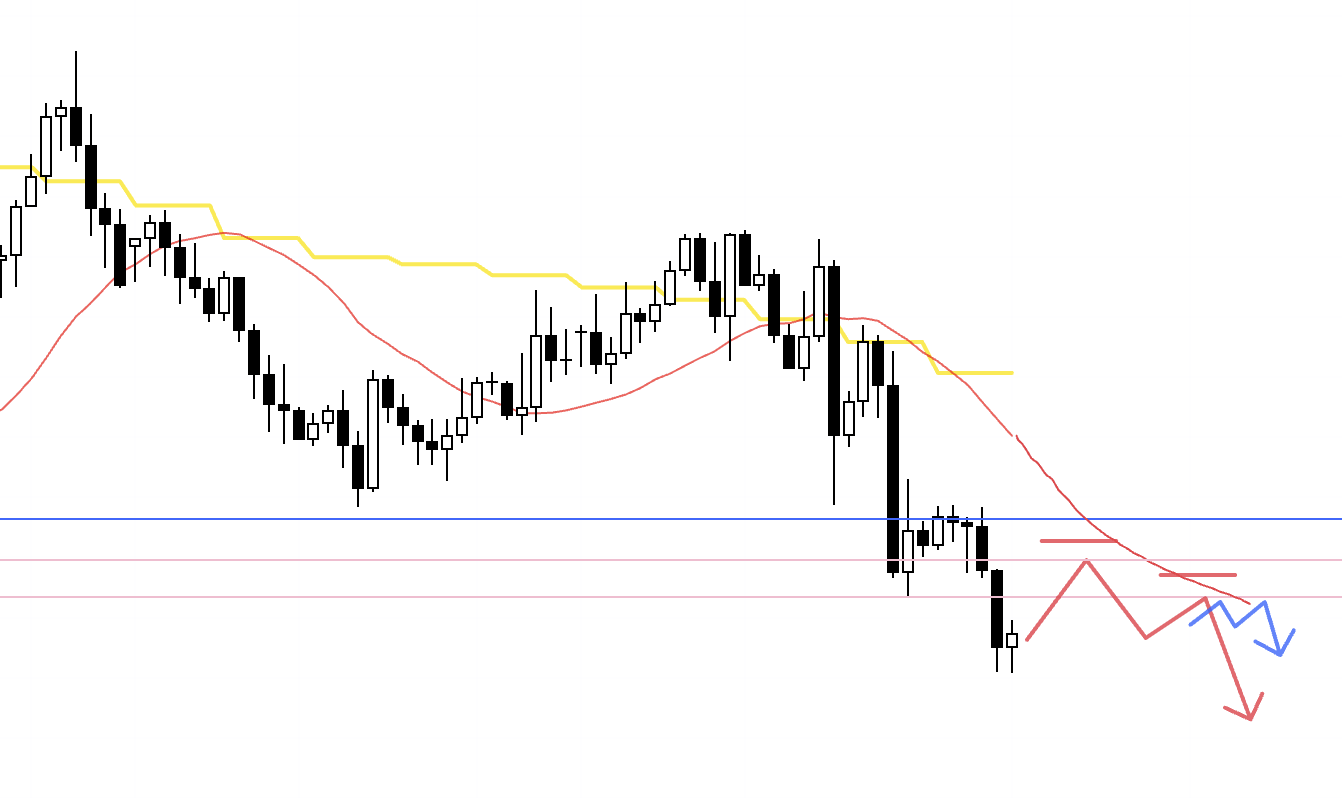
4h
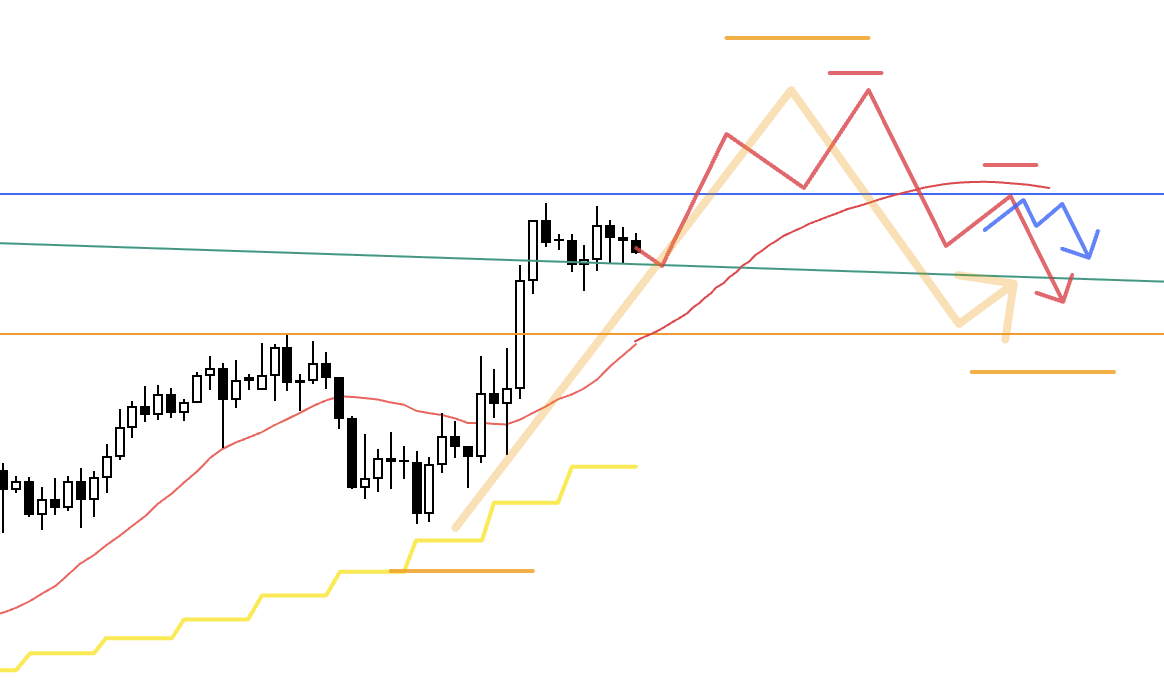
If price is capped by the upper level and the 4h carves a lower‑high pivot while also getting capped by moving averages, I will consider shorts.
However, on the daily we would be in “waiting for a pullback buy” mode, which means the deeper it drops, the more the buy‑side interest tends to build.
The key, therefore, is whether an entry exists with acceptable risk‑reward.
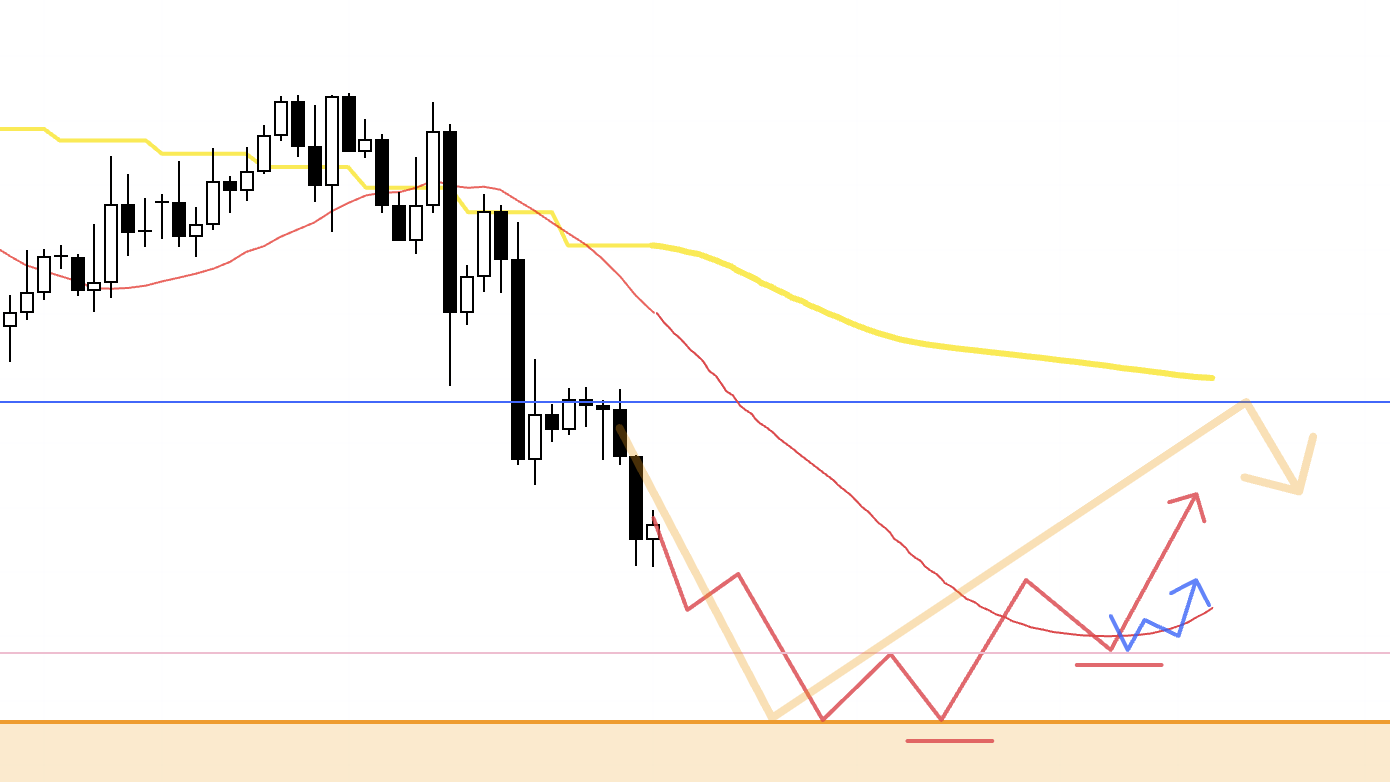
4h
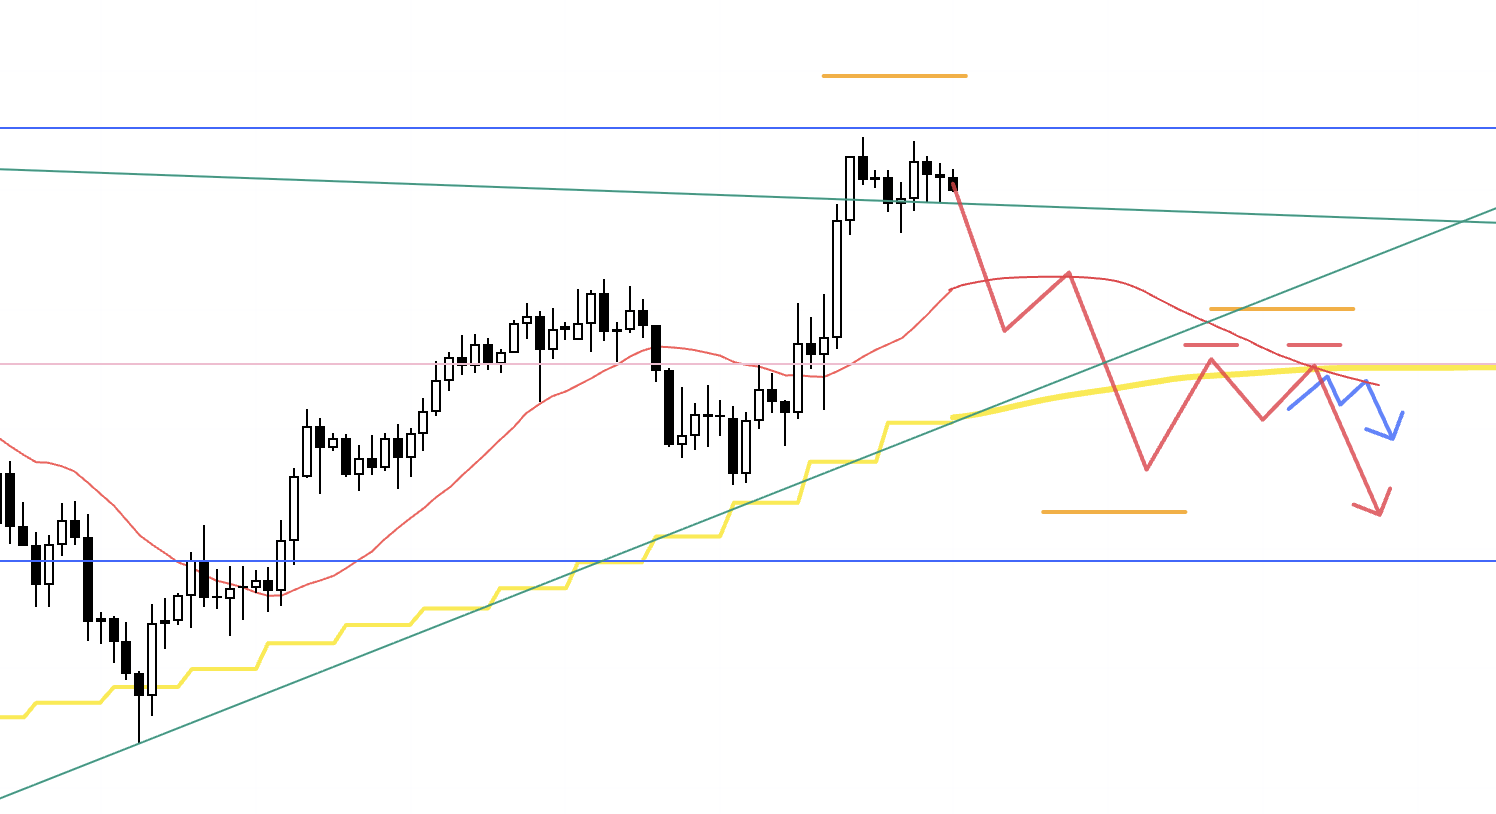
Because the daily is in an uptrend, I will be cautious with shorts.
If the daily sets a new lower‑high pivot and gets capped by the daily moving average (yellow), I will consider shorts.
Next, let’s turn to EURUSD.
〜・〜・〜・〜・〜・〜・〜・〜・〜・〜・〜・〜・〜・〜・
EURUSD
Weekly
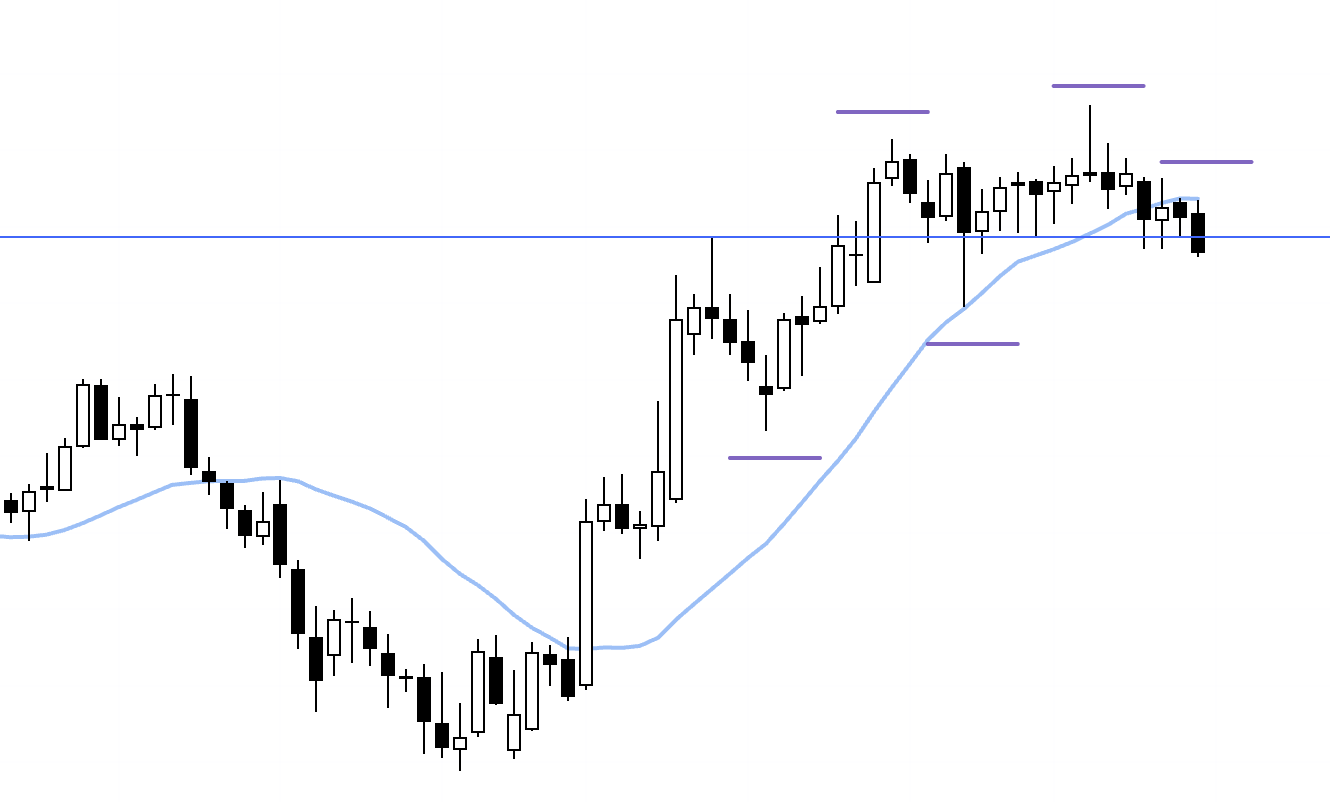
The weekly is in an uptrend with higher lows and higher highs, but after an extended sideways phase it has slipped below the moving average and has also undercut the blue support line that had held until recently.
The task now is to watch price action around that blue line and prepare scenarios for both outcomes: either it becomes a new lower‑high pivot that turns the market down, or dip‑buyers step in to defend the broader uptrend.
Daily
My base case in EURUSD is to sell rallies.
However, if price reclaims the blue line and the daily rotates from a downtrend into an uptrend, I will look to ride that move as weekly‑chart dip‑buying.
For the sell‑the‑rally plan, let’s drill into the 4h.
4h
At the moment the 1h downtrend remains intact, so selling immediately carries elevated risk.
First I want the 1h downtrend to terminate and the 4h to print a clear rally high suitable for a short.
Then, when the 1h rotates back into a downtrend, I will consider the short.
4h
Another path is for the 4h to break its downtrend first, enter a brief upswing to build a daily‑chart rally high, and then rotate back down.
I would look to sell within that newly formed 4h lower‑high pivot.
That would be a textbook daily‑level sell‑the‑rally setup.
4h
If we extend lower from the weekly open and get stretched away from the daily moving average, a 4h trend rotation higher could become a tactical long.
That would be a rally intended to form a daily‑chart sell zone, which means the higher it goes the more sell‑the‑rally interest may build.
The key is whether an entry appears with acceptable risk‑reward, and if I do take it, I will consider taking partial profits, for example at key levels.
〜・〜・〜・〜・〜・〜・〜・〜・〜・〜・〜・〜・〜・〜・
That’s all for now.
These are the scenarios as of today, and as the week unfolds I will update and refine them based on how price actually trades.
My scenarios may look straightforward when drawn on a chart, but sketching the right side of the chart—where nothing is yet printed—is a demanding skill.
You must understand, across timeframes, what a trend rotation on one timeframe implies for higher ones, and where the meaningful lines lie, and you must map where risk and orders tend to concentrate.
Only then can you draft scenarios with intent.
As I always say, a scenario is not a “prediction” of the chart.
It is an action plan.
You are not drawing the chart’s future so much as you are drawing your own future actions.
Planning scenarios for the blank right side of the chart is hard, but without scenarios you do not know what you are waiting for.
That means you cannot practice the essential trading behavior of waiting, and you end up getting tossed around by the tape, making ad‑hoc “maybe I can buy here, maybe I can sell there” decisions.
With scenarios, what you are waiting for becomes explicit, and “do nothing unless it happens” becomes a valid choice.
I do not predict the future.
Whether price rises or falls, whether a trendline breaks or rejects, either outcome is fine.
If the buy‑side edge emerges, I buy.
If the sell‑side edge emerges, I sell.
When a trendline breaks, some people get angry and say, “So trendlines don’t work.”
That is a misunderstanding of both the line and the craft.
What matters is how you interpret the break, what it signifies, and how you can convert that information into trading edge.
Once that sinks in, your scenario building will level up.
If my consistent planning and execution helps you build consistency in your own trading, I am glad.
These scenarios are my personal plan.
If you have not yet settled on a method, feel free to use them as a reference for building your own approach.
If you already have a well‑defined process, please do not let my plan distract you from your rules.
Thank you for reading to the end.