


In this report I will review the key points of my trading this week, focusing on the actual trades I took.
This Weekly Trade Report is published every Saturday.
When you read it together with Trade Scenarios, which I post every Sunday, I believe it will give you a useful reference for how I think in advance and how I actually execute trades based on those scenarios.
This is not advice saying “you should trade like this,” nor am I claiming that this is the correct answer.
It is not about showcasing individual winning or losing trades, nor is it about recommending a specific strategy based on those results.
My purpose is to show, at a practical level, how I repeatedly follow a consistent process based on pre-defined scenarios, and to offer that as a reference for your own strategy building and for achieving consistency in your process.
The outcomes I show are nothing more than my personal results, and they do not guarantee your future profits.
Please keep that firmly in mind, and when it comes to your own trading, make sure you carry out your own testing and preparation, and trade entirely under your own responsibility.
My trading is based on buying pullbacks and selling rallies on the 4h timeframe.
If you are interested in my pullback and rally strategy, please read my past blog posts on Dow Theory and multi-timeframe analysis.
Now, please take a look at the following charts.
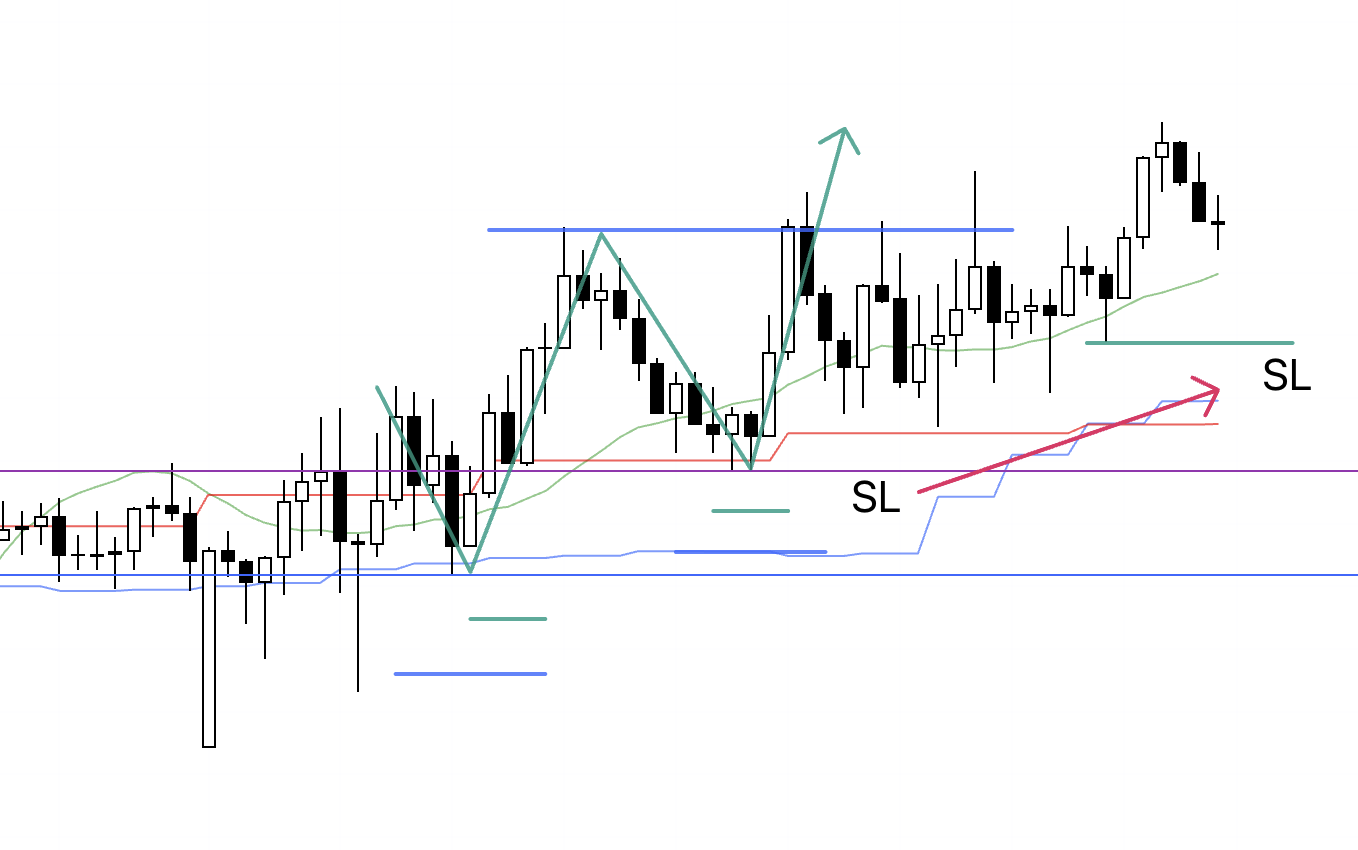
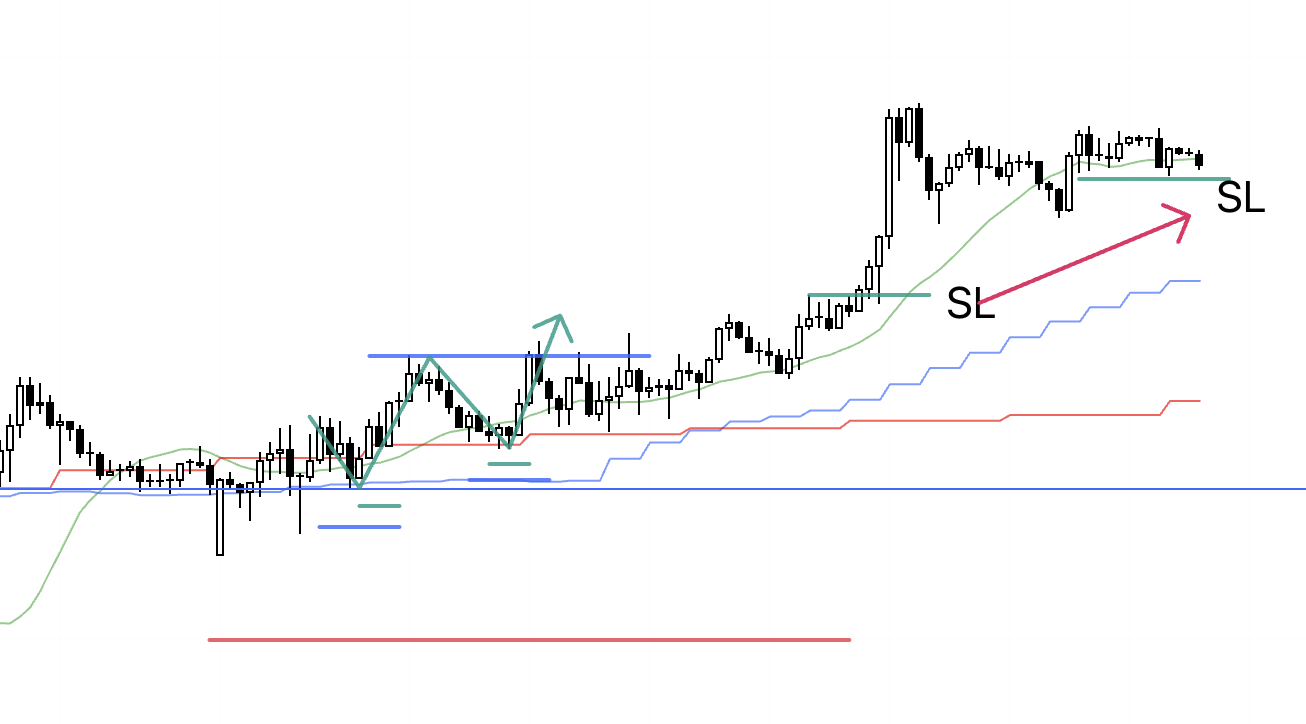
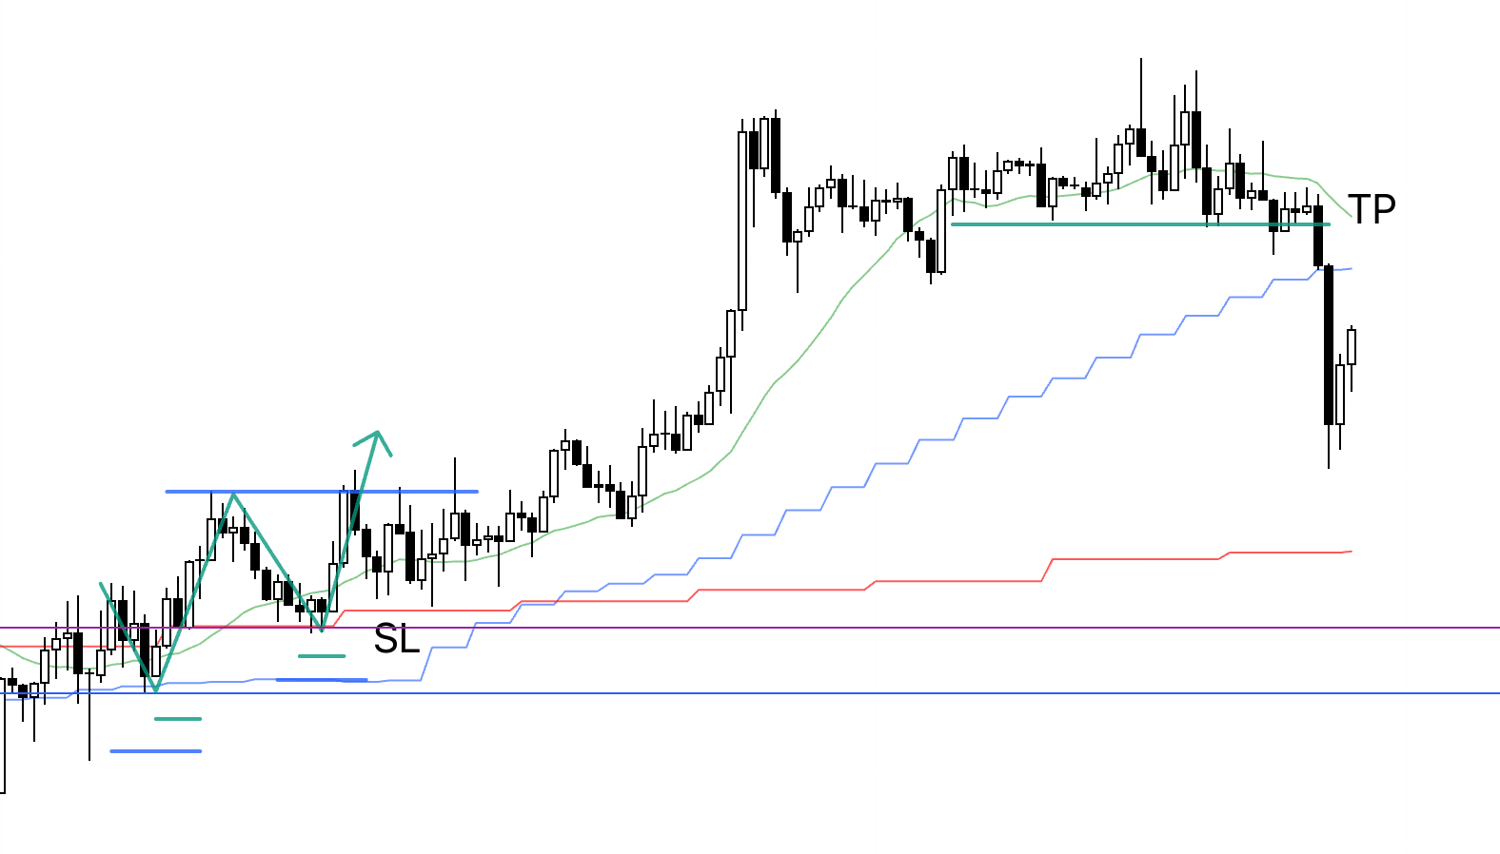
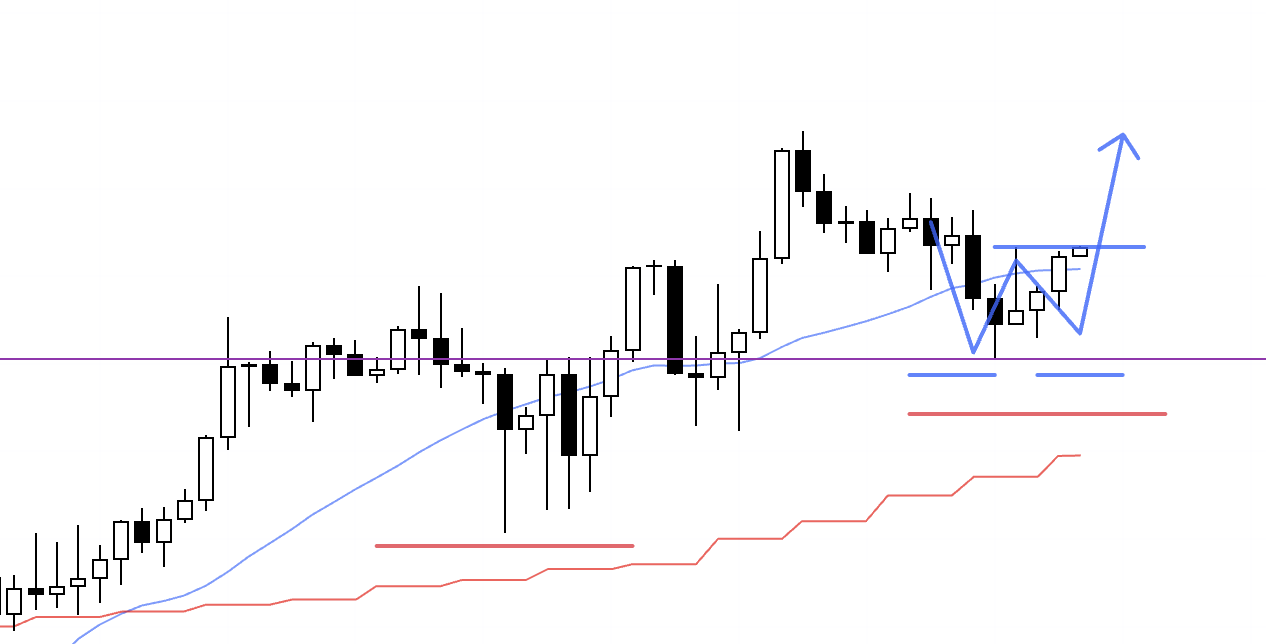
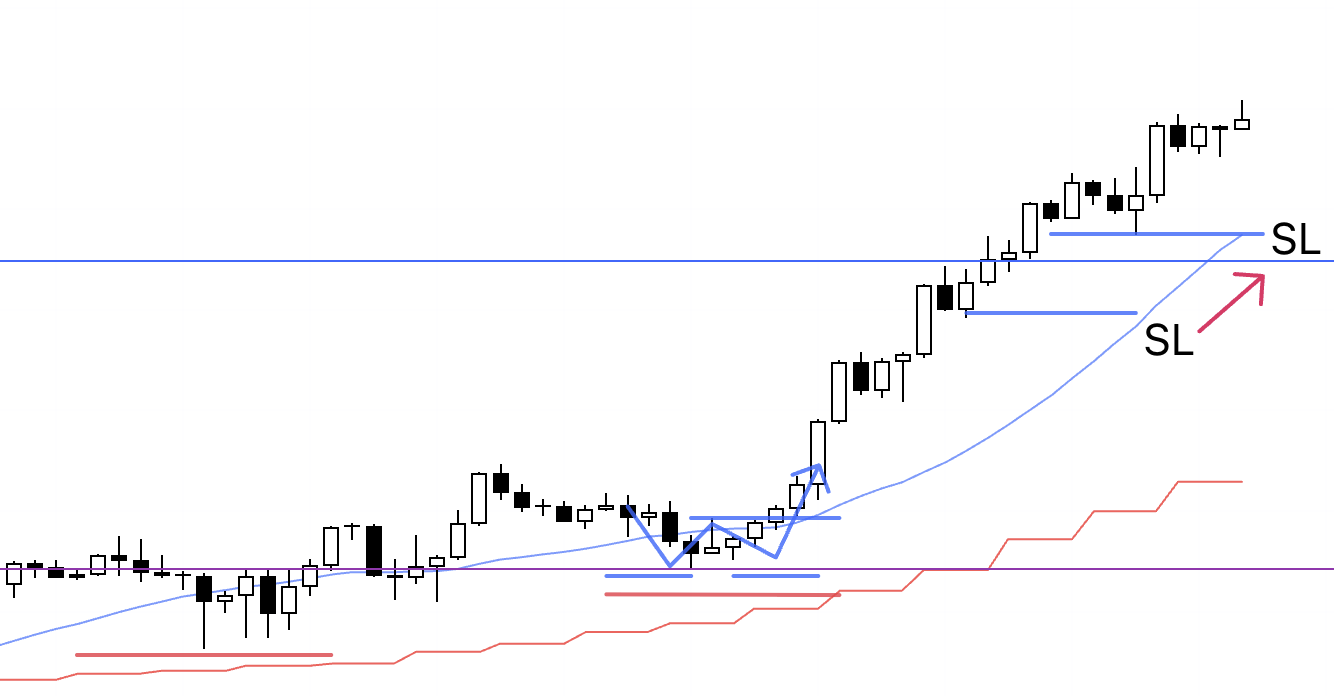
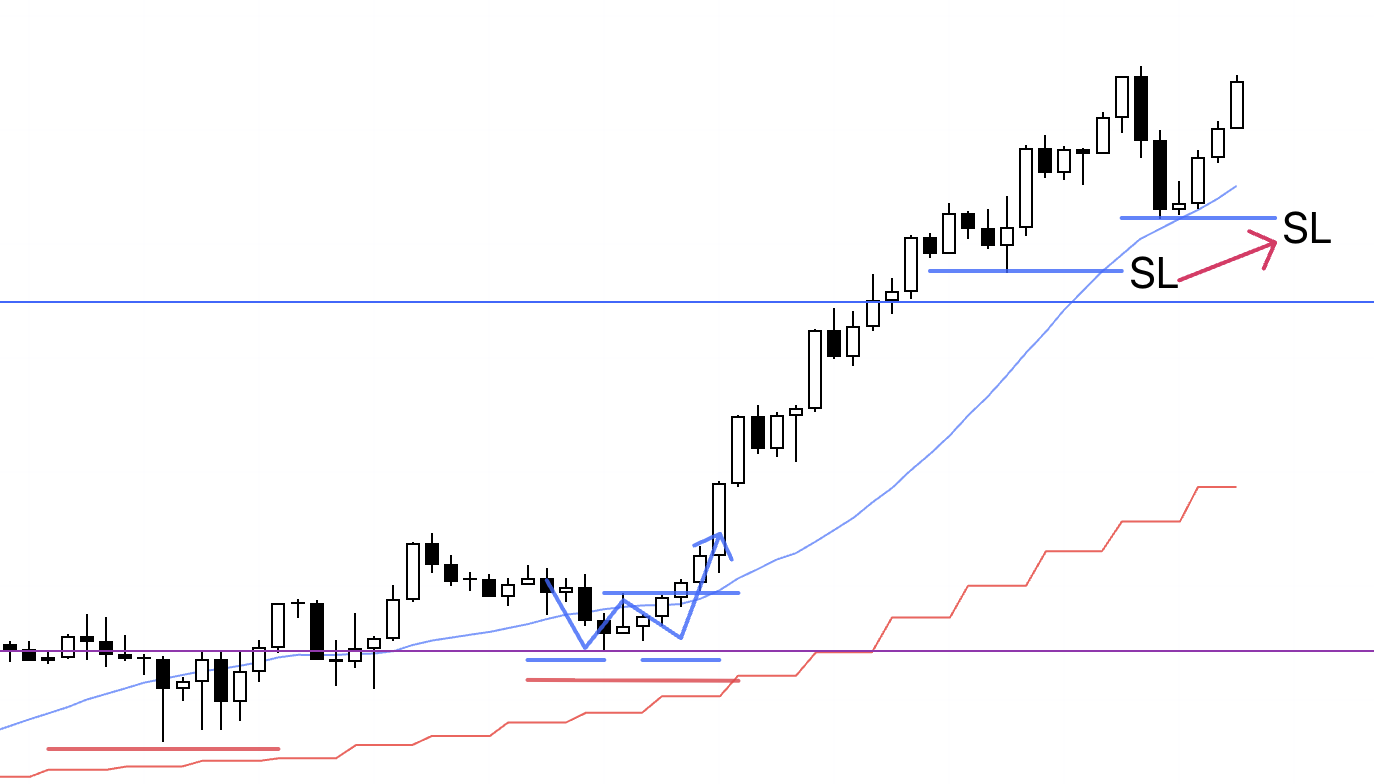
USDJPY 4H
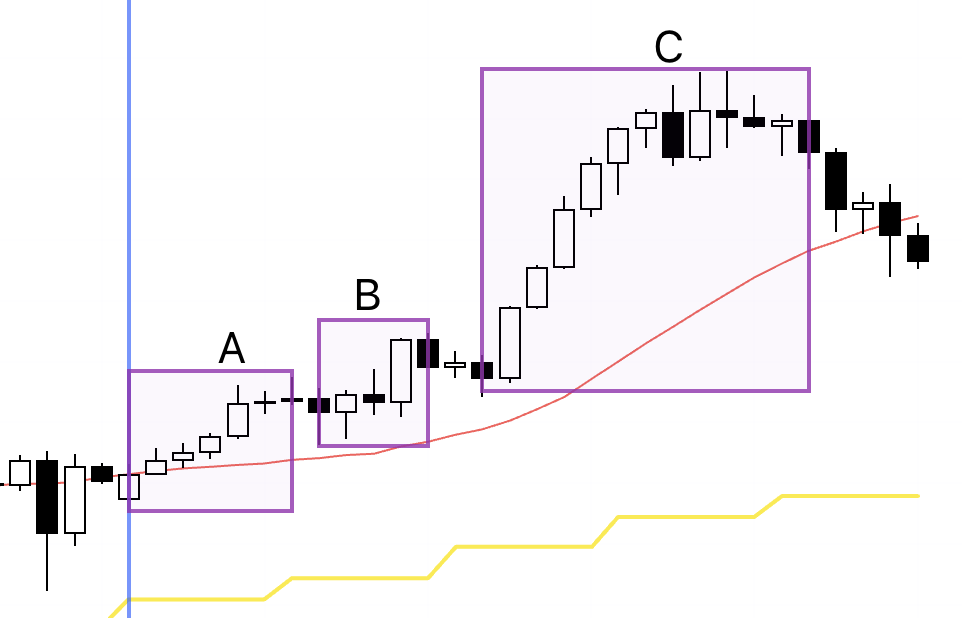
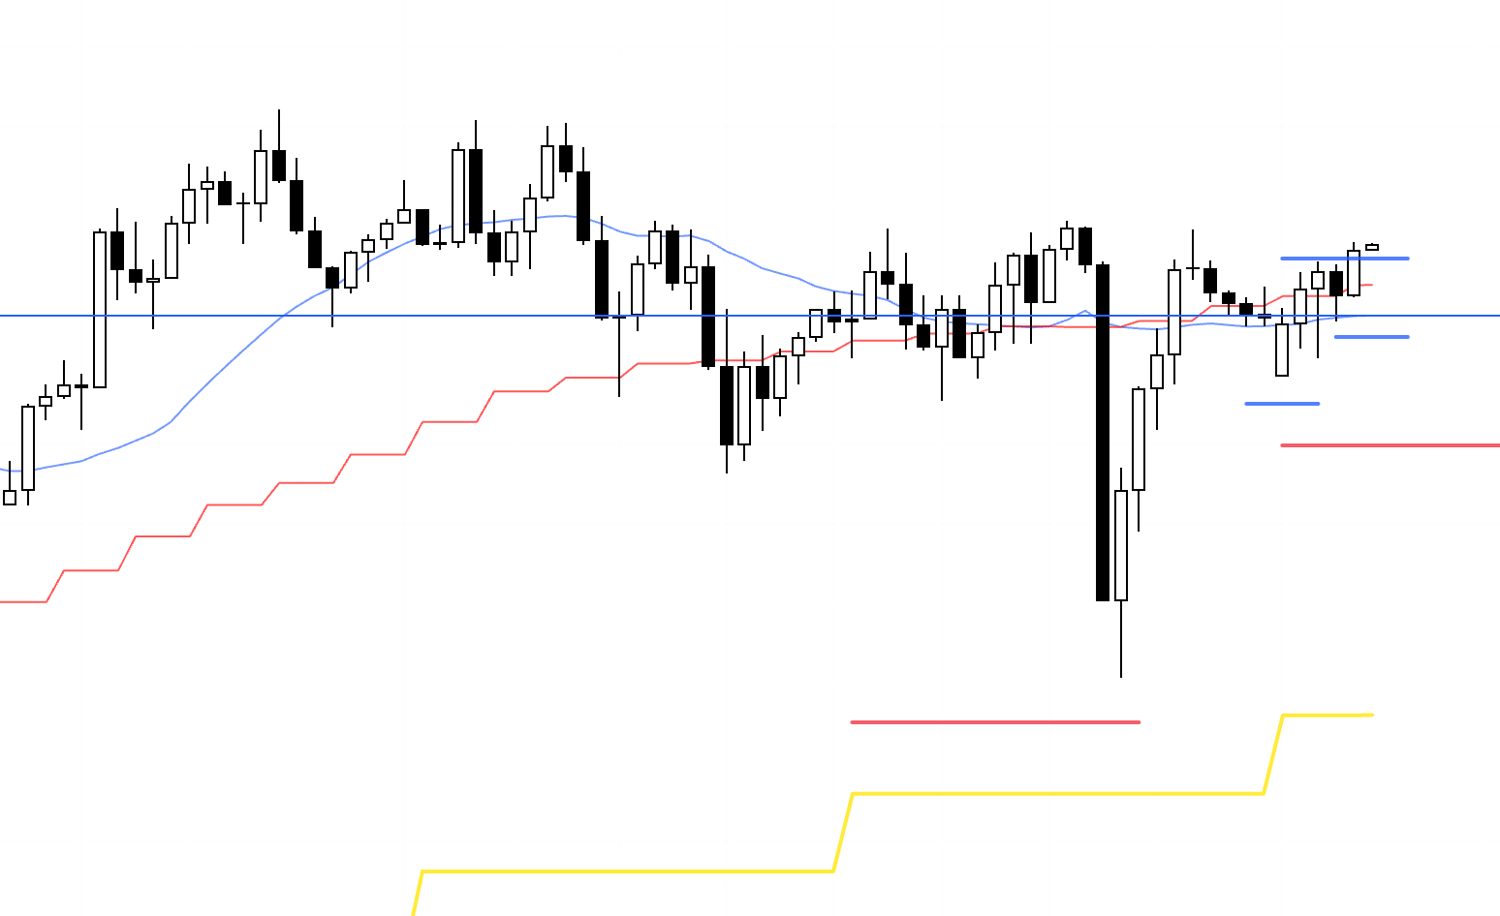
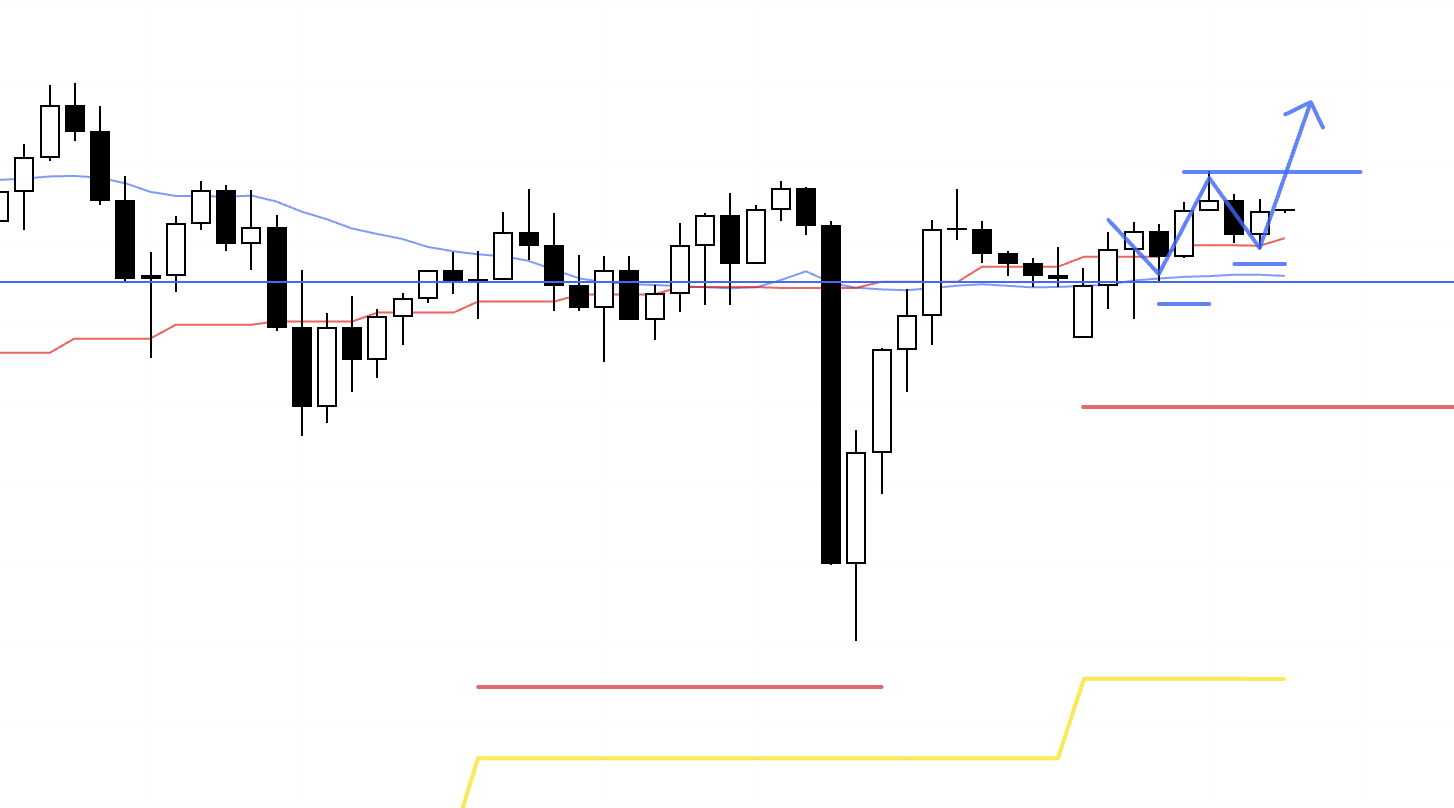
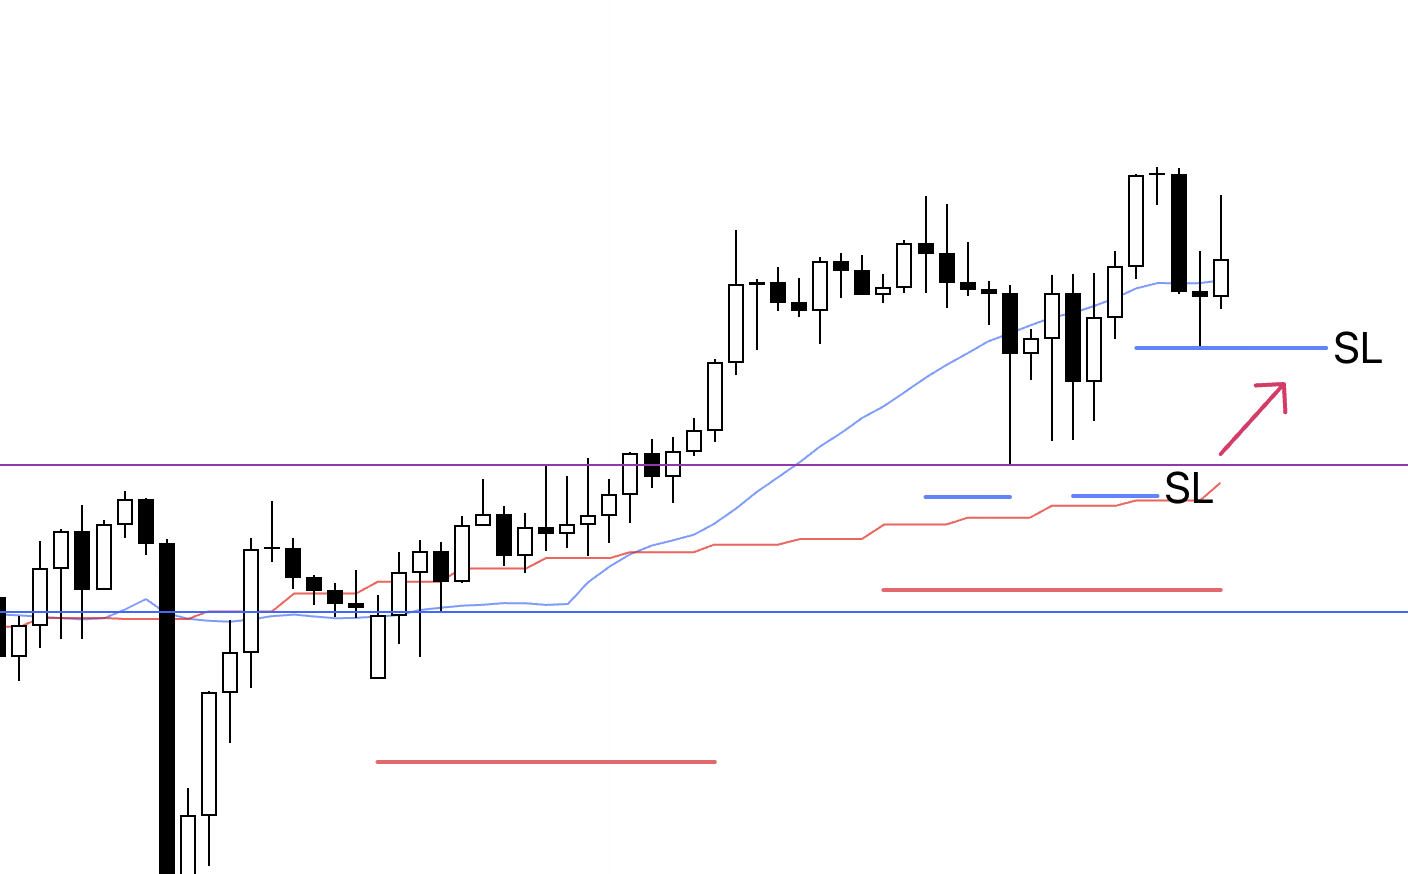
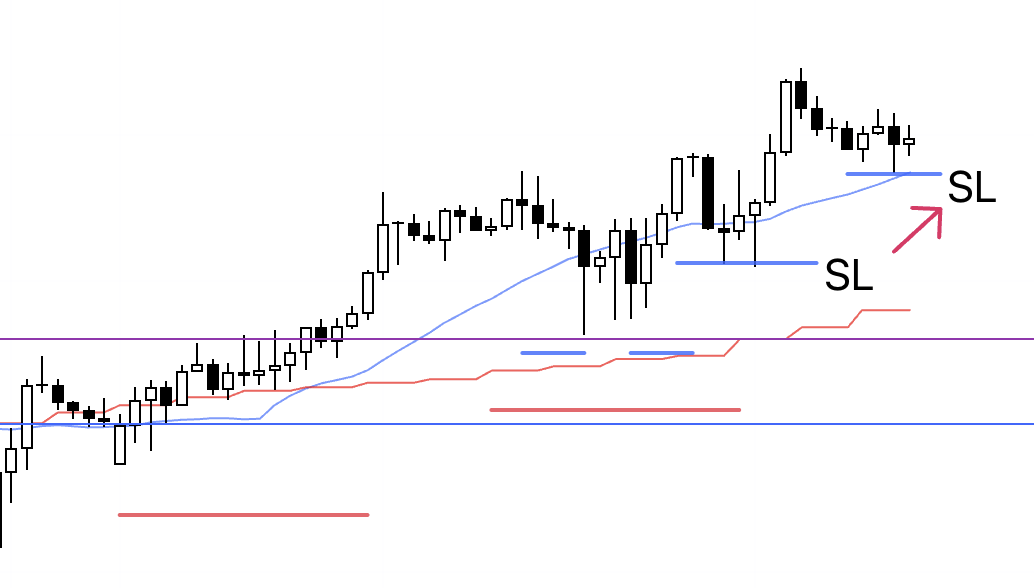
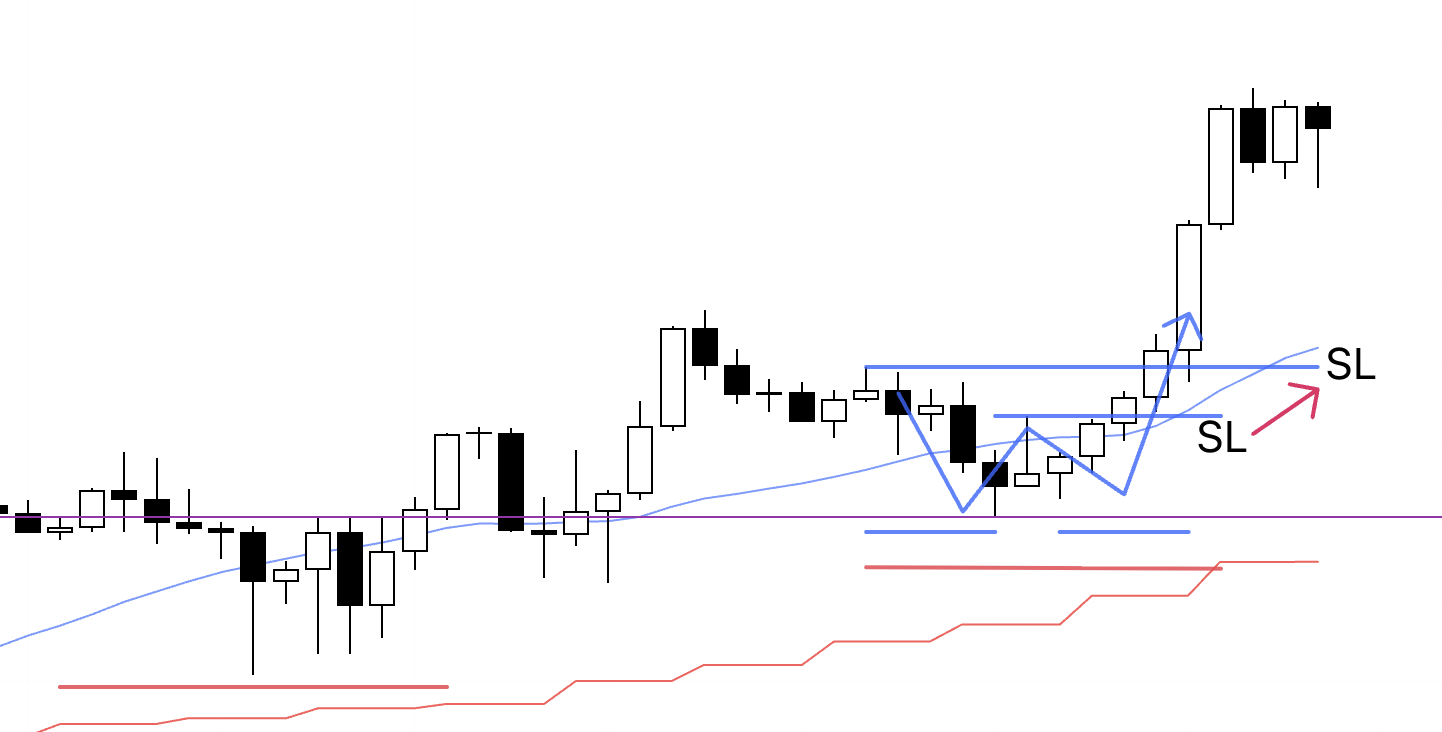
This is the 4h chart of USDJPY.
This week’s price action is everything to the right of the blue vertical line shown on the chart.
For USDJPY I traded at the three points marked by the rectangle this week.
It was a very straightforward week where I simply kept buying the pullbacks.
For each of those three trading points, I was capturing screenshots in real time during the trades and writing down what I was thinking at the time, so I will show those later.
Next, please look at the EURUSD chart below.
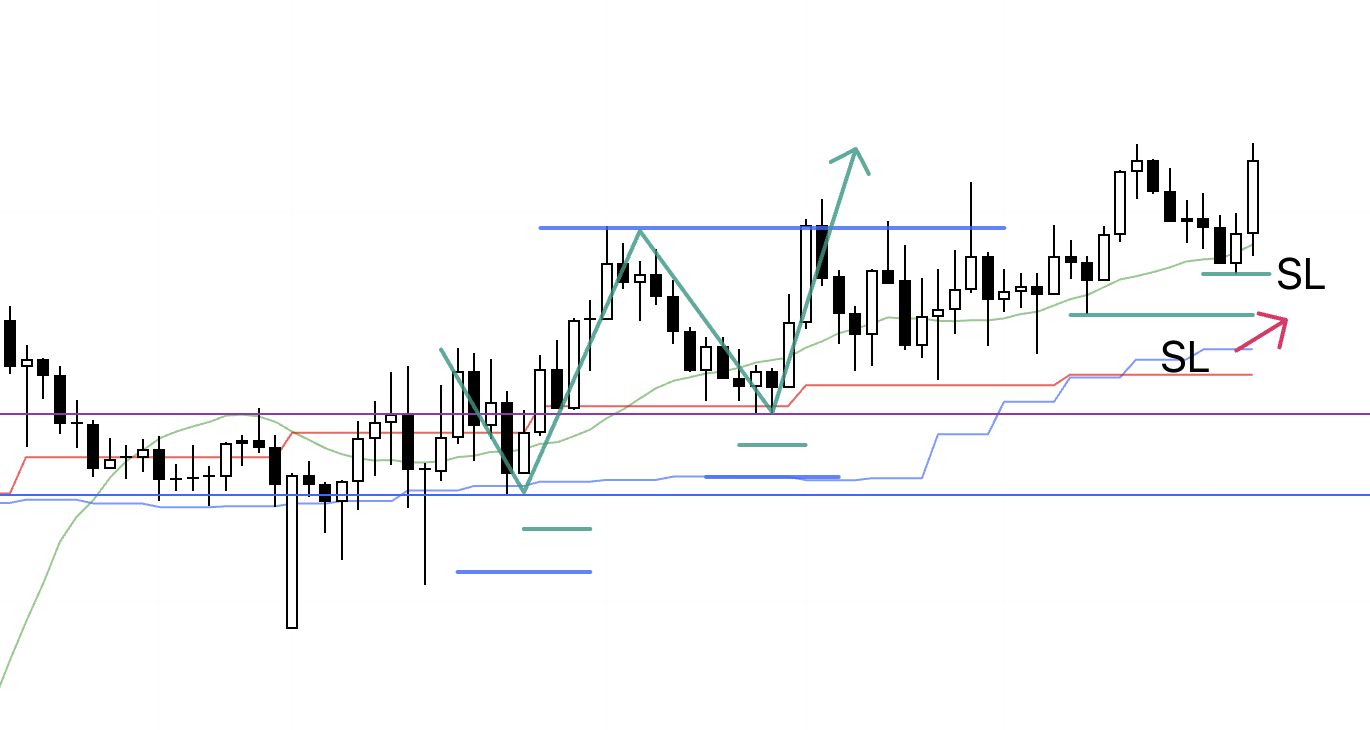
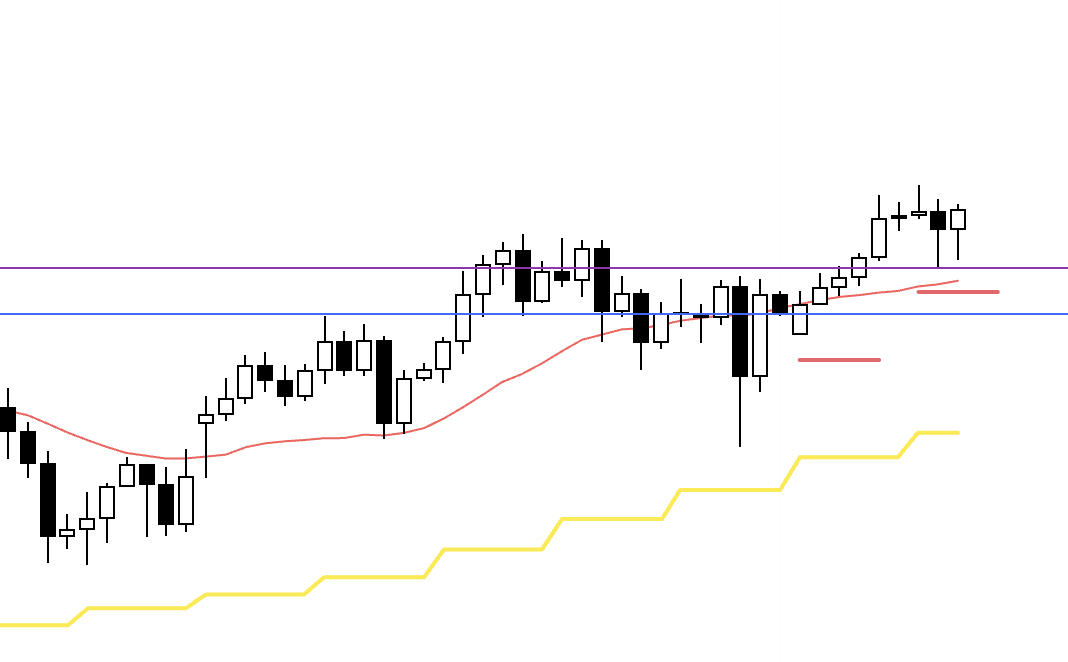
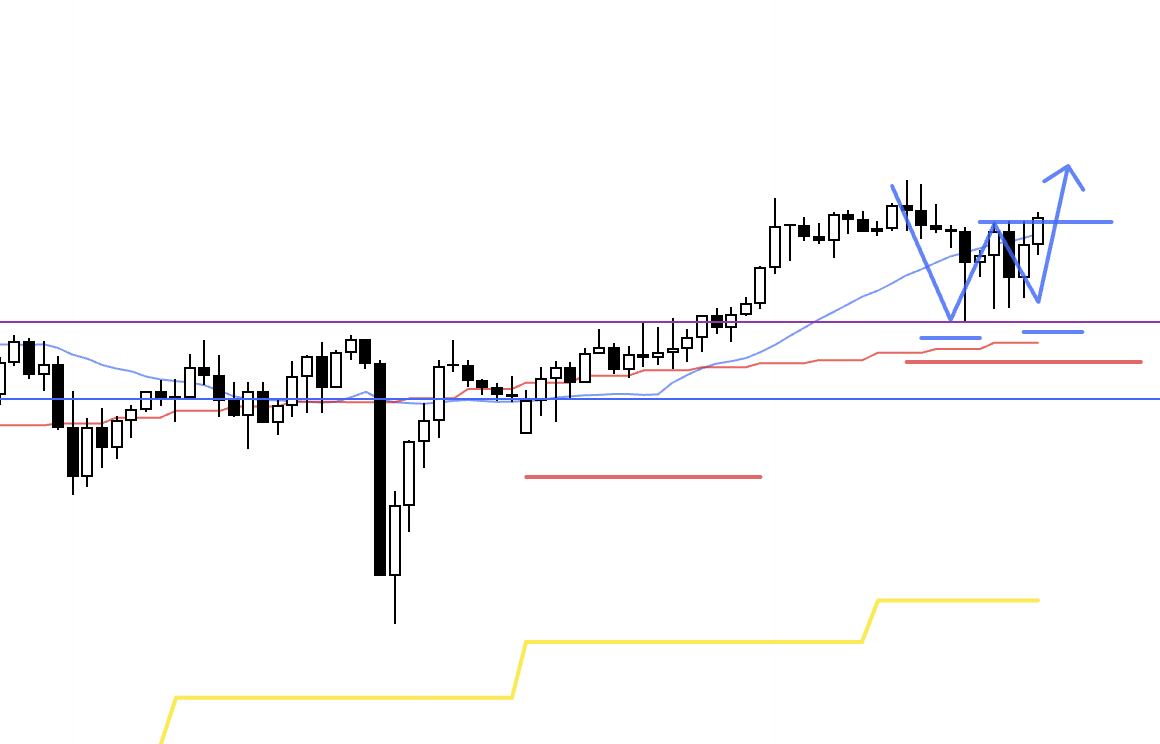
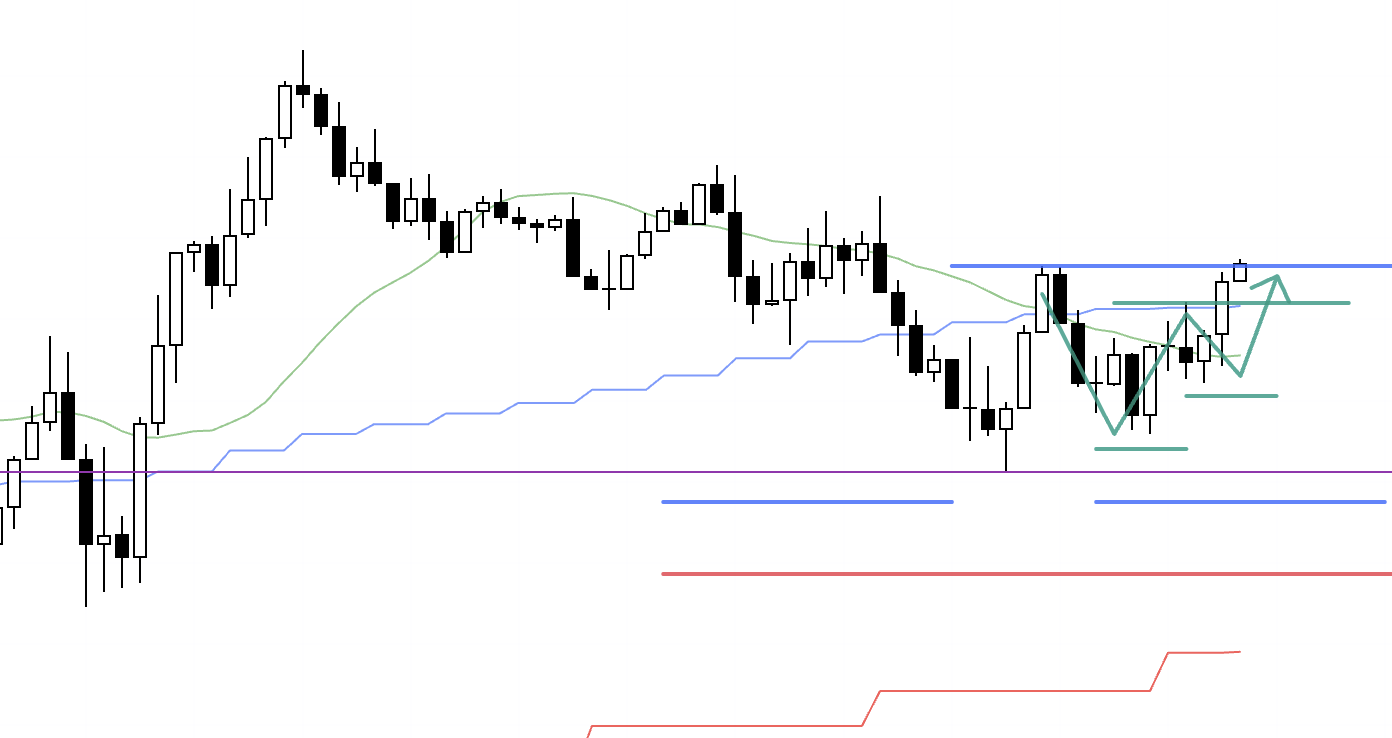
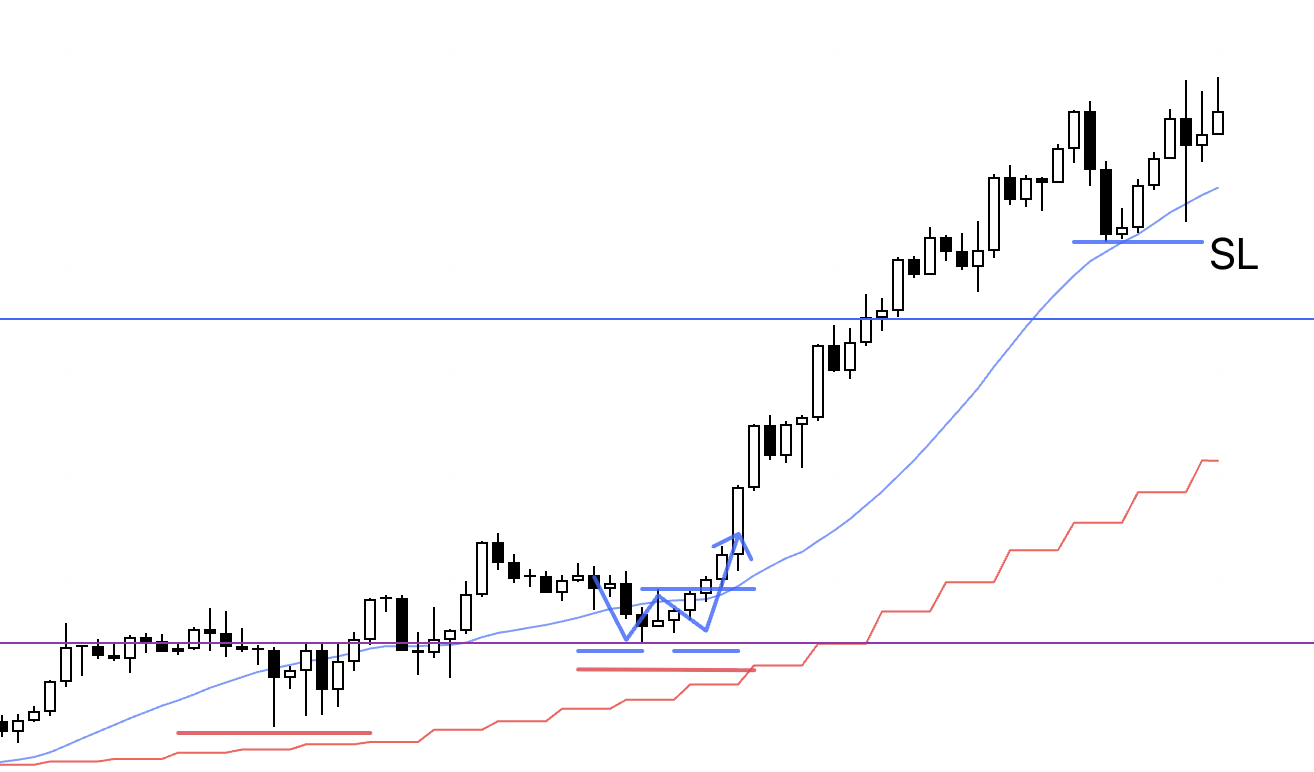
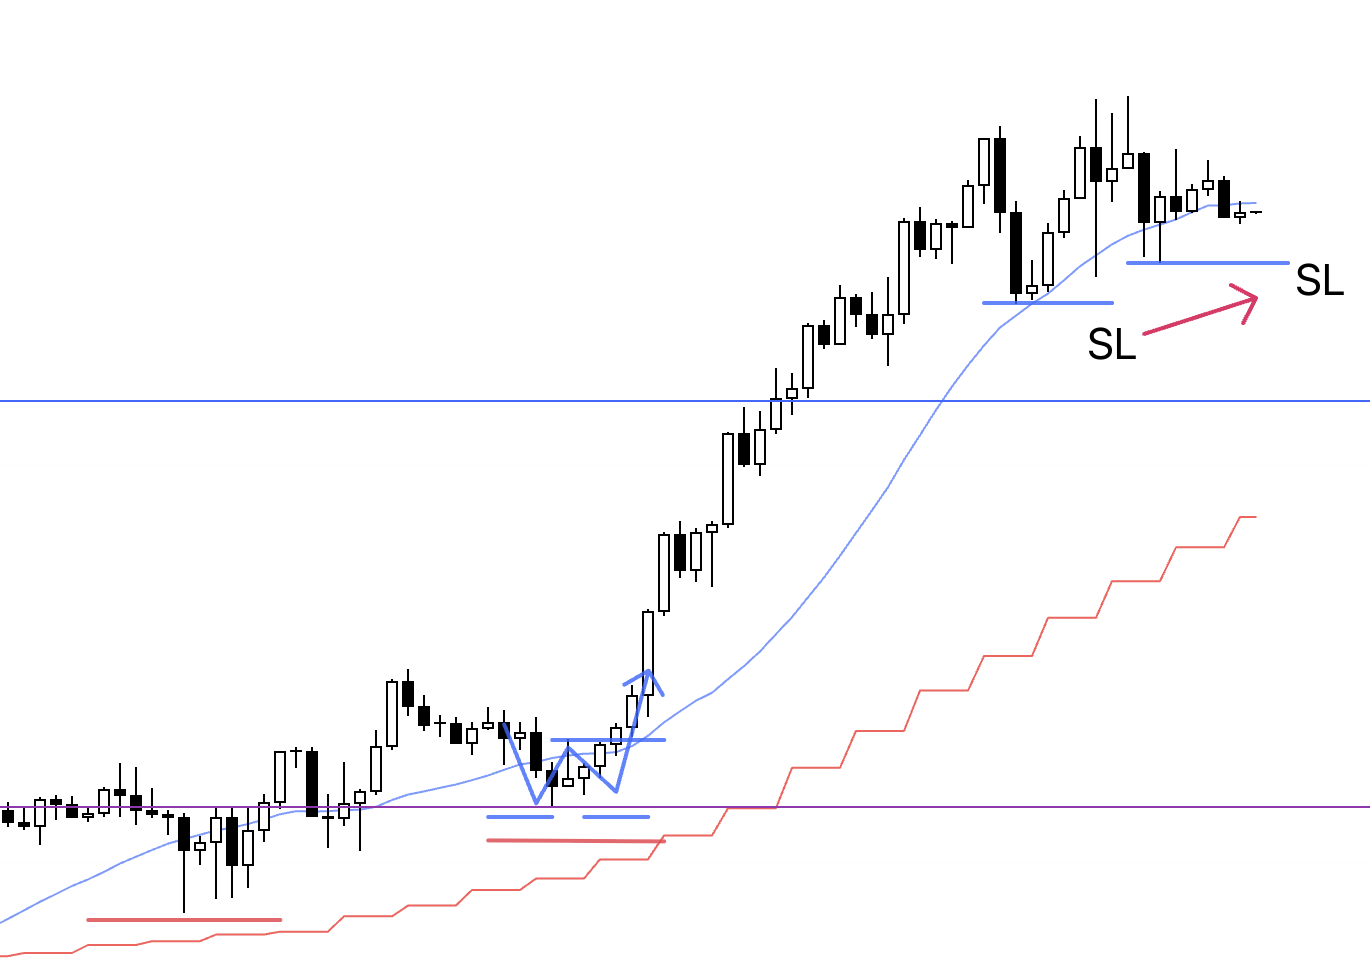
EURUSD 4H
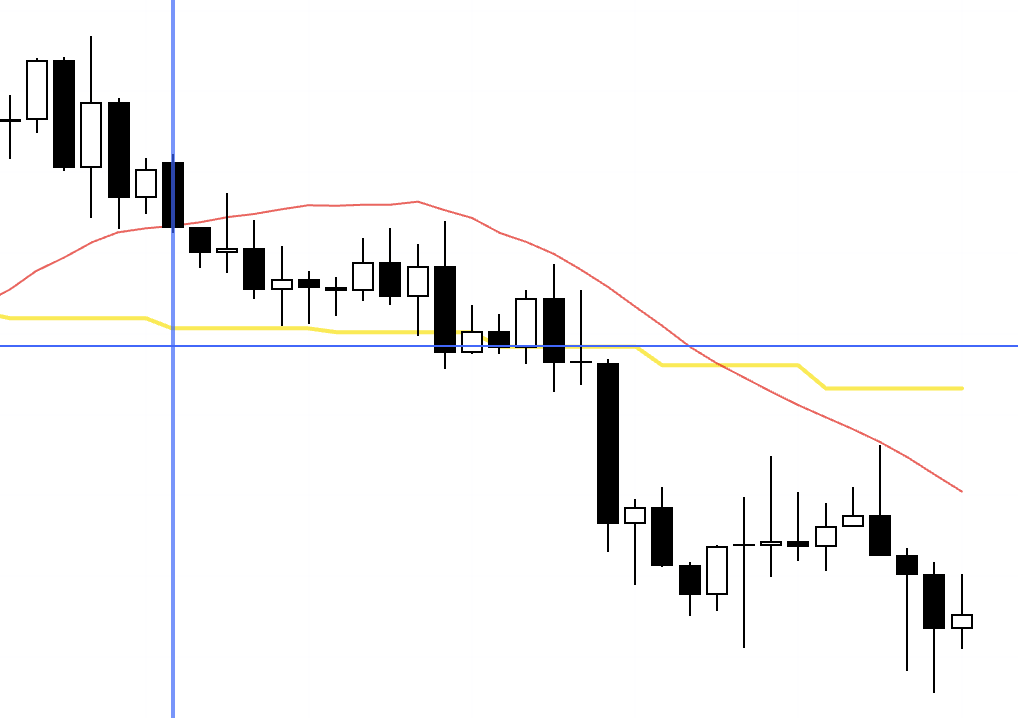
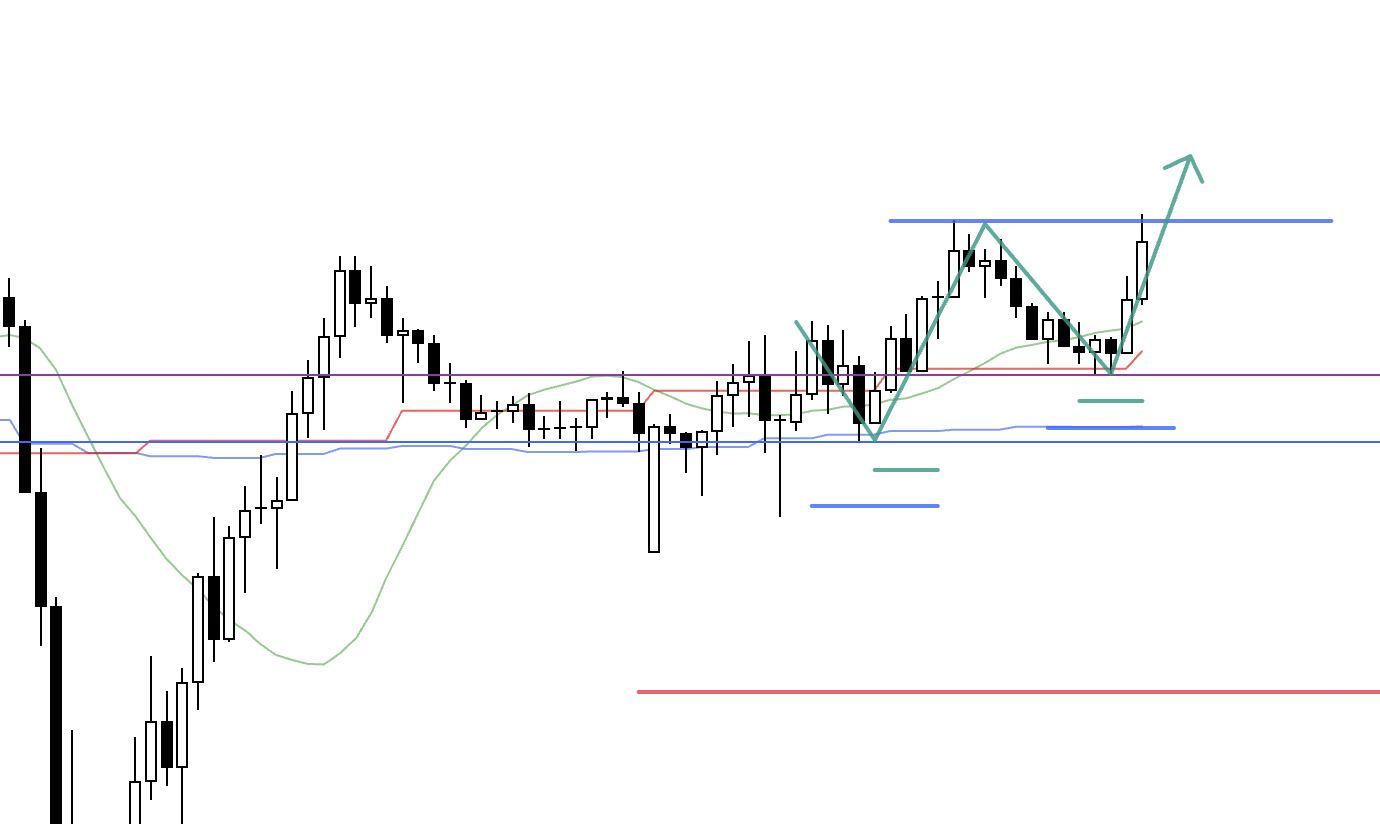
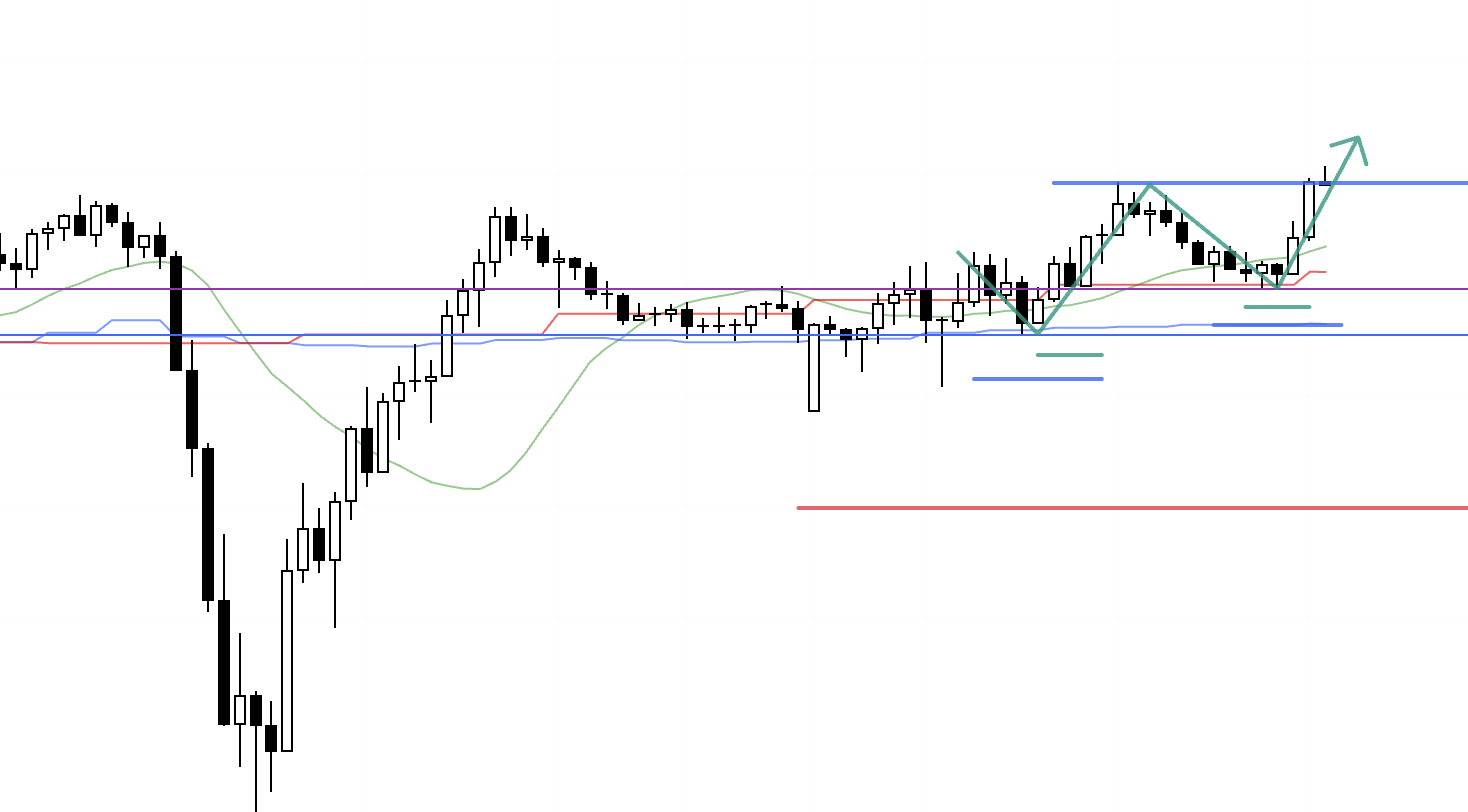
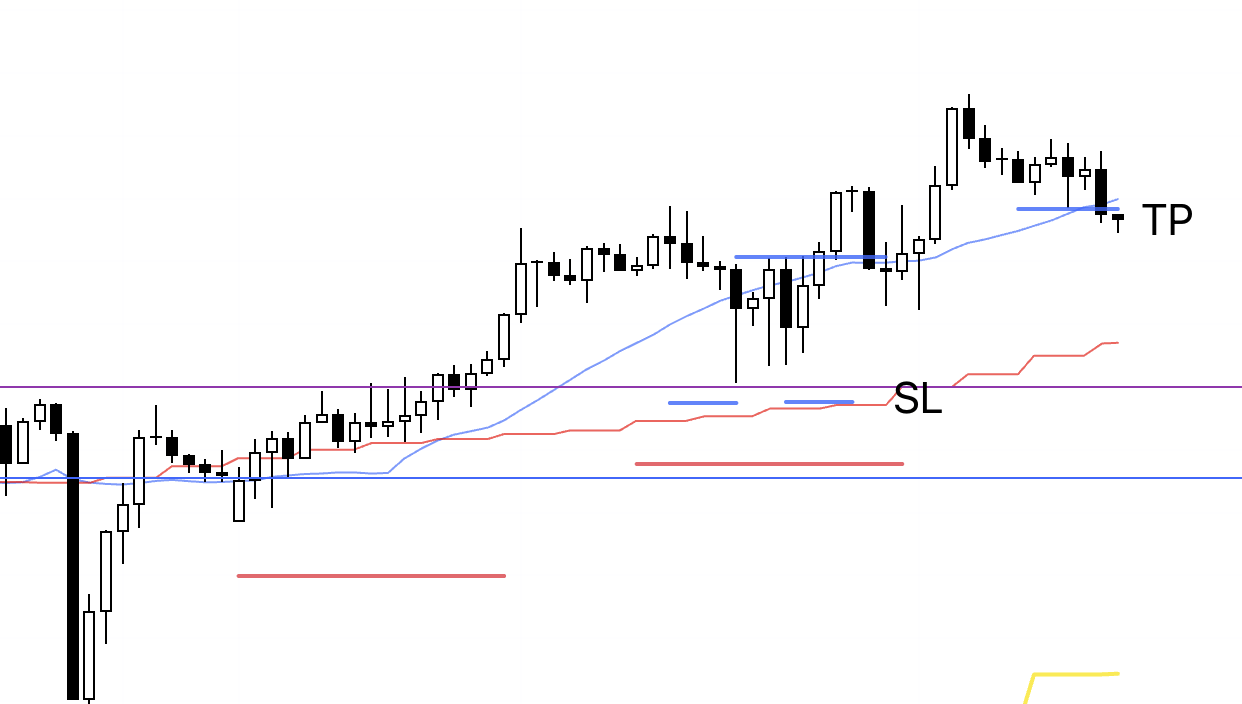
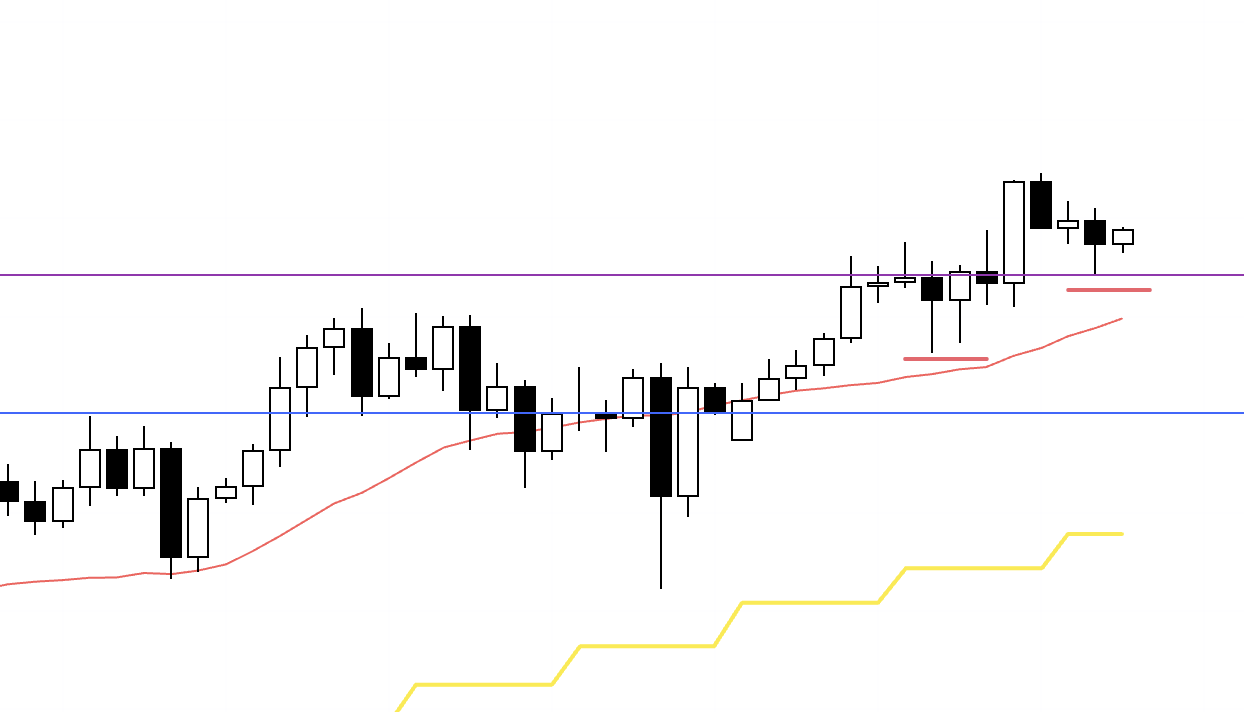
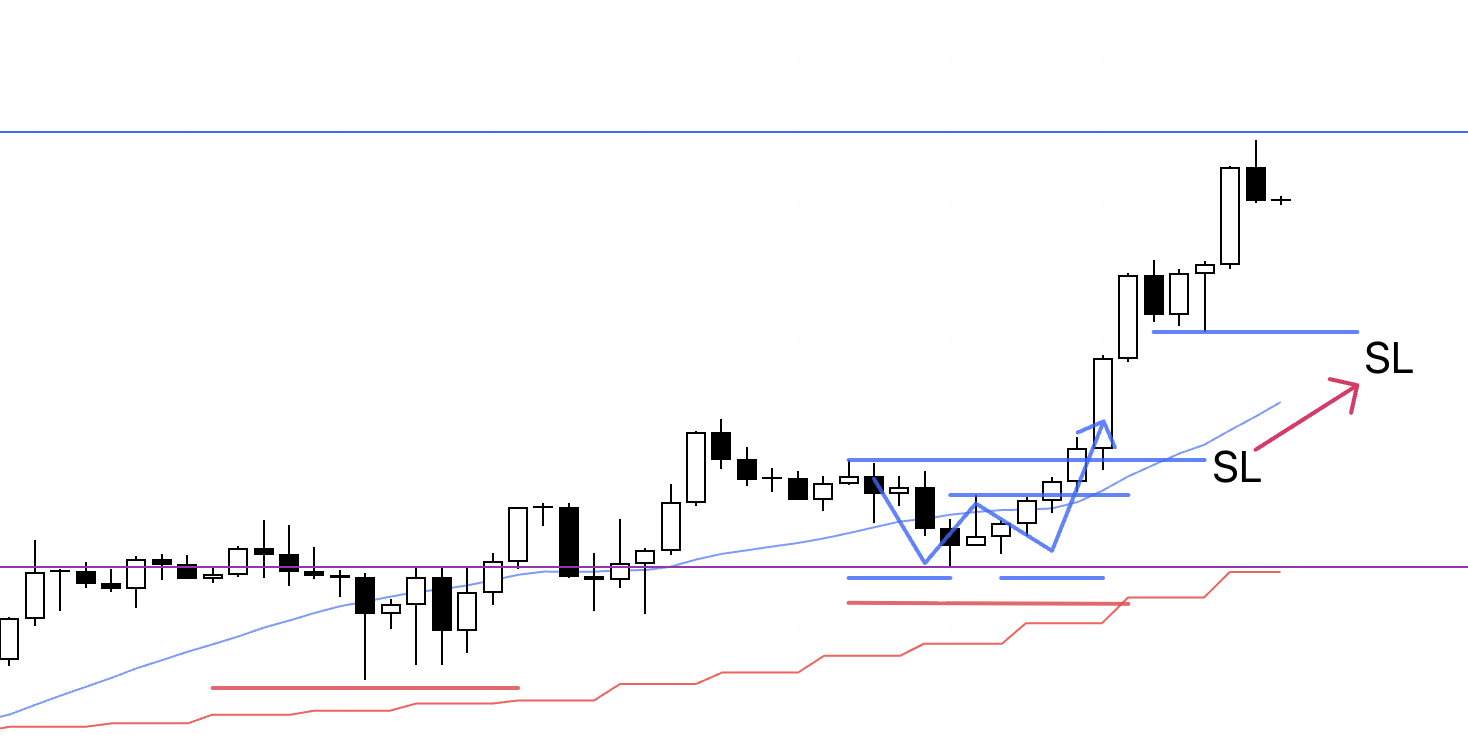
This is the 4h chart of EURUSD.
For EURUSD there were no tradable setups this week.
As I wrote in Sunday’s scenario, I could not sell immediately as long as price had not broken below the blue line, and even after it broke, there was no meaningful pullback that I could trade, so I stayed out.
On the long side, I was only willing to buy after price broke above the 4h moving average, and that did not occur this week, so there were no long opportunities either.
First, I will explain the entries I actually took this week, using the real-time records from those moments.
〜・〜・〜・〜・〜・〜・〜・
November 17 (Mon)
USDJPY
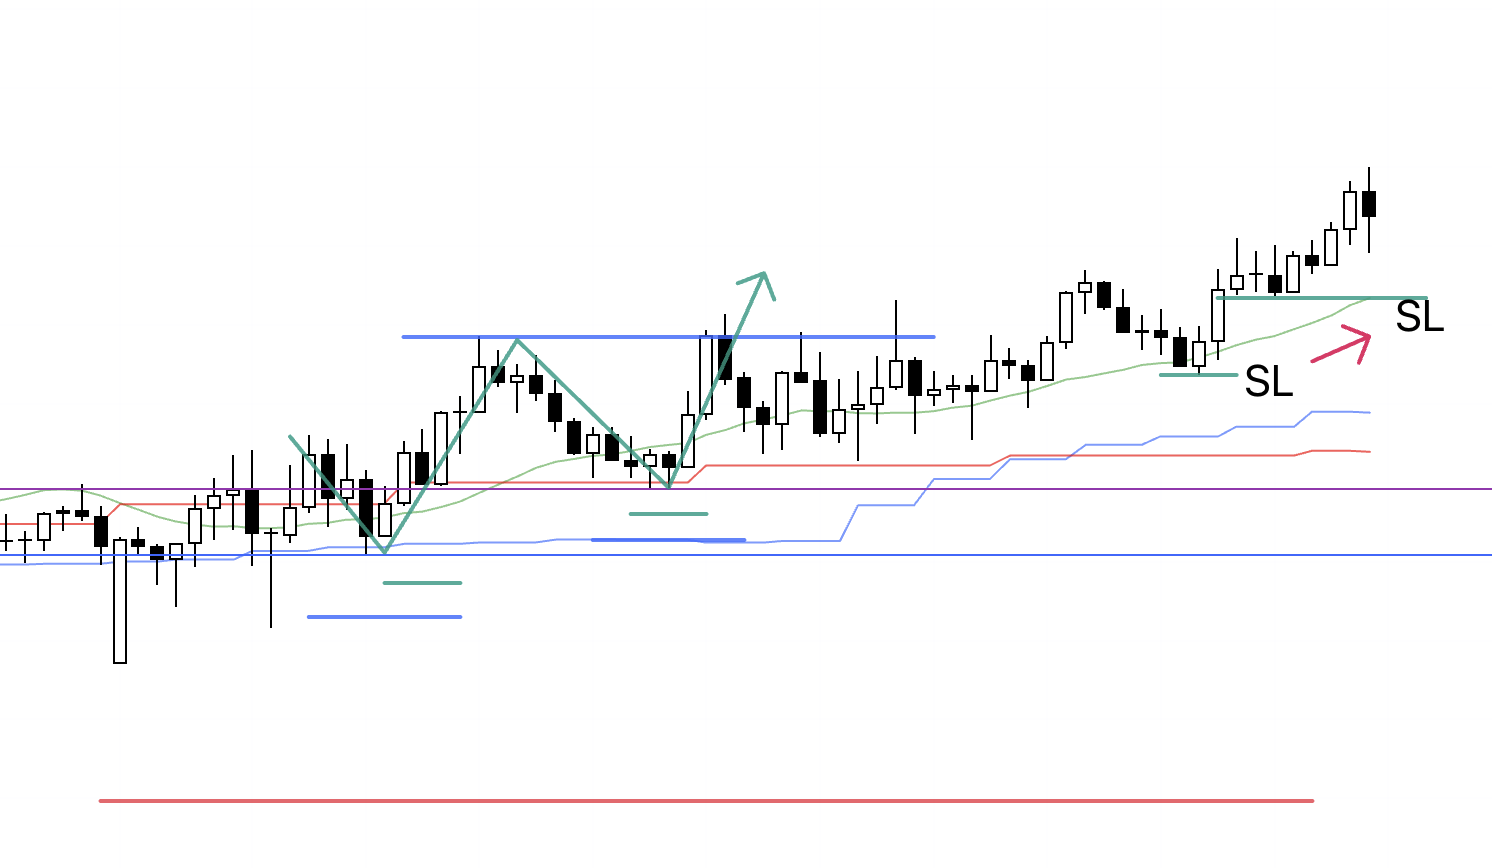
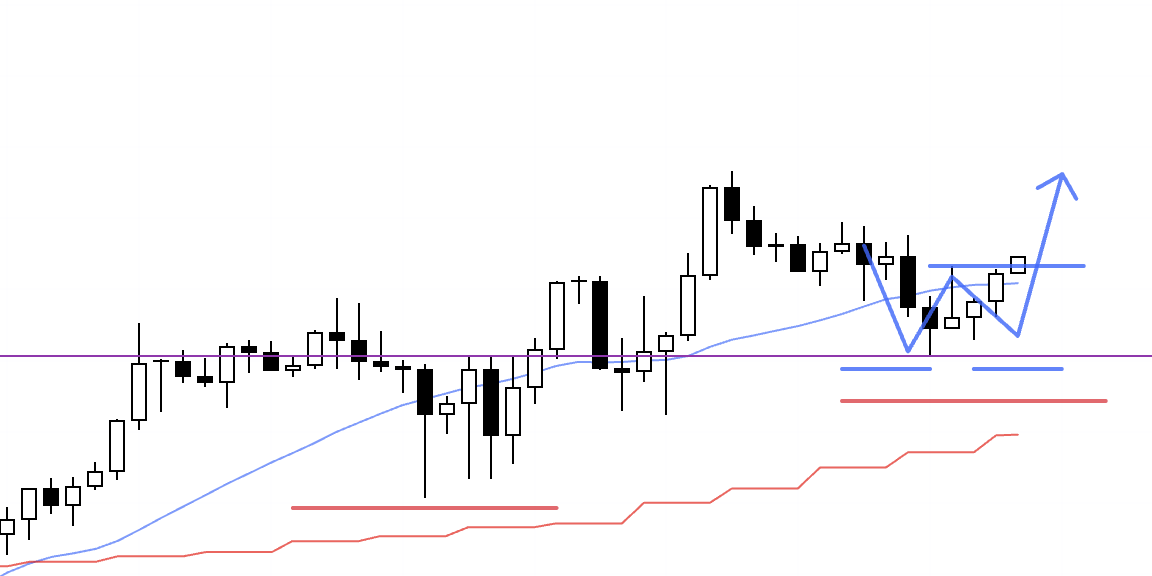
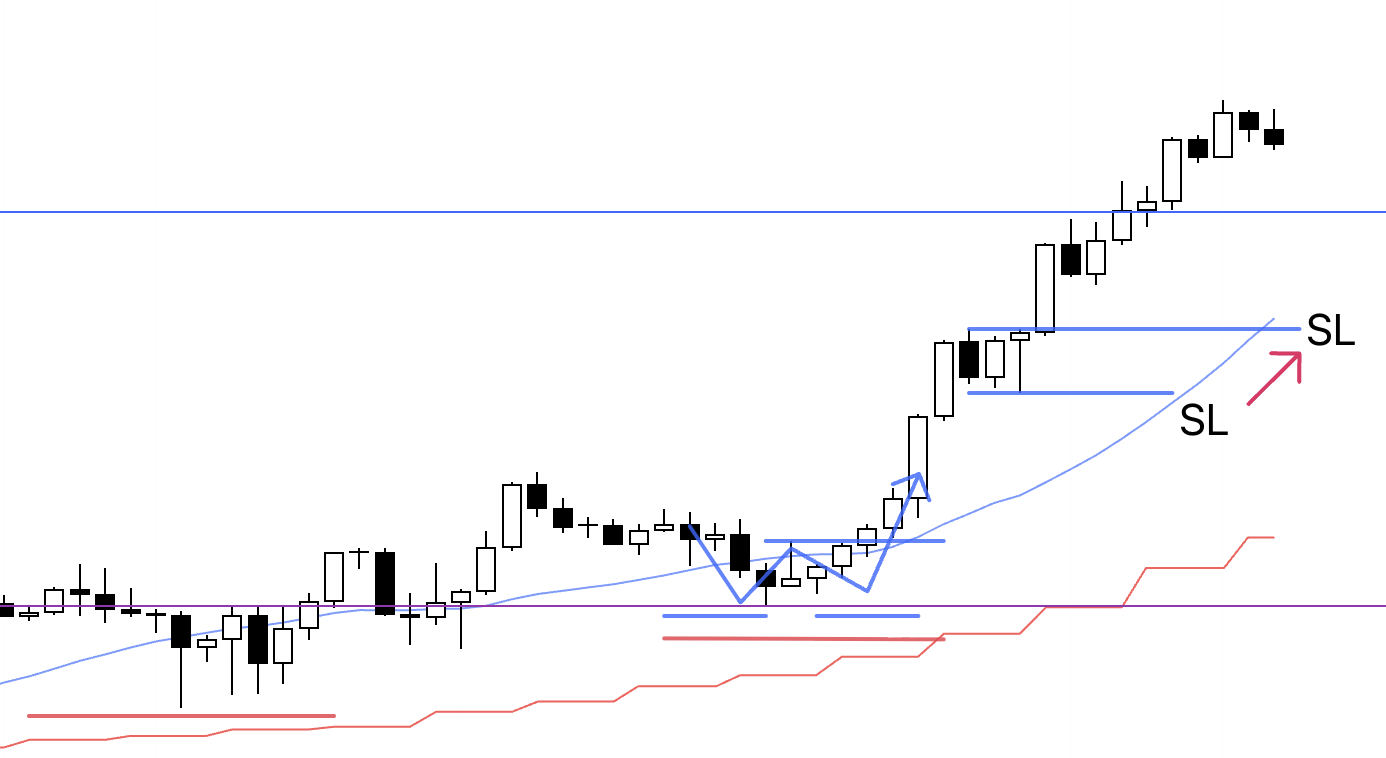
4h chart from Sunday’s scenario blog
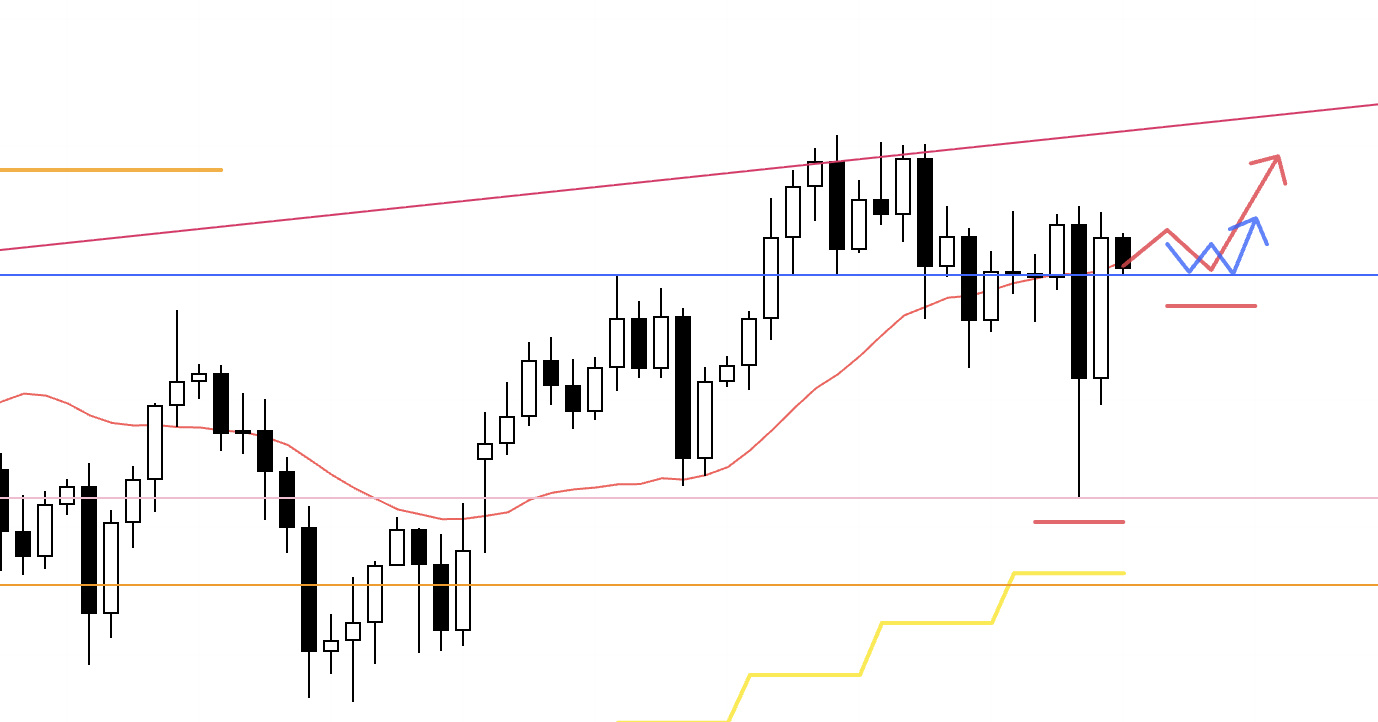
In Sunday’s long scenario, I was looking for a pattern where the lower timeframes would start forming higher lows and higher highs off this blue line as support, and if that happened I would enter long.
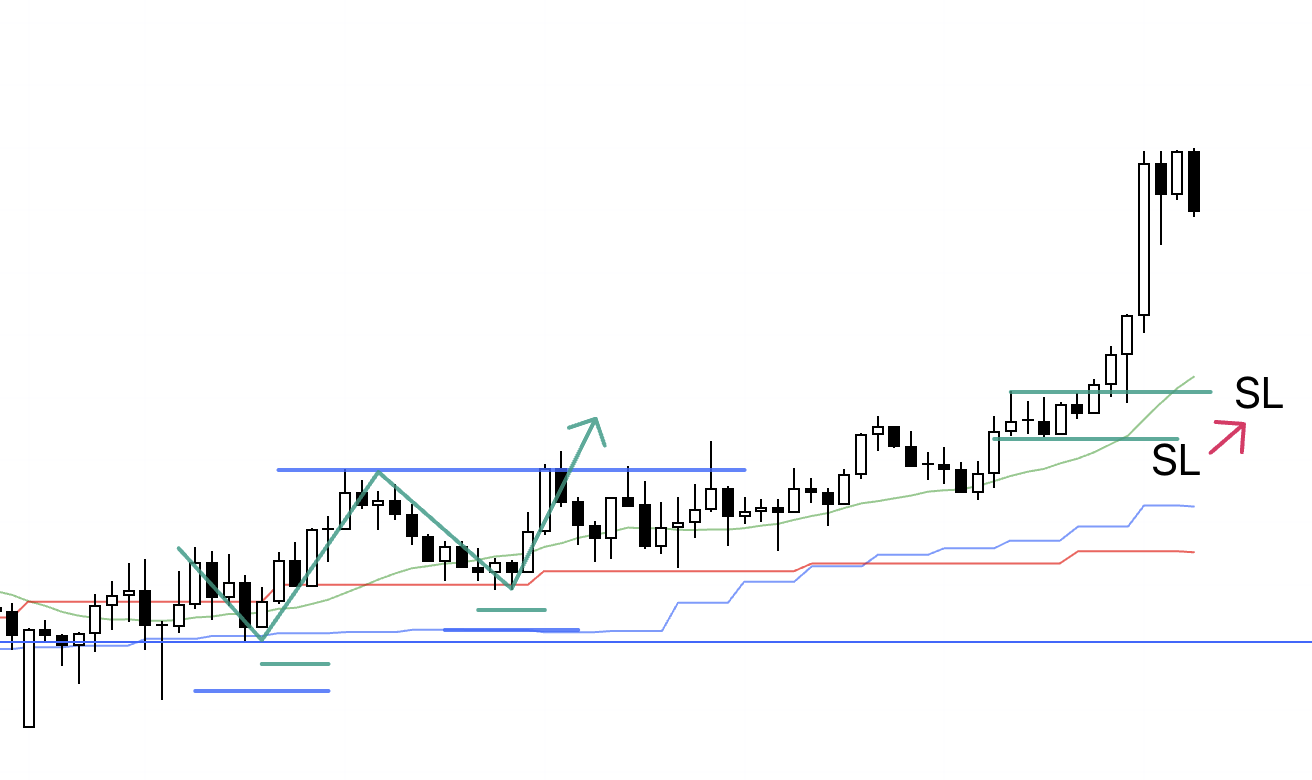
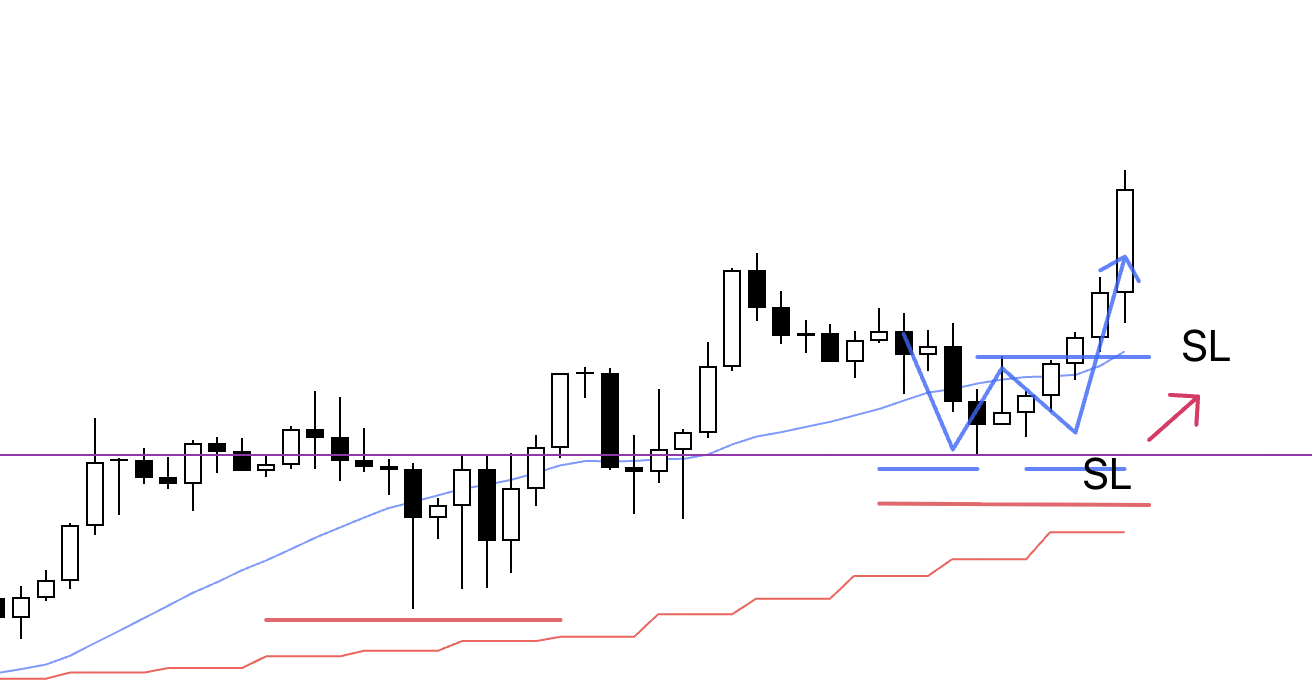
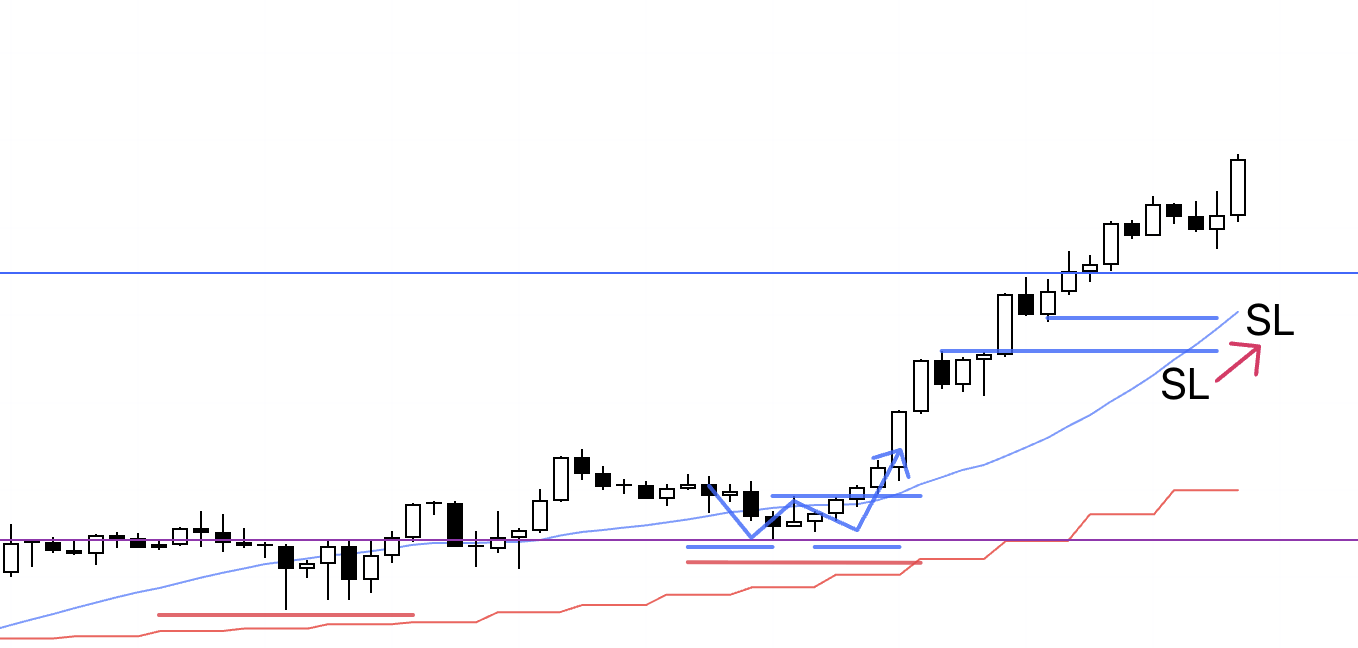
4h
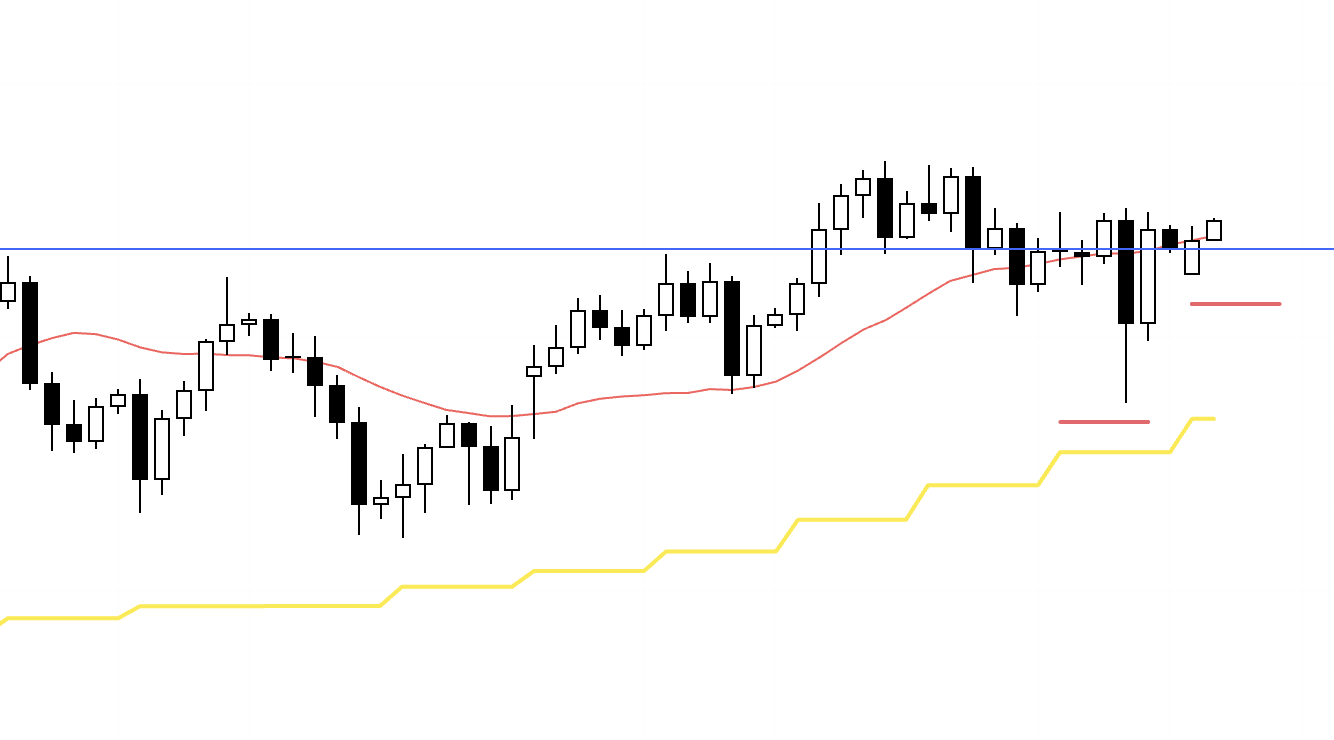
When the week opened, the actual chart started with a gap, so the 4h candles are straddling the blue line.
I want to drill down to the lower timeframes to see exactly how price is behaving around this blue line.
1h
On the 1h chart, you can see that the higher low is supported by the blue line and price is making a new high.
By placing the SL just below the blue line, I can participate in this move up, so this is a point I very much want to trade.
However, by the time I woke up and looked at the chart, the high had already been marginally broken, so I could not enter, and the structure of the higher low still looked a bit weak to me, so I decided to wait for the next low to form and then consider an entry.
1h
After that, a new low formed, so I placed a pending order.
If price breaks above this high, it will be a very high-probability point, and this time I absolutely have to take the trade.
15m
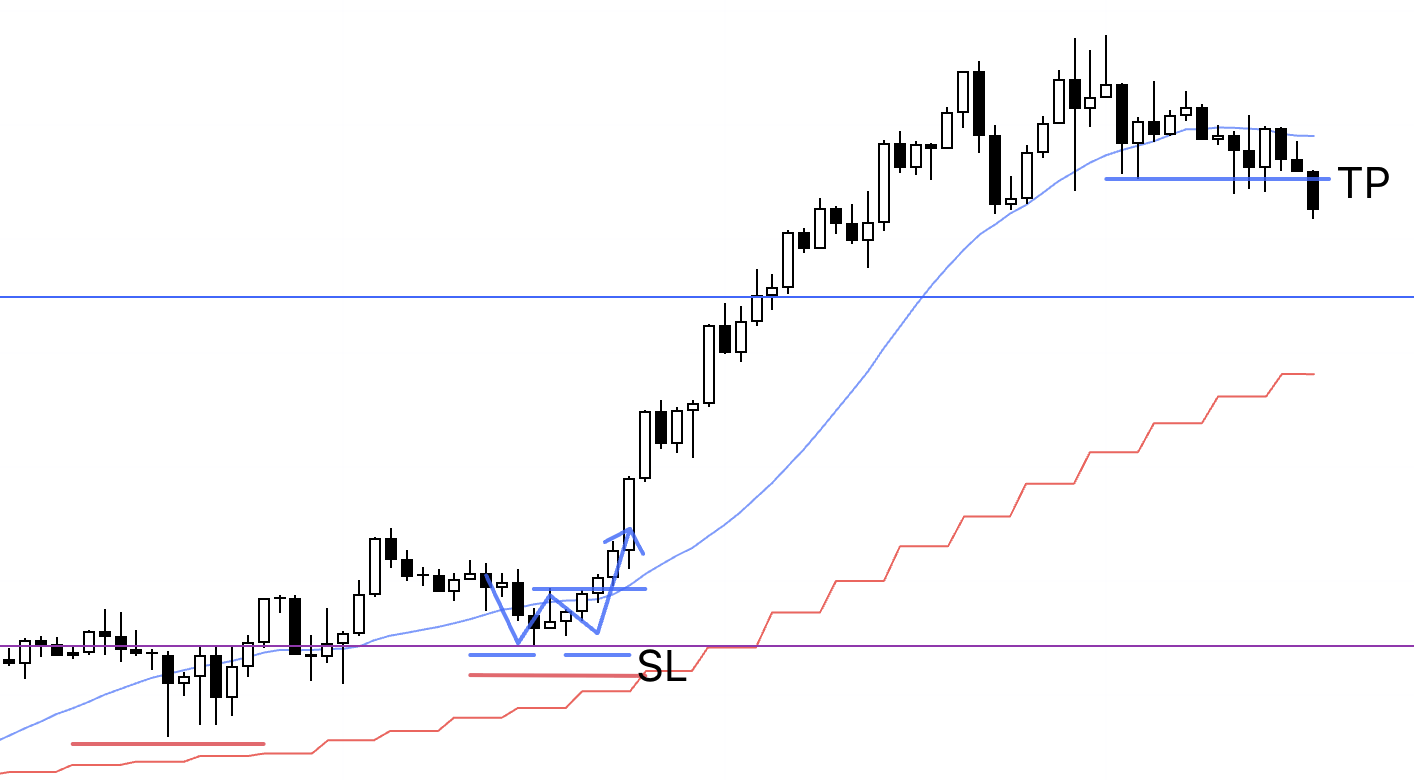
On the 15m chart, you can see that the first 1h low is supported by the blue line, and this new low is also clearly supported on the 15m chart where the previous resistance line has turned into support (the purple line).
If price holds this line and makes a new high, a clear edge appears on the long side, and I must enter.
Ideally, instead of breaking this high in one move, I would prefer to see another higher low form on the 15m or similar timeframe so I could tighten the stop and improve the risk–reward of the trade.
But it looks like price is about to push through the high as it is, so I have no choice but to enter here.
15m
The buy order has been triggered and I am in the position.
I will hold the trade until the 15m trend breaks down.
15m
I have moved the SL higher.
15m
I have moved the SL higher.
15m
I have moved the SL higher again.
15m
I have moved the SL higher again.
I am going to bed now.
15m
After waking up, I moved the SL higher.
15m
When I came back from going out, the trailing stop I had moved up had been hit, and this trade was over.
〜・〜・〜・〜・〜・〜・〜・
November 18 (Tue)
USDJPY
4h
A new higher low formed on the 4h chart, so I entered as a 4h pullback buy.
1h
As always, it is the same pattern.
Within the 4h higher low, the 1h also formed a higher low and broke to a new high, so I entered on the breakout.
By the way, this setup was not tradable on the 15m, so the trade is managed on the 1h.
1h
I have moved the SL higher.
1h
I have moved the SL higher.
1h
The trailing stop I had moved up was hit, and this trade ended.
〜・〜・〜・〜・〜・〜・〜・
November 19 (Wed)
USDJPY
4h
On the 4h chart, a new pullback formed, so I placed a buy order.
1h
What I am doing here is exactly the same as in the previous trade.
Within the 4h pullback, the lower timeframe, the 1h, is supported at the prior high (purple line), forming higher lows and breaking to new highs, so I enter at that point.
15m
On the 15m chart, there was an opportunity to enter slightly earlier, but neither of the 15m lows is actually supported, and since I want to place my SL below this purple line and ride the trend, I am choosing to take this trade on the 1h.
1h
The buy stop order has been triggered and I am now in the trade.
I will hold the position until the 1h trend breaks down.
1h
I have moved the SL higher.
1h
I have moved the SL higher.
1h
I have moved the SL higher and I am going to bed now.
1h
After waking up, I moved the SL higher.
1h
I have moved the SL higher again.
1h
I have moved the SL higher.
1h
I have moved the SL higher.
1h
I am going to bed now.
1h
After waking up, I moved the SL higher.
1h
The trailing stop I had moved up was hit, and this trade ended.
〜・〜・〜・〜・〜・〜・〜・
That is all.
This week in USDJPY, all I did was wait for pullbacks and repeat the same trades mechanically, without having to think very much, but what matters for a trader is simply, “If the scenario and rules say so, then follow them.”
It is not good to think “It probably won’t go up much more” and skip a long signal, or to decide “This must be the top” and place a discretionary countertrend short based on your own prediction.
When a pullback forms on the 4h chart, the higher low inside that pullback is supported at a support line, and within that swing the lower timeframe makes a higher low and a higher high, I have no choice but to buy.
Even if that particular trade ends in a loss, I fully understand that repeatedly taking that setup will grow the account, so I feel no fear or hesitation about any single trade.
In trading, simply knowing the method is not enough to succeed.
You must be able to keep applying that method in a simple, consistent way no matter what happens, and it is precisely in that simple repetition that a trader’s real skill resides.
Drawing scenarios on a chart where you cannot see the outcome, spotting signals in a chart where you cannot see the outcome, and executing every signal that appears without omission—these are extremely advanced skills.
To do this, you will be tested on how thoroughly you prepared in advance and how much testing and practice you have accumulated.
That large body of experience is what builds your confidence and makes that simple repetition possible.
My trading is extremely simple and is built only on the basics of Dow Theory, the rules of Granville, and multi-timeframe analysis.
These are all things that beginners can learn from basic trading books.
However, almost no one drills them into themselves to the point of being usable at a practical level, and many traders believe there must be some “secret” strategy out there and keep searching for it.
Most traders simply have not refined and elevated the “basics” to a level where they can truly use them.
Take what you have learned and turn it into hypotheses, convert those hypotheses into rules, and test them on a large sample size.
From there, form new hypotheses, adjust them, and keep testing.
Once you have confirmed an edge on a large sample size, practice relentlessly until you can truly make use of it.
You need to build experience by repeatedly, with your own hands, spotting and executing signals on charts whose results you do not know, and by letting the law of large numbers play out over a large number of trades.
Merely knowing the data is not enough, and even a strategy someone else has proven will not automatically produce profits for you.
In the end, unless you yourself have used it many times, it is meaningless.
This takes a great deal of time.
But it is time you must invest.
I hope this blog can serve as a hint for those who are about to build their own strategy, and for those who are struggling to achieve consistency.