

In this report I will review the key points of my trading this week, focusing on the actual trades I took.
This Weekly Trade Report is published every Saturday.
When you read it together with Trade Scenarios, which I post every Sunday, I believe it will give you a useful reference for how I think in advance and how I actually execute trades based on those scenarios.
This is not advice saying “you should trade like this,” nor am I claiming that this is the correct answer.
It is not about showcasing individual winning or losing trades, nor is it about recommending a specific strategy based on those results.
My purpose is to show, at a practical level, how I repeatedly follow a consistent process based on pre-defined scenarios, and to offer that as a reference for your own strategy building and for achieving consistency in your process.
The outcomes I show are nothing more than my personal results, and they do not guarantee your future profits.
Please keep that firmly in mind, and when it comes to your own trading, make sure you carry out your own testing and preparation, and trade entirely under your own responsibility.
My trading is based on buying pullbacks and selling rallies on the 4h timeframe.
If you are interested in my pullback and rally strategy, please read my past blog posts on Dow Theory and multi-timeframe analysis.
Now, please take a look at the following charts.
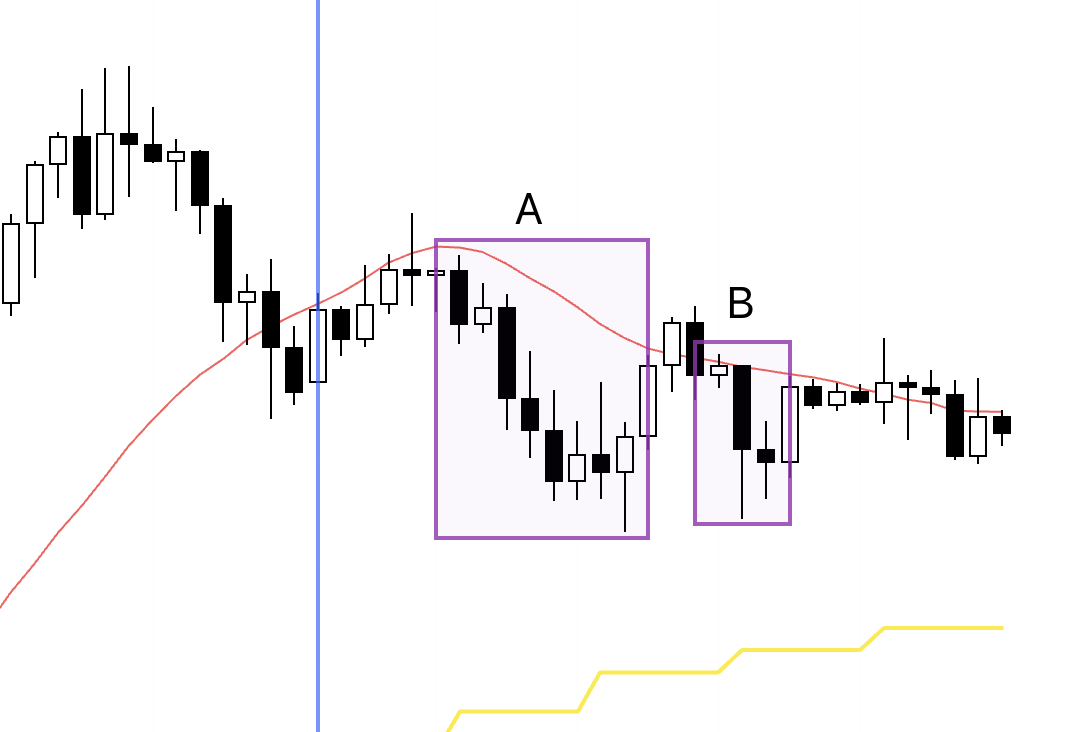
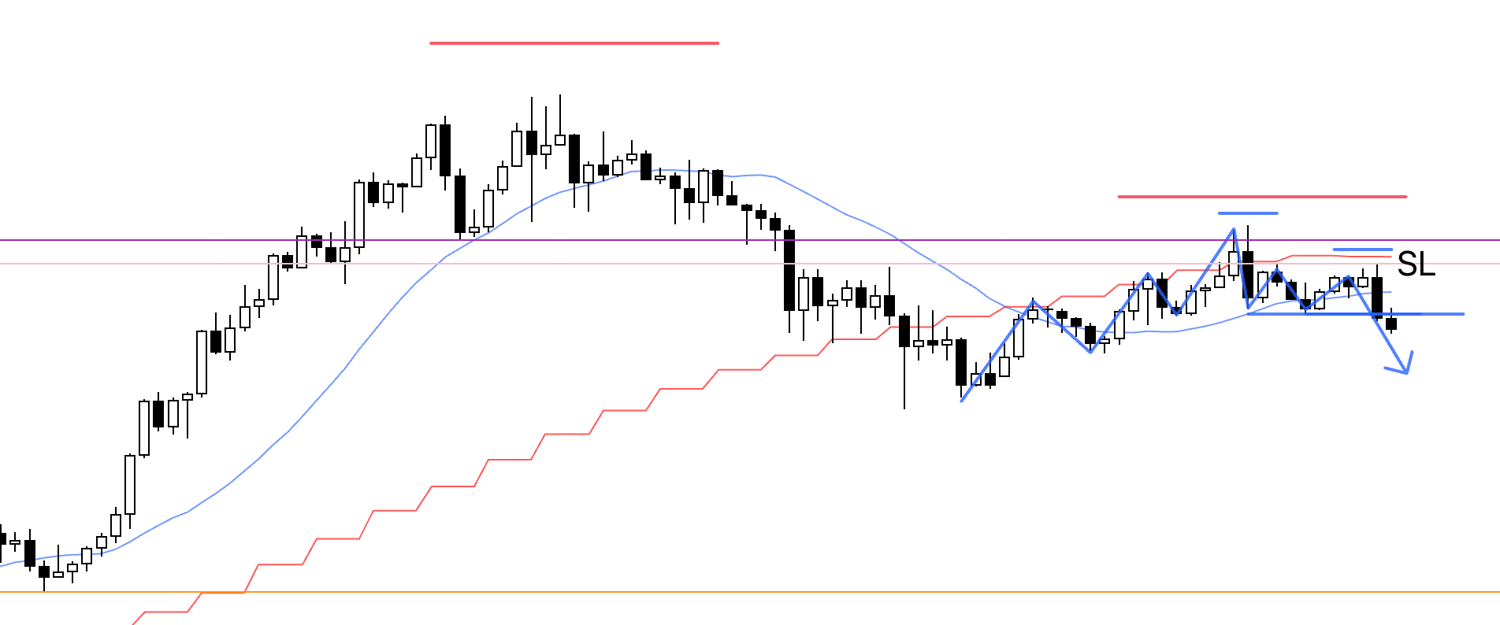
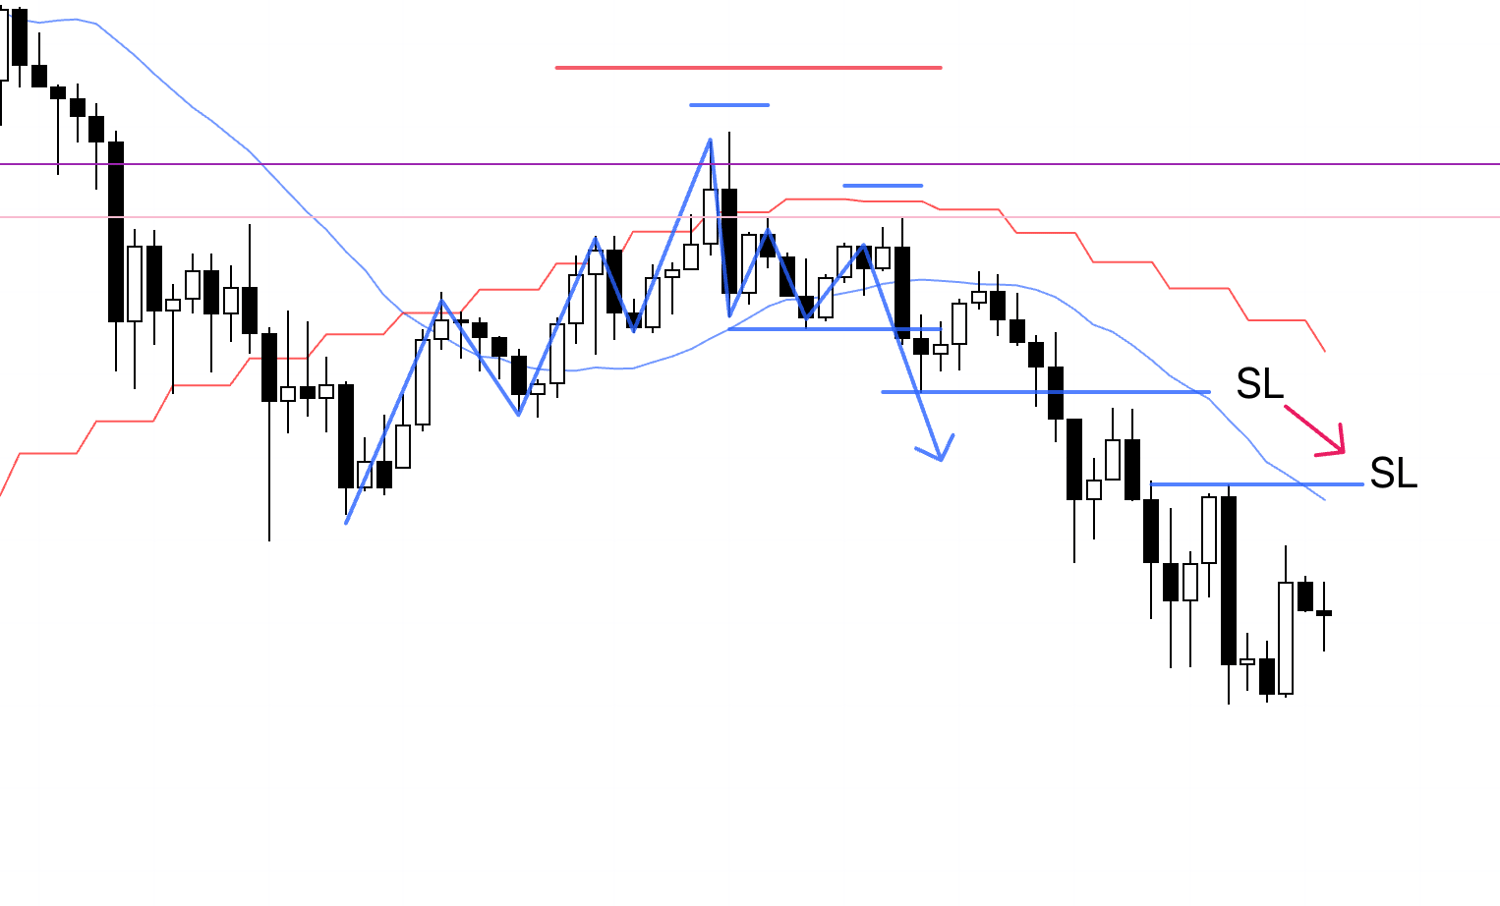
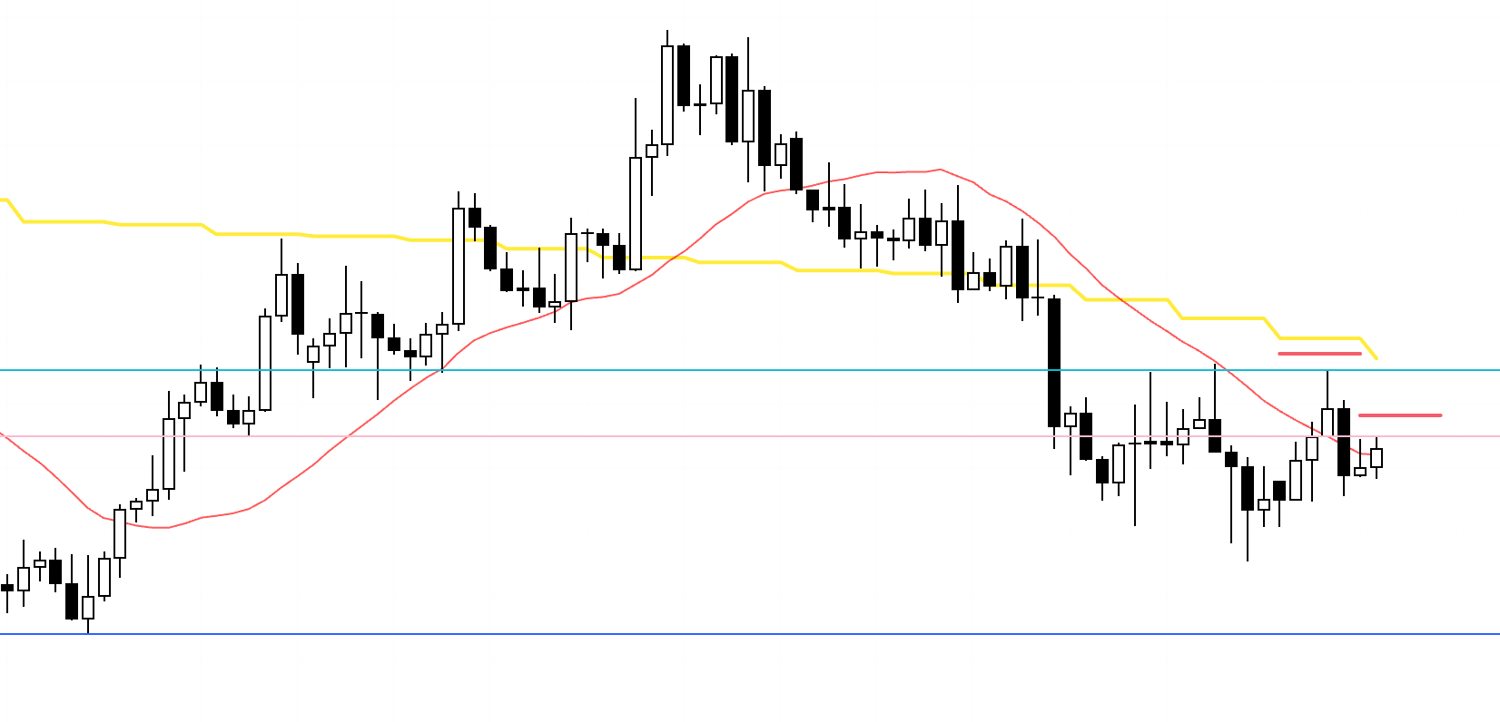
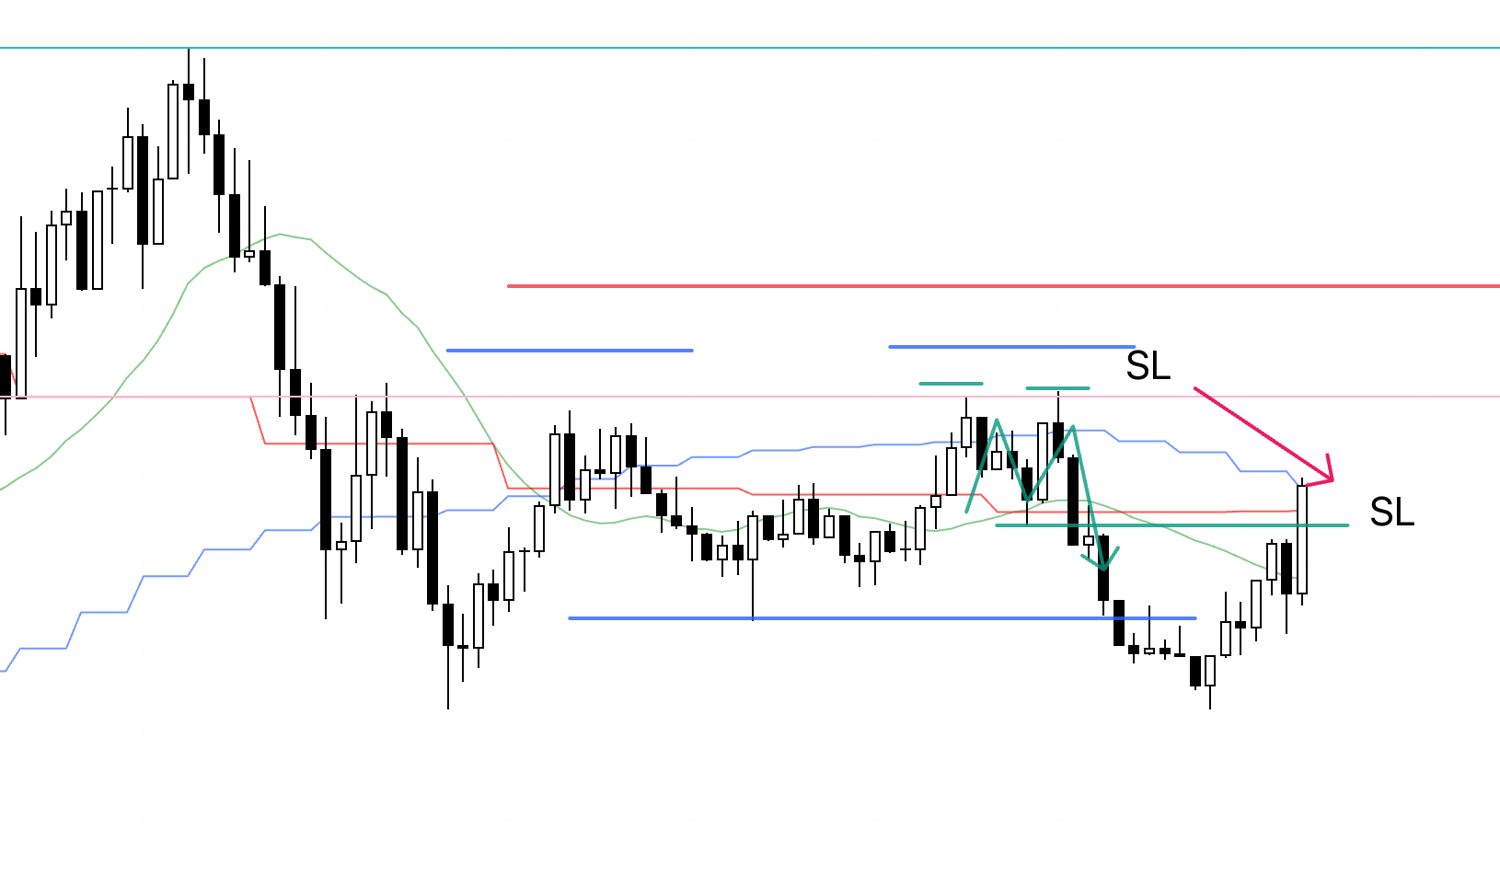
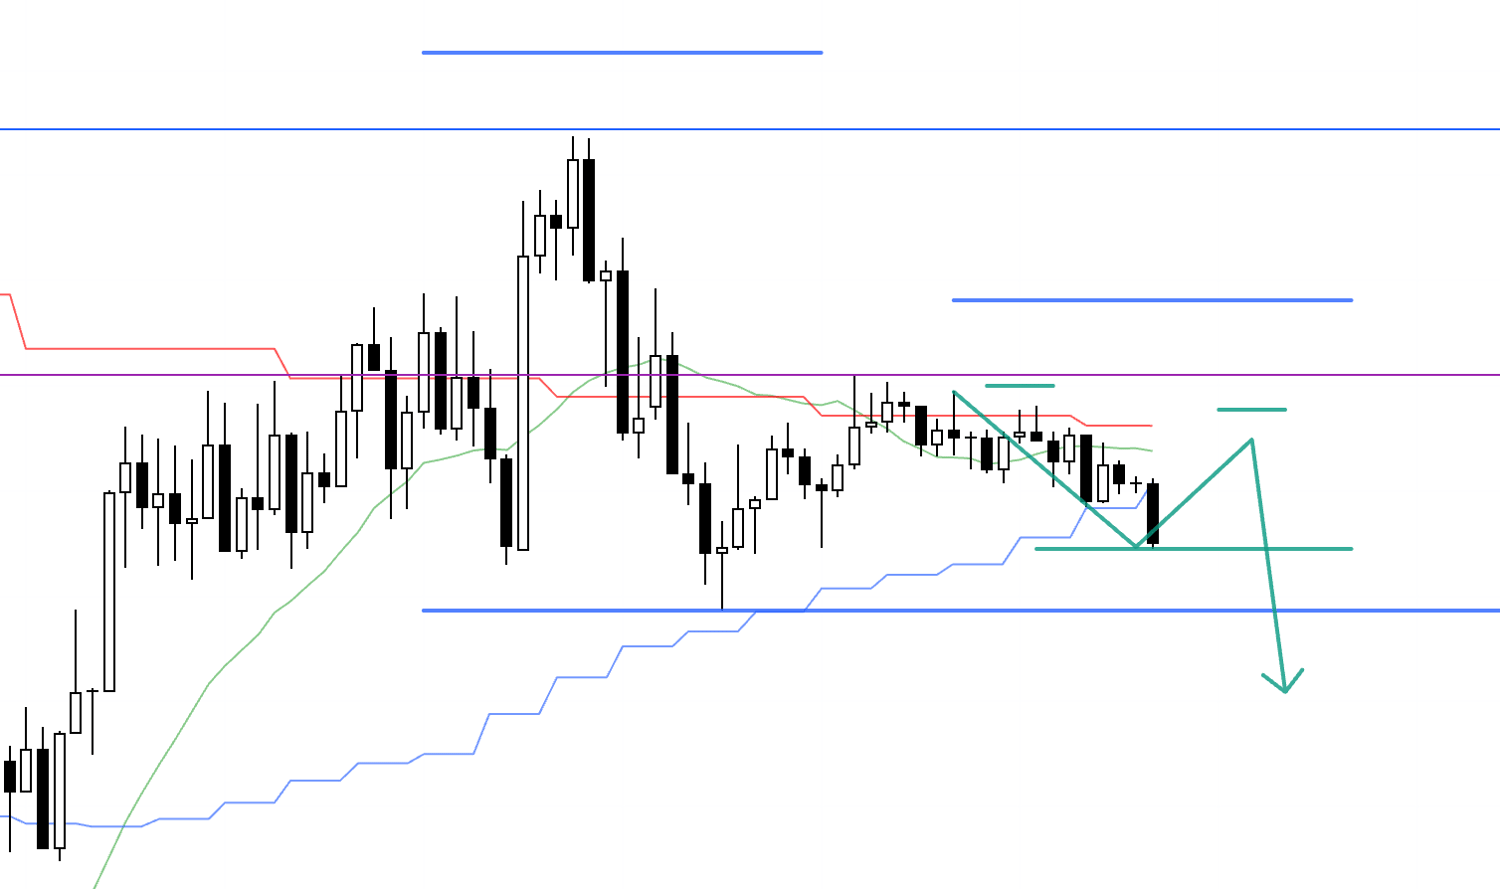
USDJPY 4h

This is the USDJPY 4h chart.
This week's price action is everything to the right of the blue vertical line on the chart.
On USDJPY this week, I traded at the two points marked by the rectangles.
For those two trades, I took screenshots in real time and wrote down what I was thinking at the time, so I'll show those later.
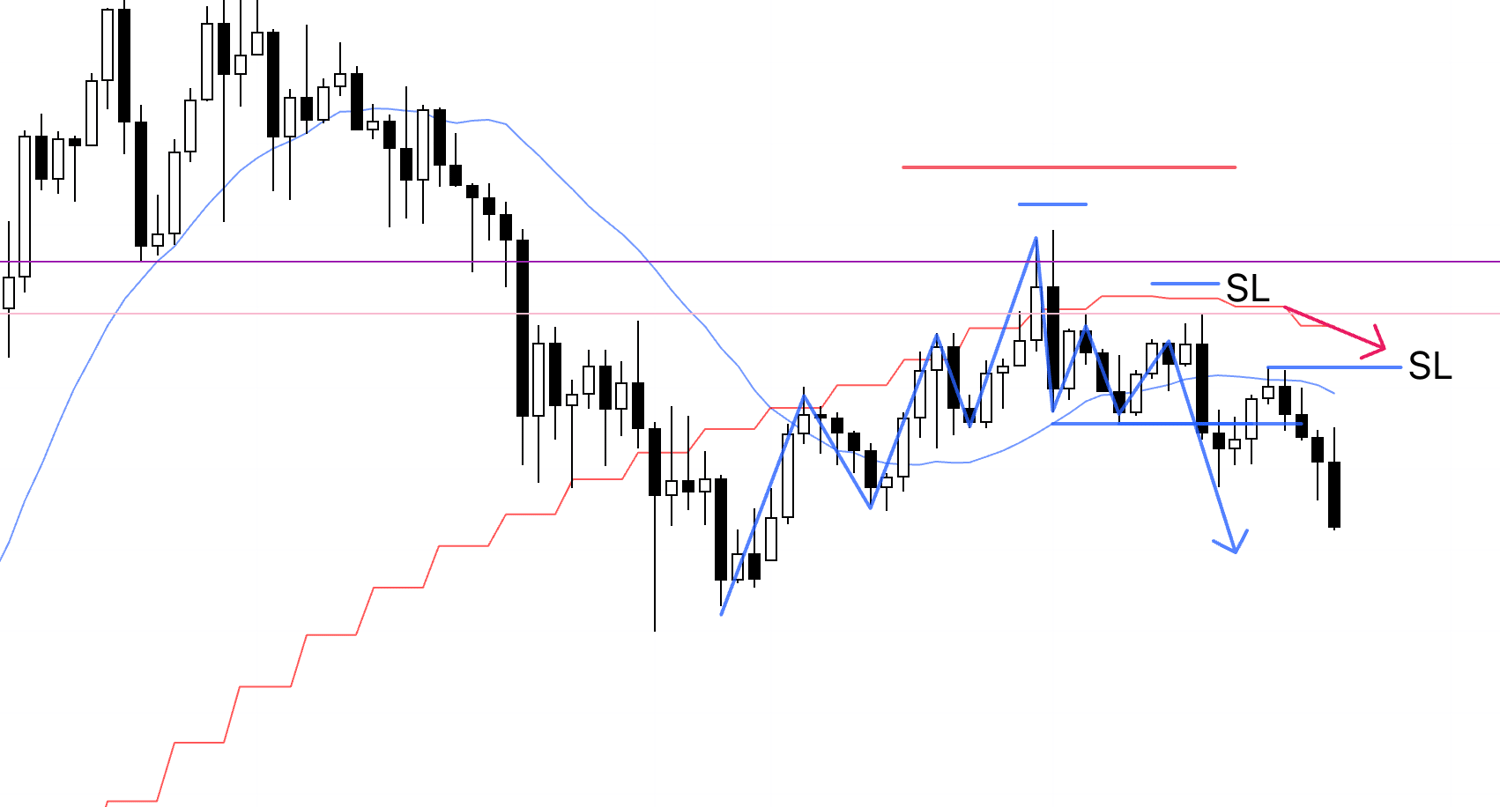
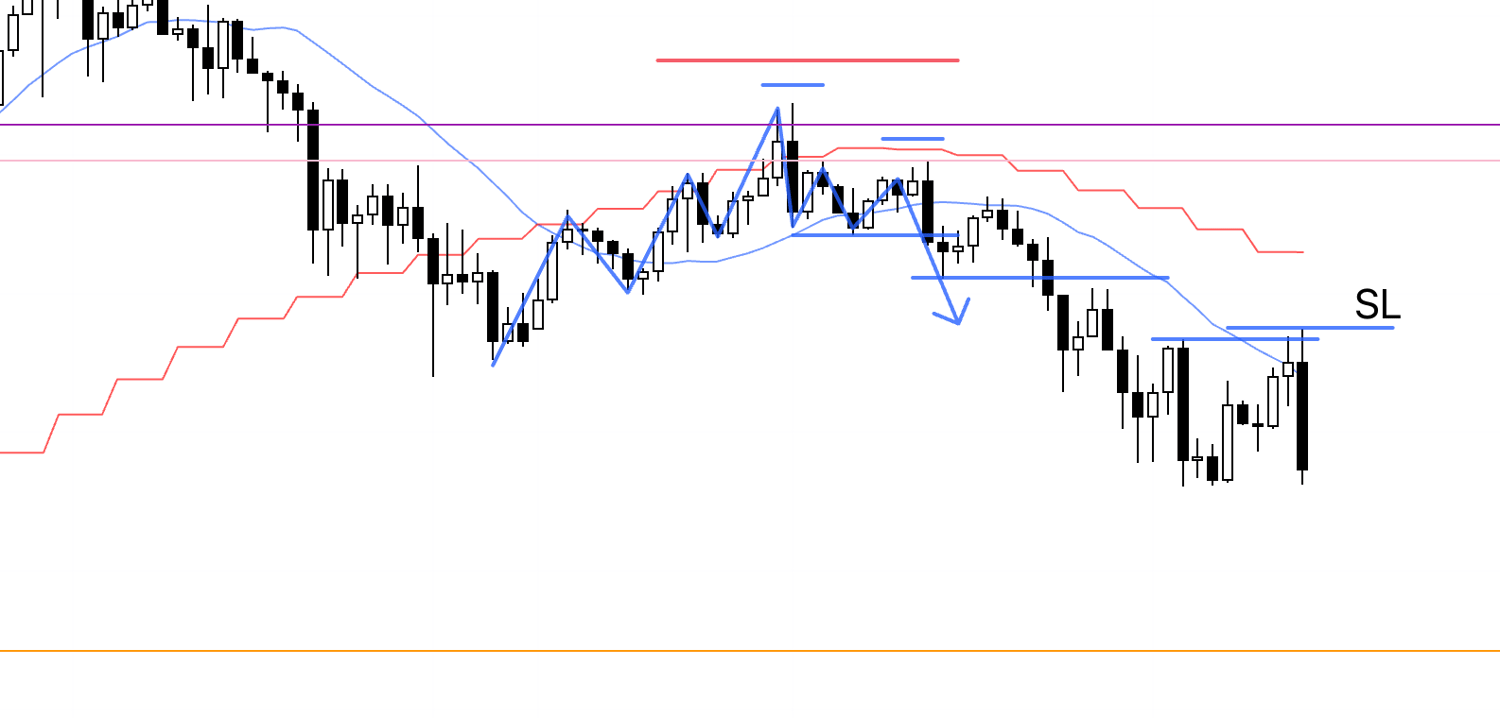
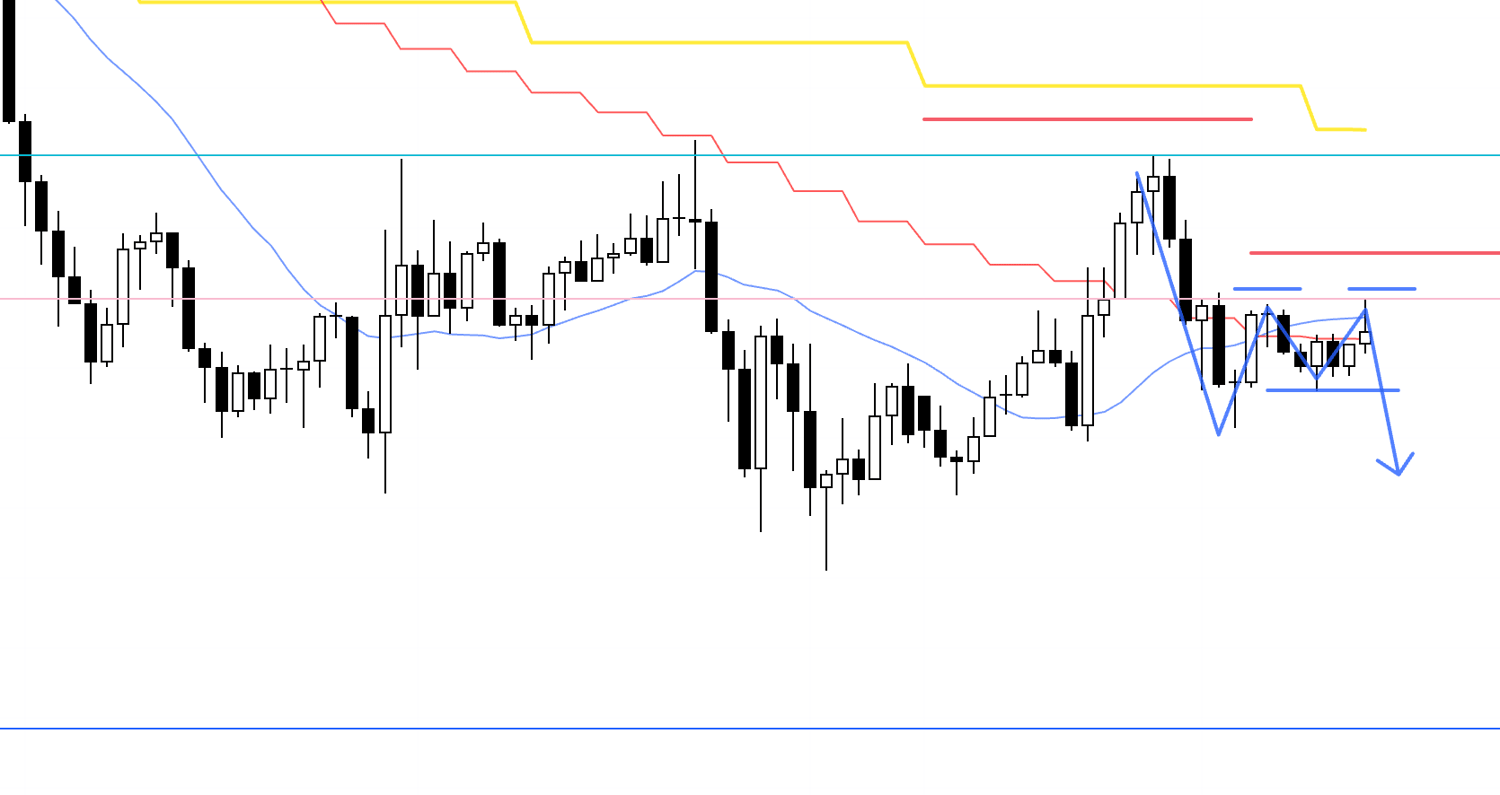
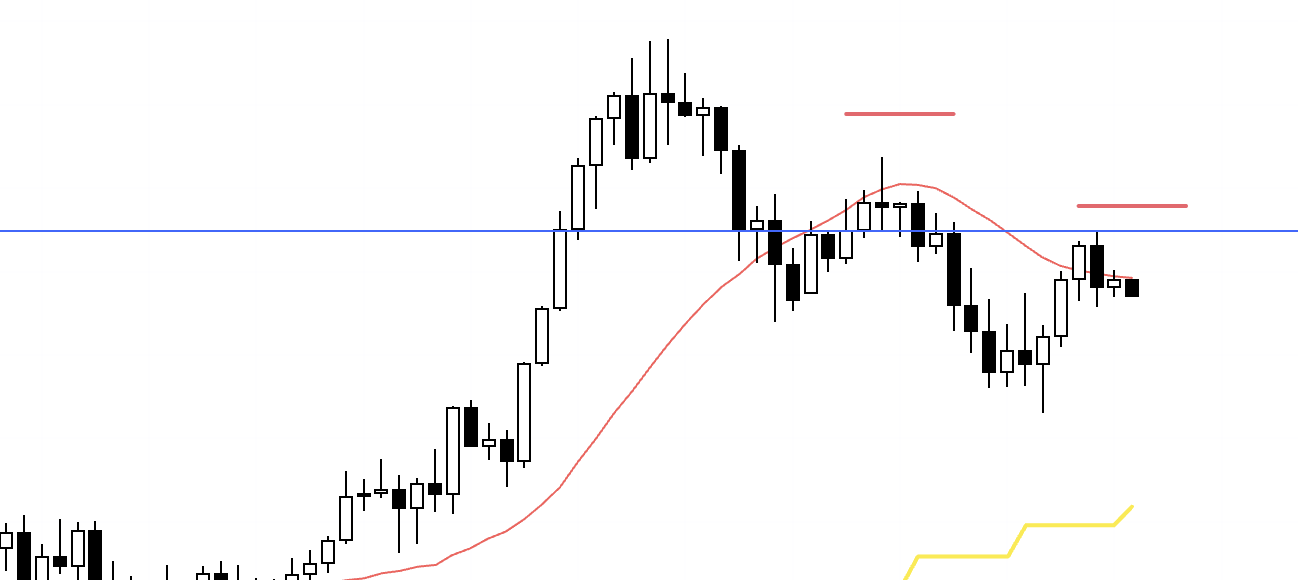
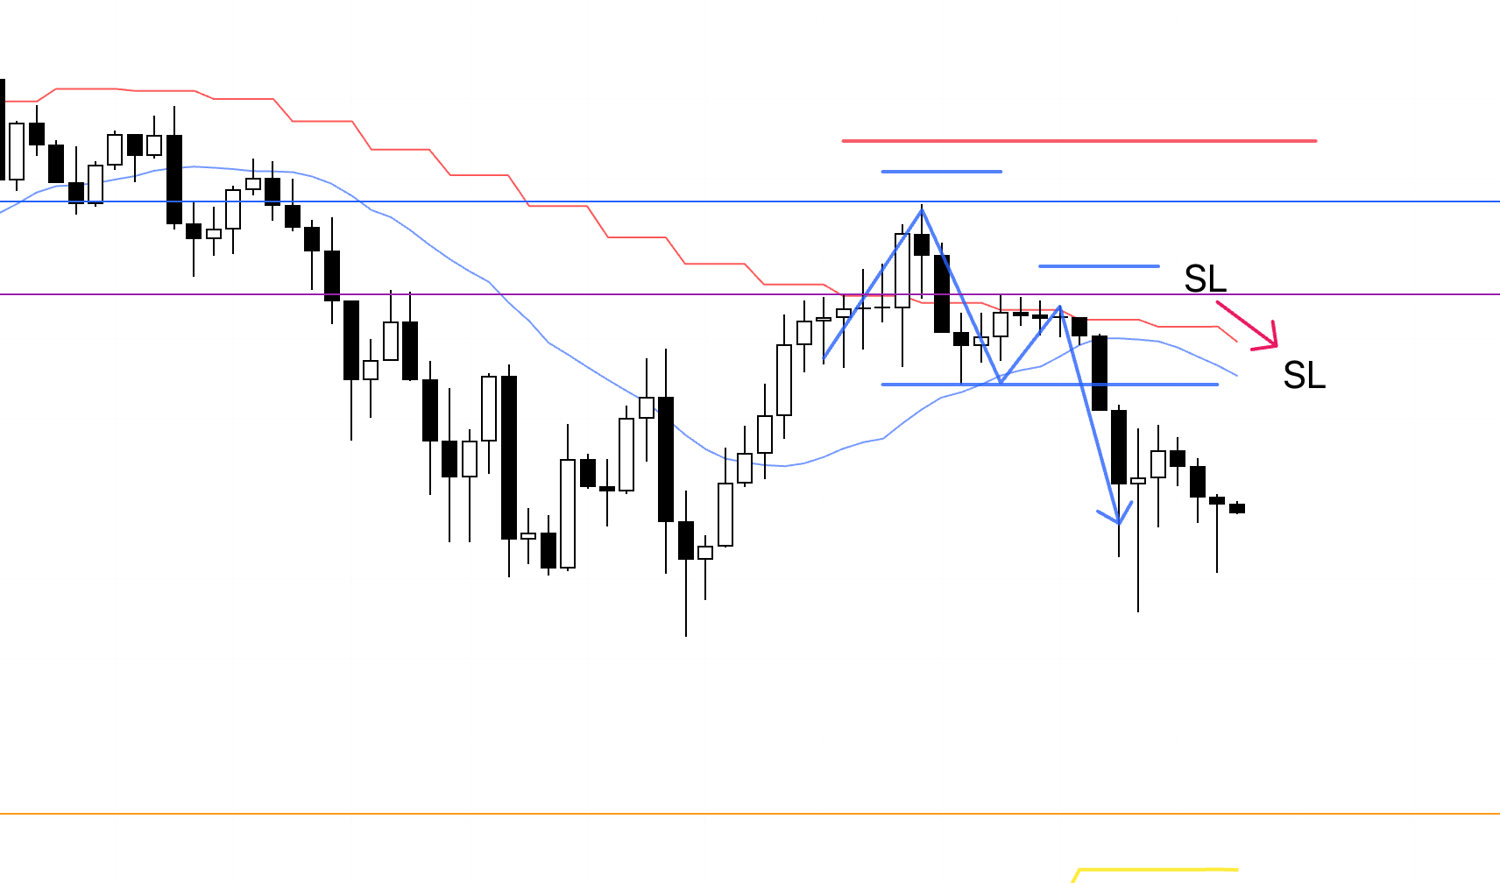
Next, please look at the EURUSD chart below.
EURUSD 4h
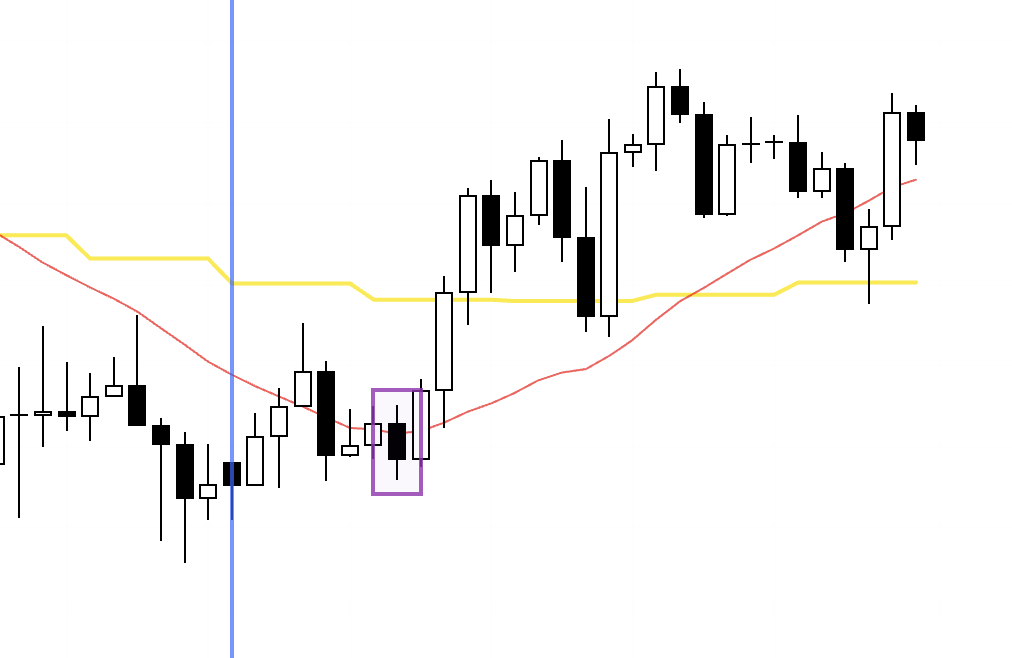
This is the EURUSD 4h chart.
On EURUSD, I only took one trade this week, at this single point.
I'll go through this one as well in a moment.
So below I'll walk through the trades I took this week, using the real‑time records from each moment.
〜・〜・〜・〜・〜・〜・〜・
November 25 (Tue)
USDJPY
4h
Price has just started to form a lower high on 4h, being capped by the 4h moving average as well, so I'm going to go with this downside move as part of the daily pullback formation.
1h
On 1h, the short‑term uptrend has ended like this, and price is just starting to turn into a downtrend.
Just as I wrote in Sunday's scenario blog, when a prior 1h downtrend ends once, then a short‑term uptrend forms and creates a new 4h lower high, the very first leg of the new 1h downtrend that follows is a 4h pullback‑sell point that you absolutely must not miss.
If price now goes on to break the low, that move becomes the initial leg of a 1h downtrend occurring at a 4h lower‑high point, which creates an edge on the short side, so I need to get in short.
1h
At this point, on 15m price broke the low in one shot without forming a lower high, so there was no 15m setup for me, and I'm planning to hold this on the 1h until the trend breaks.
And as we saw in Sunday's scenario blog, this drop is a down move forming a pullback on the daily, so the deeper it falls, the stronger the pullback‑buying pressure will get.
So once price reaches the area around the orange line below, I'm planning to lock in profit on half the position.
1h
I've moved my SL down a bit.
1h
I've moved my SL down a bit.
1h
I've moved my SL down.
I'm going to sleep now.
1h
After waking up, I've moved my SL down.
1h
It looks like price slightly broke above the high where I had placed my SL, but fortunately it missed my SL by a hair and then printed a bearish candle.
So I've adjusted my SL slightly to the new swing high.
People often ask me in situations like this, "Did your SL really not get hit on just that tiny break of the high?", so let me note this here.
I always place my entry orders and SLs a little away from the exact high or low.
The lines I draw on the chart are drawn directly from the highs so that readers can clearly see "which high I'm looking at".
In reality, though, I don't place my orders exactly on those lines, but a little away from them.
As for how far away I actually place them, I posted a video a while ago where I recorded my trading on X, so if you watch that you'll probably get a feel for it.
(Recording for a long time is tough, so I only did it a few times and then stopped.)
I'll leave the link here just in case, so check it out if you're interested.
1h
Price hit the trailing stop I had been moving down, and that was the end of this trade.
〜・〜・〜・〜・〜・〜・〜・
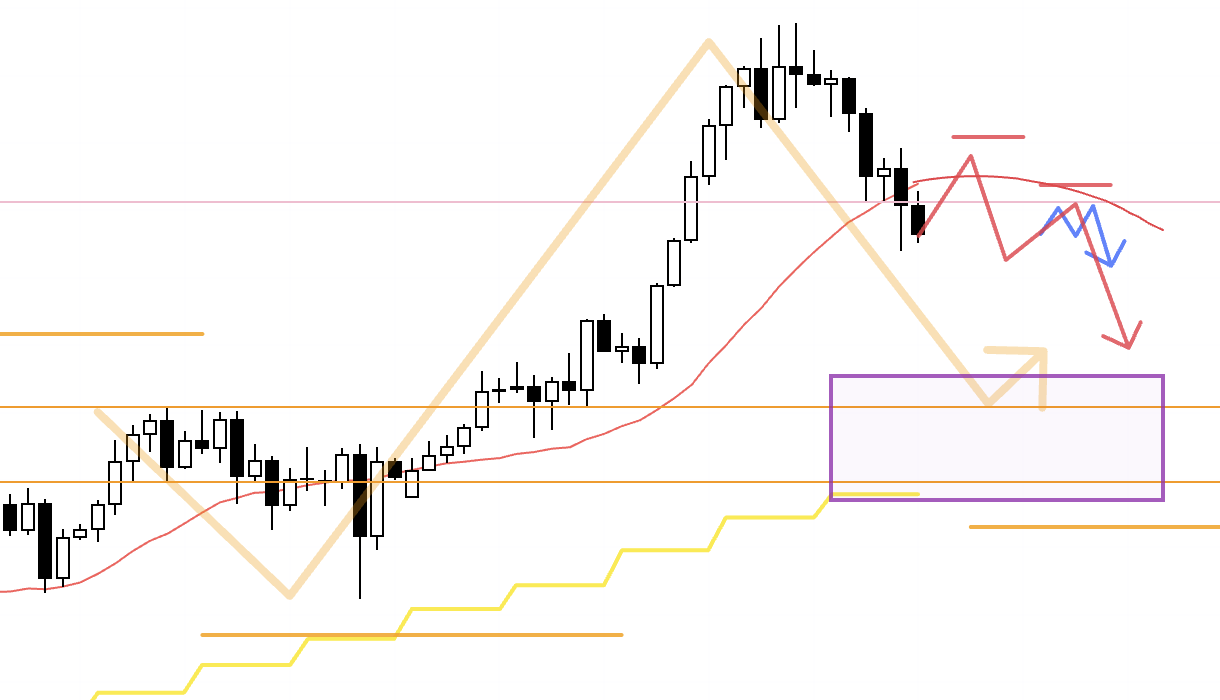
November 24 (Tue)
EURUSD
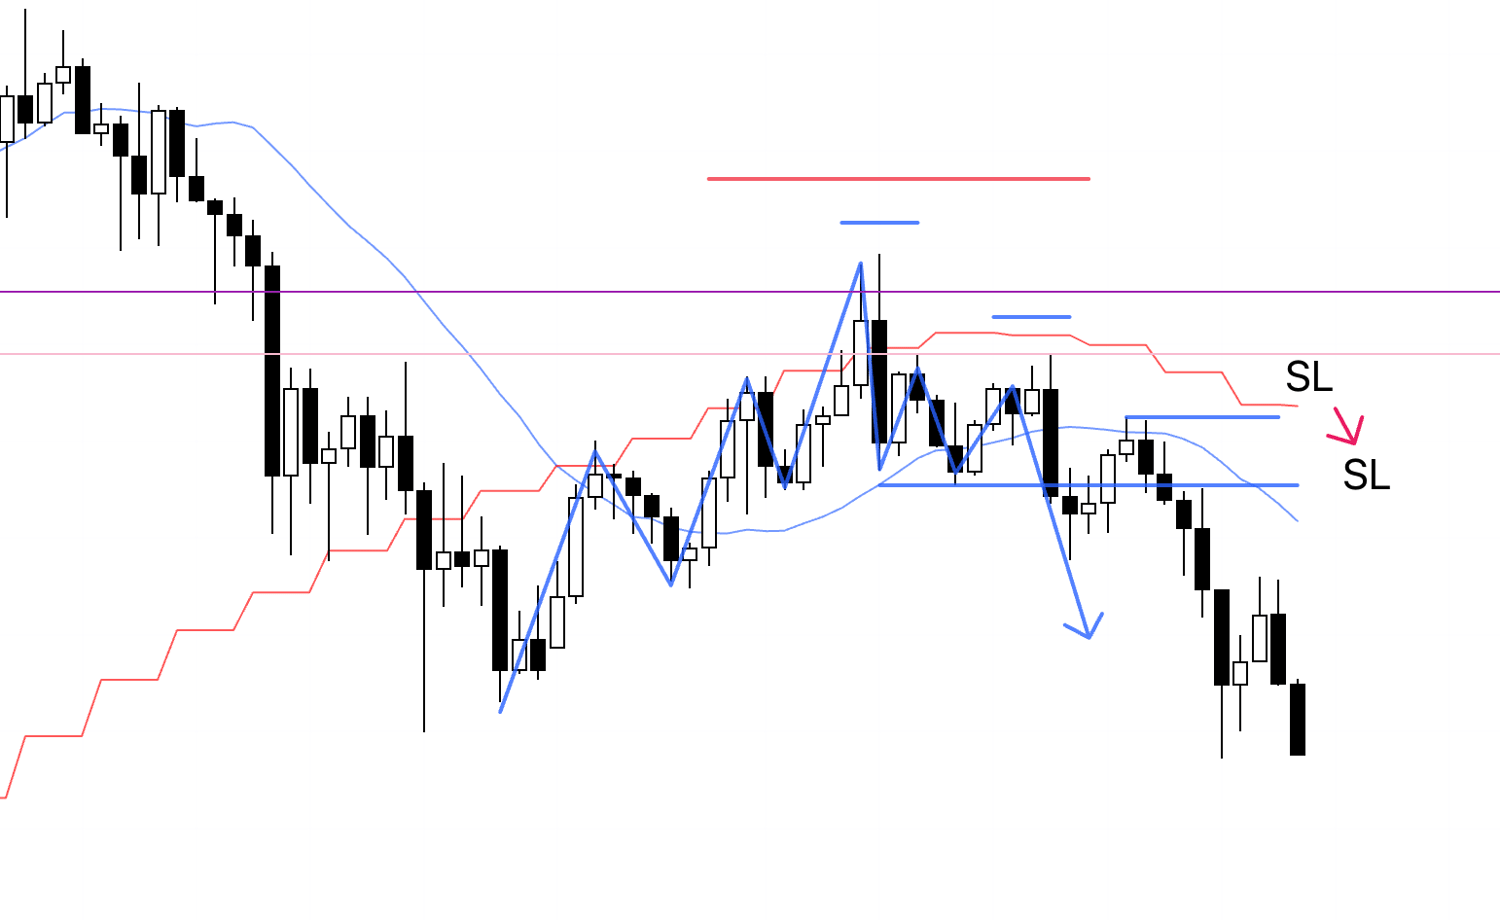
Sunday's scenario blog 4h chart
In Sunday's scenario blog, I was looking at a scenario where 4h would form a new lower‑high point and I'd then take a short entry on the lower timeframes within that area.
4h
This is the actual chart.
The 4h lower‑high point was cleanly capped by the previous lows (the light blue and pink lines), so this becomes a great selling area.
1h
On 1h, you can see price is forming almost a double top and is trying to break the low.
If you look closely, it has actually broken the high by a tiny amount, about 1 pip or so, but I don't care about such small deviations.
If it goes on to break the 1h low, I'll enter.
15m
After that, I had a sell stop order waiting at the 1h low break, but a chance to enter one step earlier appeared on 15m, so I entered on the 15m setup.
I'm going to hold it until the 15m trend breaks.
If it continues down to break the 1h low (blue line), the move will spill over into a 1h downtrend, so this becomes a trade where I can aim for a large return with a small 15m stop width.
But that's only "what I'm able to aim for"; there's no guarantee it will actually play out that way.
Even when the move does extend into the 1h trend like this, if you entered on 15m it's important to exit where the 15m trend clearly breaks.
Because this is a trade to capture the 15m swing.
Even when it does connect into a 1h trend, there's no guarantee the 1h trend will just keep running from there.
Precisely because you exit based on the 15m when you enter on the 15m, even when the 1h trend doesn't continue you can get out with a small loss or grab at least a bit of profit, and the advantage of getting in early on the 15m is preserved.
How far you can ride it on the 15m once it spills into the 1h swing should be treated as a positive extra, and you shouldn't use that as a reason to switch the trade's timeframe midway.
Adding that kind of complexity just makes your rules vague, gives you reasons not to cut losses where you should, and creates hindsight regrets like "I should have switched to 1h this time" or "I should have treated it as a 15m trade this time".
Once you've decided "this is how I'll do it" and tested the results of that rule set over a large sample, you have to accept whatever results come from following it.
This is not a trade to capture the 1h swing, it's a trade to capture the 15m swing.
If you want to trade the 1h swing, you should be entering from the 1h low break from the start and sizing the position based on that wider stop.
15m
I've moved my SL down.
15m
Price hit the trailing stop I had been moving down, and that was the end of this trade.
What I wrote earlier has just played out exactly as is.
As in this case, even if you enter on the 15m, then break the 1h low and spill over into what looks like a 1h trade, there's no guarantee it will then keep running smoothly.
Because you're getting in one step early on the 15m and treating it as a 15m trend, you can pull out with almost no damage when it doesn't follow through, and when it does run you create the potential for a very attractive risk‑reward trade.
Of course, this is just a single outcome, and there will be plenty of times when it doesn't work out like this, but the key is that once you've decided "this is how I'll do it" and tested it, you have to do it that way every time and accept all the results that come with it.
〜・〜・〜・〜・〜・〜・〜・
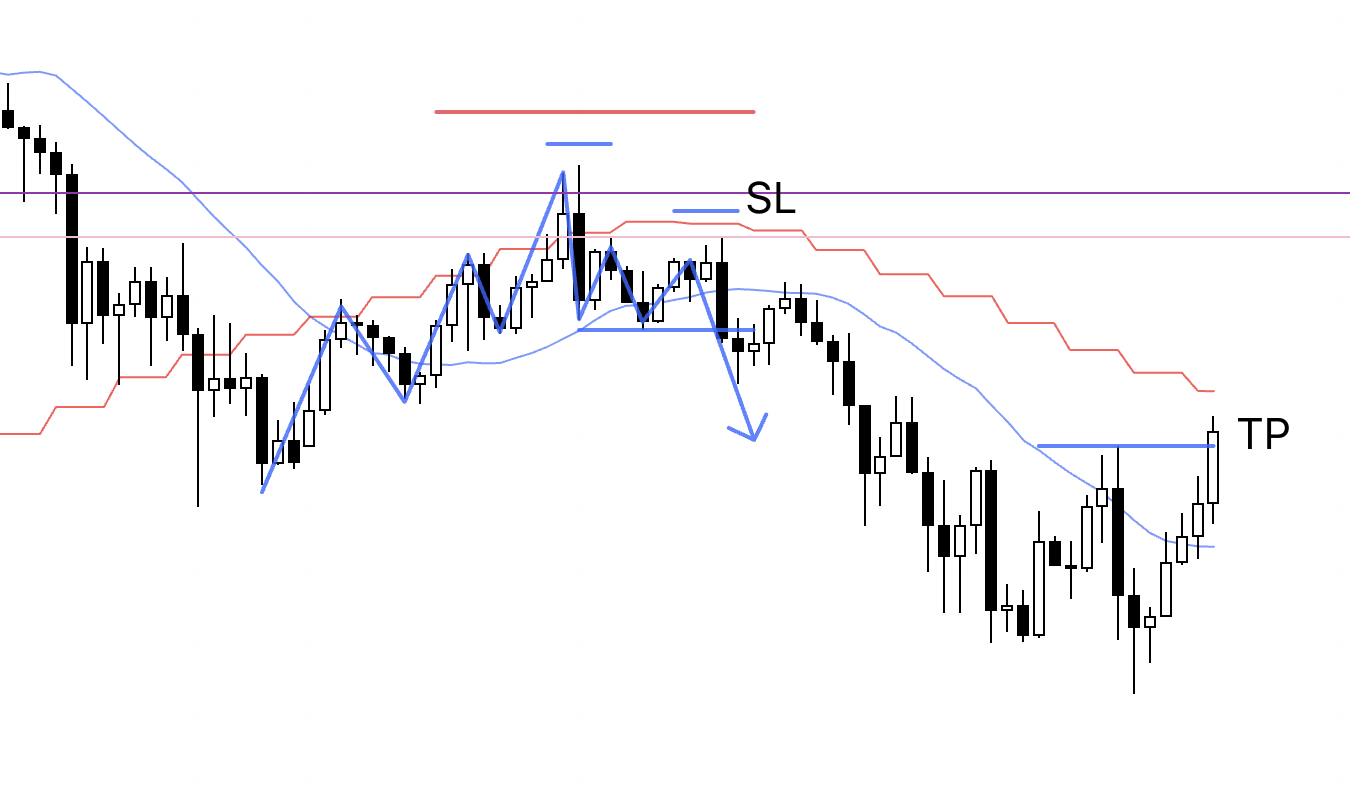
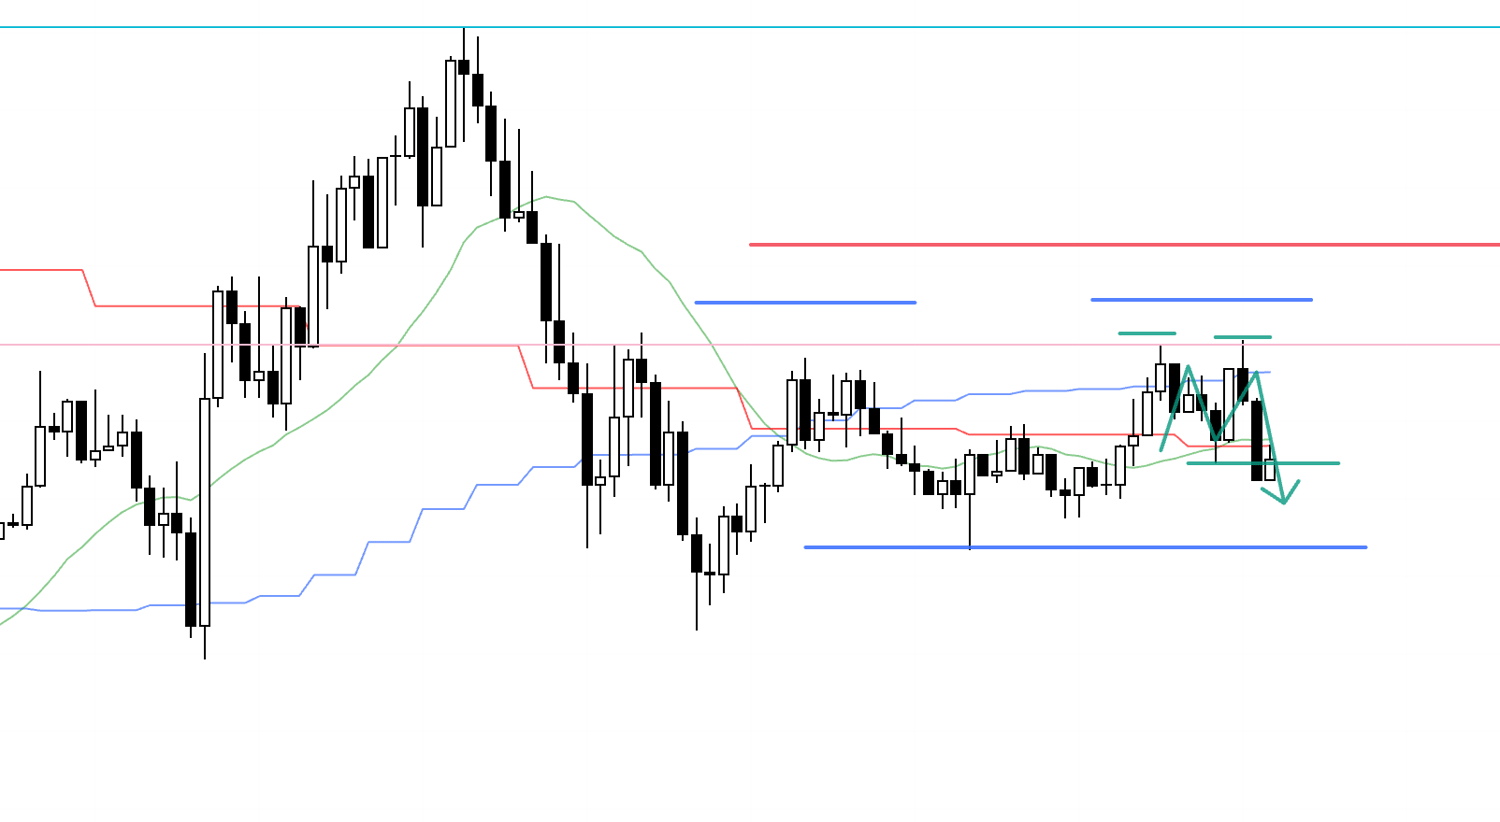
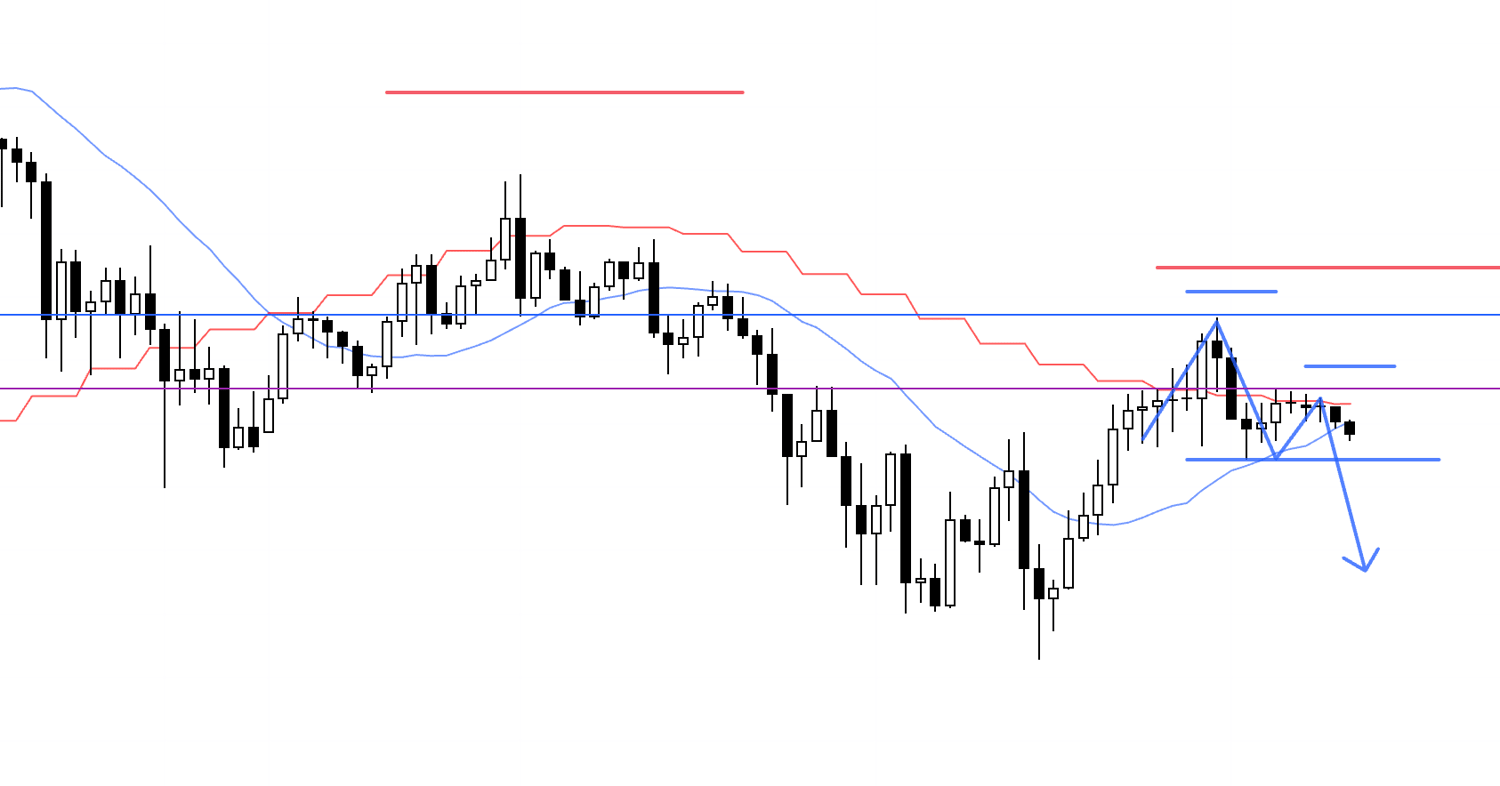
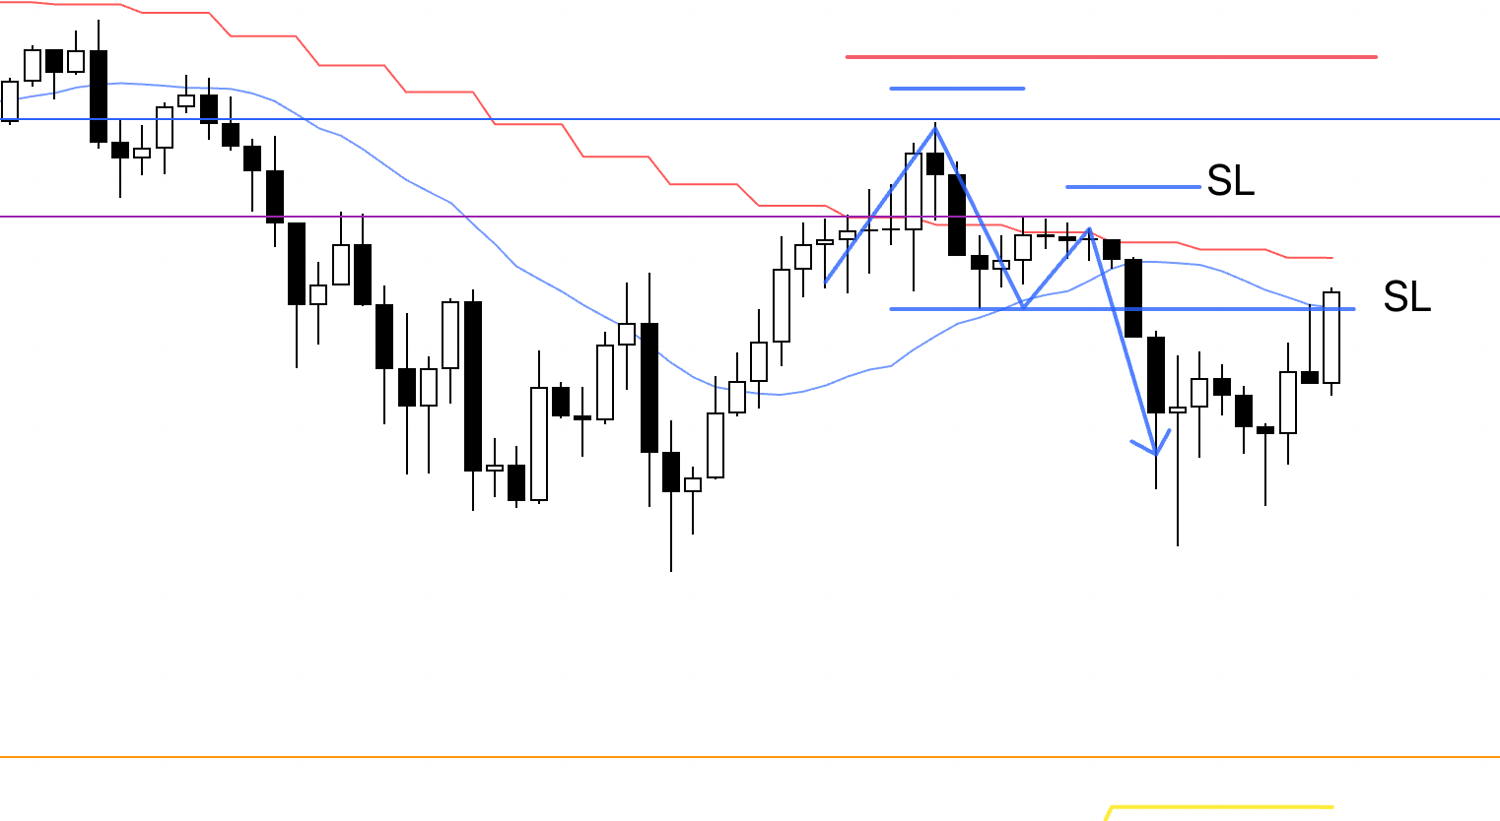
November 27 (Thu)
USDJPY
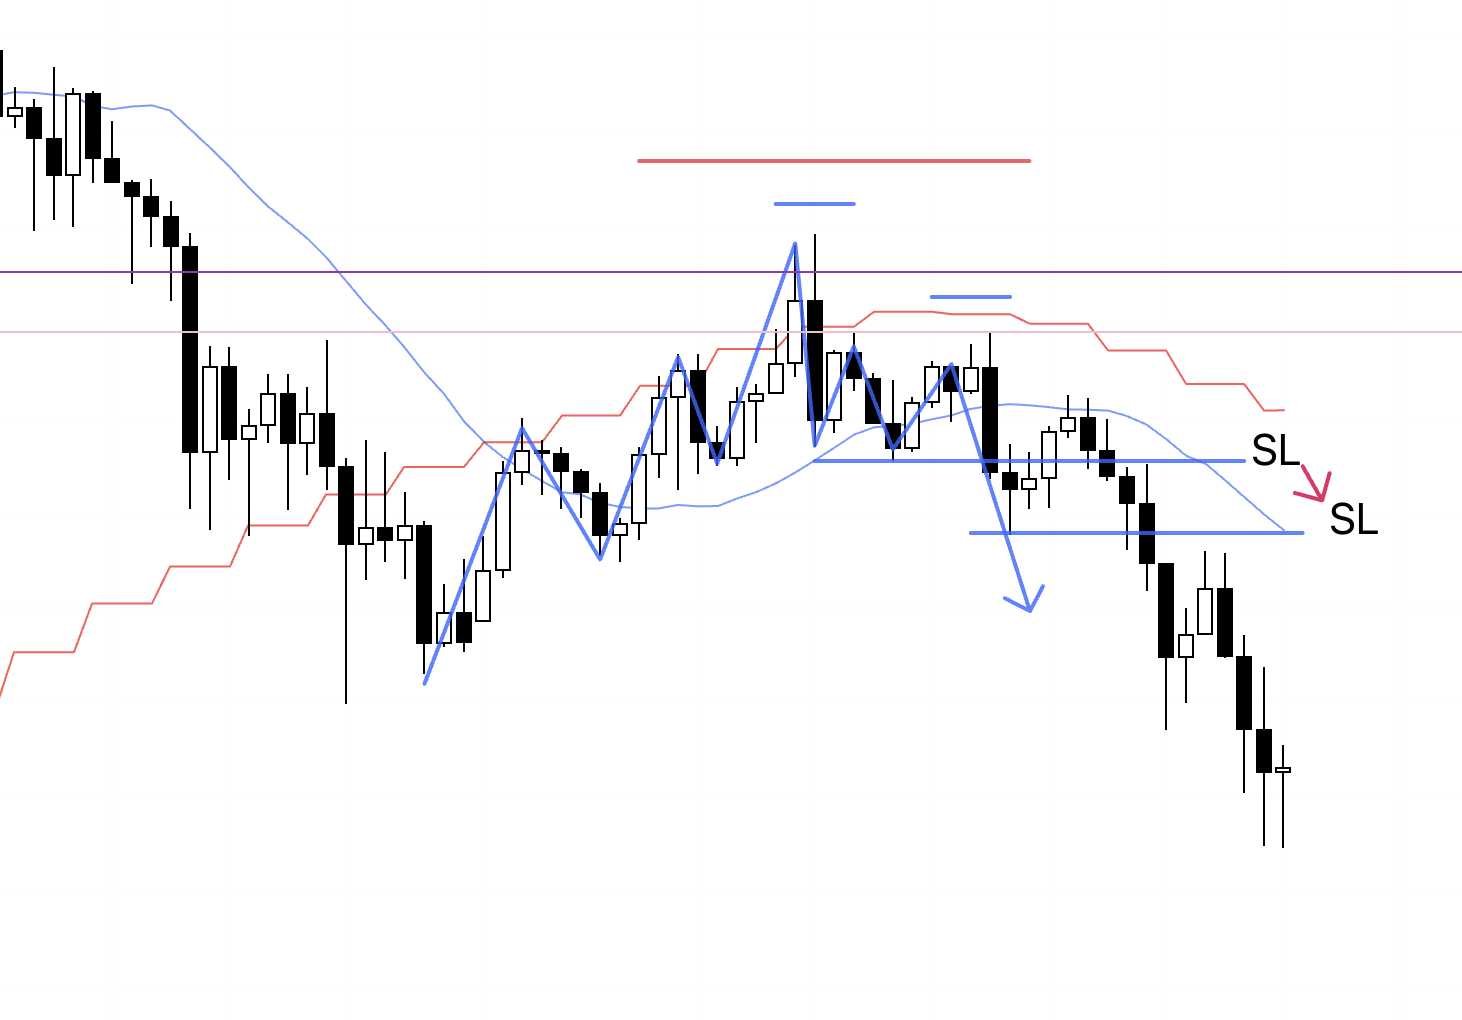
Sunday's scenario blog 4h chart
In the scenario I laid out on Sunday, I was looking to sell on the lower timeframes when 4h formed a lower‑high point, being capped by the moving average.
4h
This is the actual 4h chart.
Price has formed a lower‑high point on 4h, neatly capped by the previous high level (the blue line) that you can also see on the weekly.
1h
Within that 4h lower‑high area, 1h has also formed a lower‑high point, and this lower high is cleanly capped by the purple line drawn from the previous lows and highs.
If price now goes on to break the low, I want to go with the downside move, so I've placed a sell stop order.
15m
On 15m, if price forms a new lower‑high point as shown by the green arrows on this chart, I can get in one step earlier than the 1h entry.
But if it just keeps falling from here, there will be no 15m entry and it will have to be a 1h trade.
1h

Price has broken the 1h low, so I've entered.
In the end, 15m never formed a new high and just fell straight away, so this time it will be treated purely as a 1h trade, and I'll hold it until the 1h trend breaks.
As we also saw in Sunday's scenario, this is a down move forming a pullback on the daily, so the deeper it falls, the greater the risk that pullback‑buying forces will step in.
So once price reaches the area around the orange line below, I'm planning to secure profits on half the position.
1h
I've moved my SL down a bit.
1h
Price hit the trailing stop I had been moving down, and that was the end of this trade.
Just like the previous trade, this trade carried the risk of daily‑chart pullback buying and was a counter‑move against the daily uptrend, so I wasn't expecting a big extension and was trading with full awareness of the risk of a sharp reversal.
That's why I had in mind to take half off at the orange line, but both last time and this time price reversed before reaching that level.
And this time, price even failed to break the previous 4h low before reversing, so it may be better to keep this low level in mind for future trades.
〜・〜・〜・〜・〜・〜・〜・
That's it for the actual trades, but for reference I'll include below the notes and screenshots I took the following day when I decided to stand aside.
〜・〜・〜・〜・〜・〜・〜・
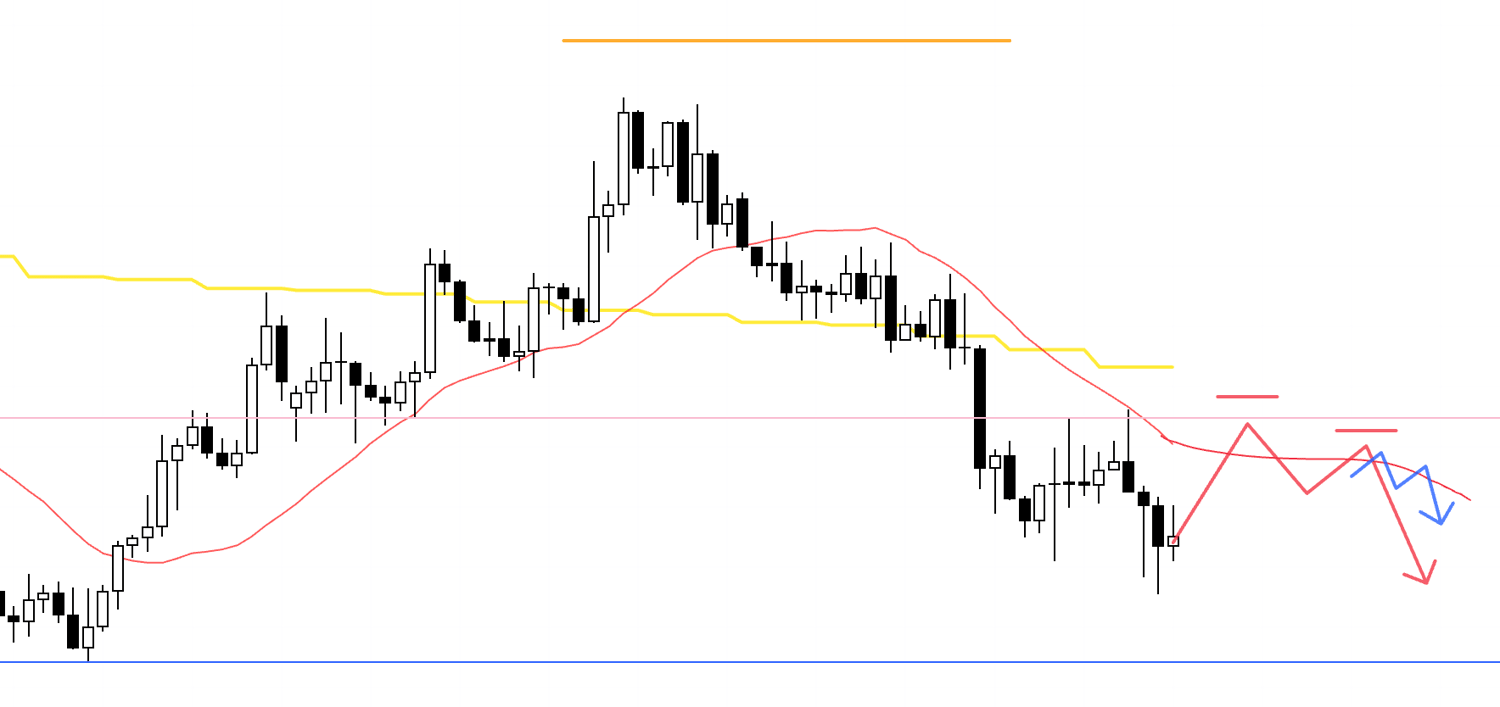
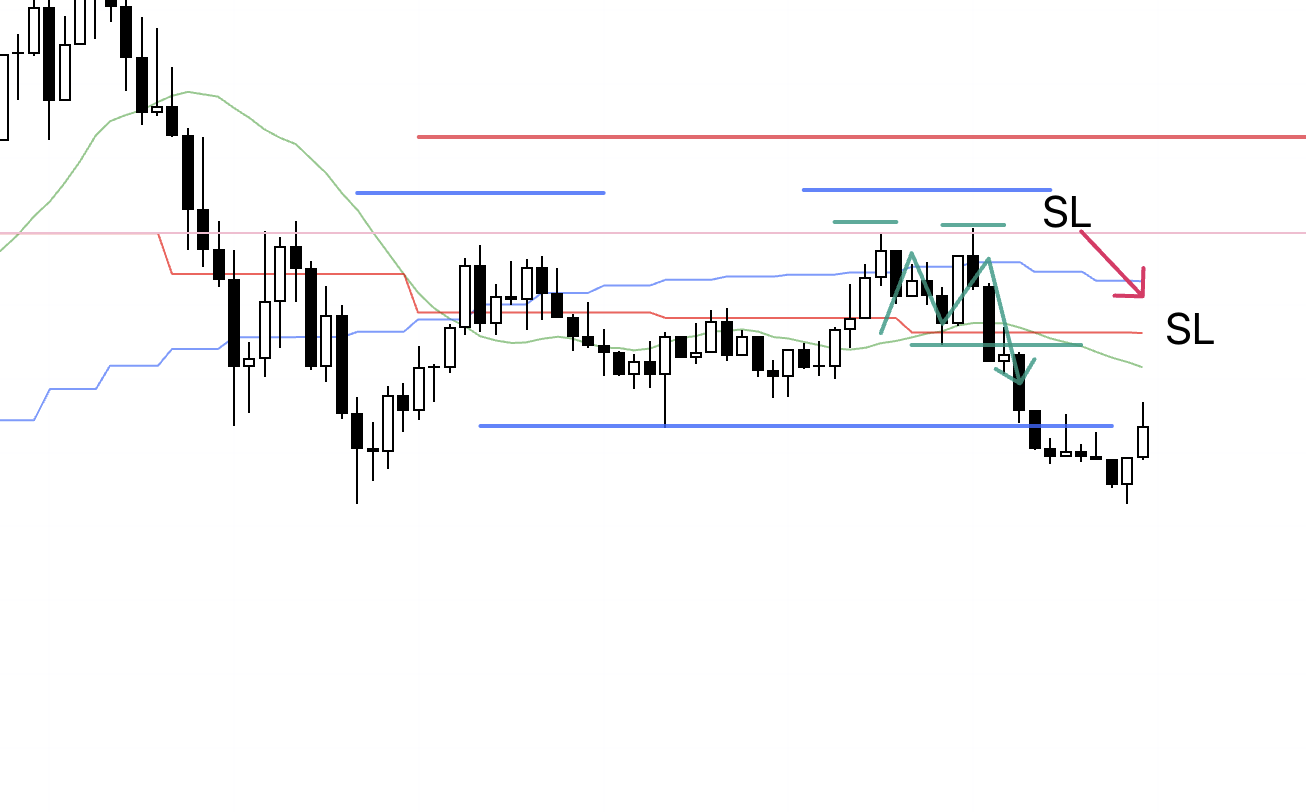
November 27 (Thu)
USDJPY
4h
After that, USDJPY formed a new lower‑high point, but just as I noted in the previous trade, the low that price failed to break is being supported by both the prior low and the prior high (the purple line below), so it's possible that daily‑chart pullback buyers are stepping in around this area.
4h
You can see it as making lower lows like this, but at the same time it also looks like it's forming a double bottom with higher lows, so you need to be careful trading inside this zone.
Given this kind of market environment, plus the fact that USD markets are closed today and spreads are unlikely to be stable tomorrow either, I'm calling it a wrap for this week's trading here.
〜・〜・〜・〜・〜・〜・〜・
That's all.
On Tuesday, I ended up effectively shorting USDJPY and EURUSD at the same time.
Since these two pairs are inversely correlated, some people might feel uneasy about shorting both at the same time.
But there's no need to overthink it.
If the charts are telling you to do that, you just follow the charts.
You should leave the outcome to probability and not worry about it.
It's your own thinking that makes trading difficult.
All you need to do is follow what the chart is showing instead of thinking about this and that.
Doing "simple things in a simple way" like this is actually very hard, and that difficulty is directly tied to how little you trust your own approach.
What's being tested is how much you trust your own strategy, whether you trust probabilistic thinking, and whether you trust yourself to repeat the same actions over the long term.
If that trust is solid, the unnecessary thoughts disappear and you're able to act on simple things in a simple way.
In other words, being able to act simply on simple things is a "skill" that is built through preparation and practice that create trust.
Even when USDJPY and EURUSD both give signals in the same direction at the same time, if that's what the charts are showing, I execute both without hesitation, and whatever happens with the outcome, I don't have any emotional reaction to that single result or start overthinking it.
All I do is "keep repeating the same thing today and tomorrow", and thinking about anything beyond that is not part of my job.
All of this comes down to how fully you understand that your job is not based on "predictions or opinions" but on "faithfully executing the rules of the strategy you've prepared", whether you've completely accepted that, and whether you've done the thorough preparation required to make it possible.
In my case, I already understand well that if I just keep trend‑following based on my own rules, my capital will grow in the end even if there are drawdowns in the short term, so whatever happens, I simply keep repeating.
Thank you for reading all the way to the end.
I hope this blog can serve as a hint or reference for those who are about to build their own strategies or who are struggling to achieve consistency.