


Hello.
I’ll lay out my trading scenarios for the coming week.
I publish this “Trade Scenarios” blog every Sunday.
And every Saturday I post a “Weekly Trade Report” where I explain how I actually thought about the market and executed my trades during the week.
By reading this trading-scenario blog together with the Weekly Trade Report, I think you’ll be able to use my process as a practical reference for how to think ahead of time, what to wait for, and how to execute in a consistent way.
For the underlying strategy, please refer to my blog posts on Dow Theory and multi-timeframe analysis.
A “scenario” is not a forecast.
It is not a prediction, but my personal plan that says, “If the market does this, I will do that.”
I don’t try to predict the market, and this is not intended as such, so please keep that in mind.
Nor is this a set of instructions telling you what to buy or sell, or a service providing trading signals.
It does not guarantee any future profits; it is provided purely for educational purposes, using my own consistent process as the example.
I cannot take responsibility for any outcomes of the trades you place, so please trade at your own risk.
With that, let’s start with USDJPY.
(On my charts, the colors of the lines I draw represent each timeframe: orange for the daily, red for 4h, blue for 1h, and green for 15m.)
〜・〜・〜・〜・〜・〜・〜・
USDJPY
Weekly chart
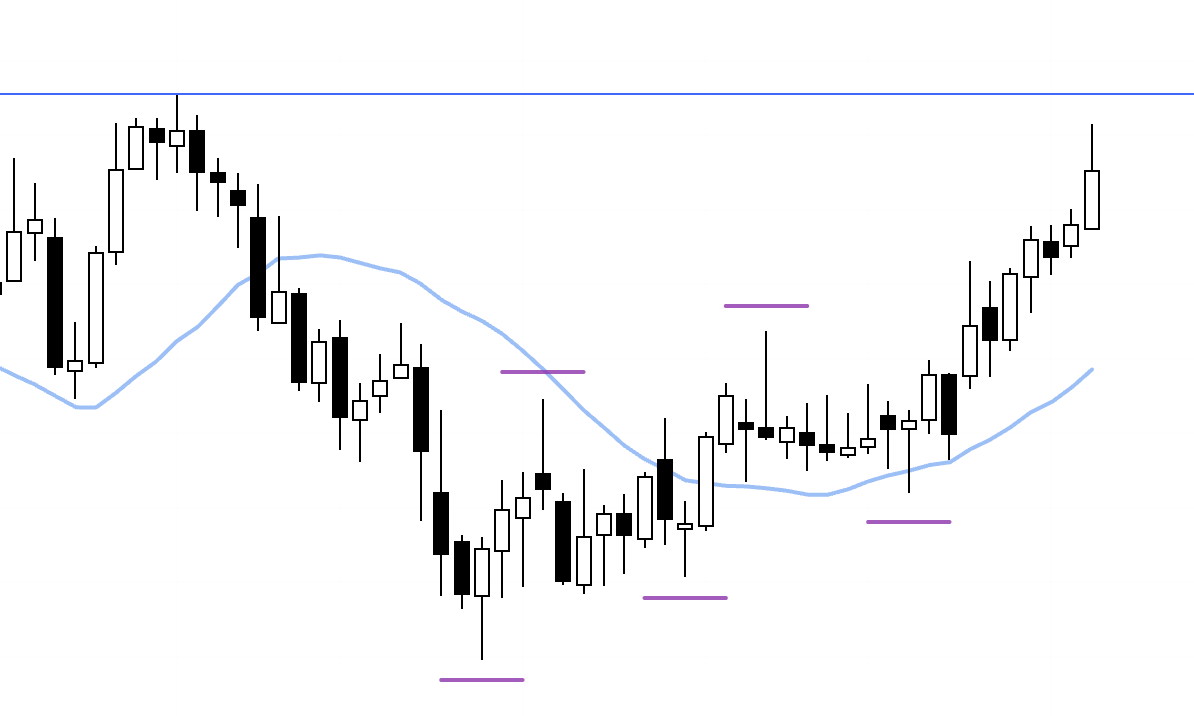
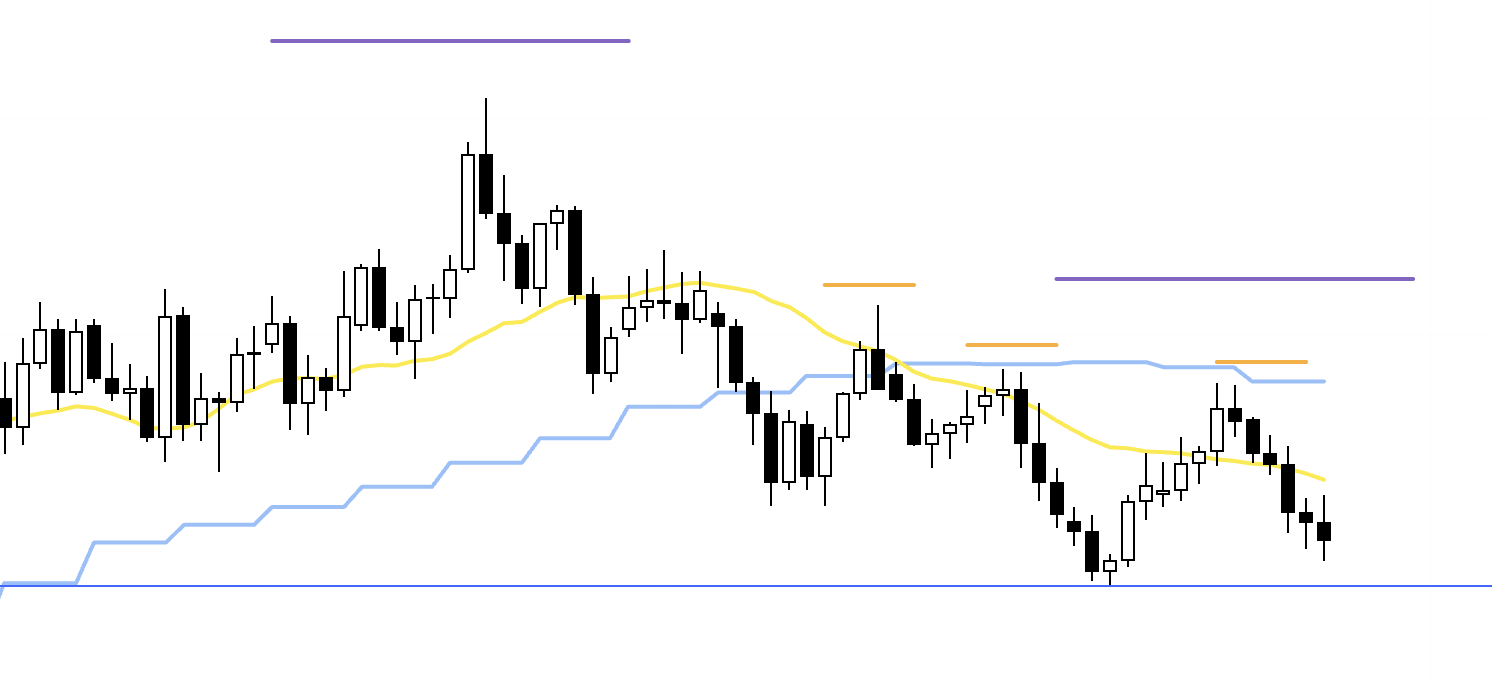
On the weekly chart, USDJPY remains in an uptrend, repeatedly printing higher lows and taking out prior highs.
There is a blue trendline drawn off the previous high sitting overhead, but price still has a bit of room before it reaches that area.
Daily chart
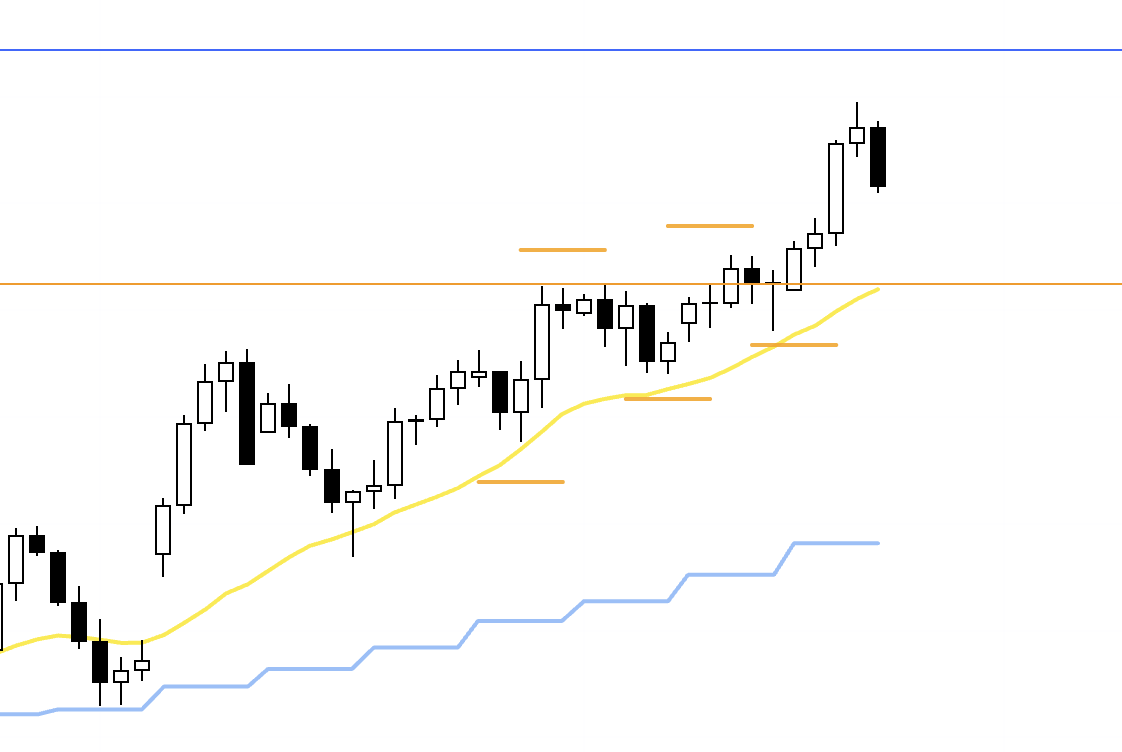
The daily chart is also in an uptrend, so the basic idea is to look for dip-buying opportunities.
That said, price is currently stretched away from the moving averages, so I am also willing to trade the downtrends on the lower timeframes if the risk–reward is acceptable.
In that case, levels such as this orange line are areas where buying pressure is likely to increase, so they need to be treated with caution.
4h
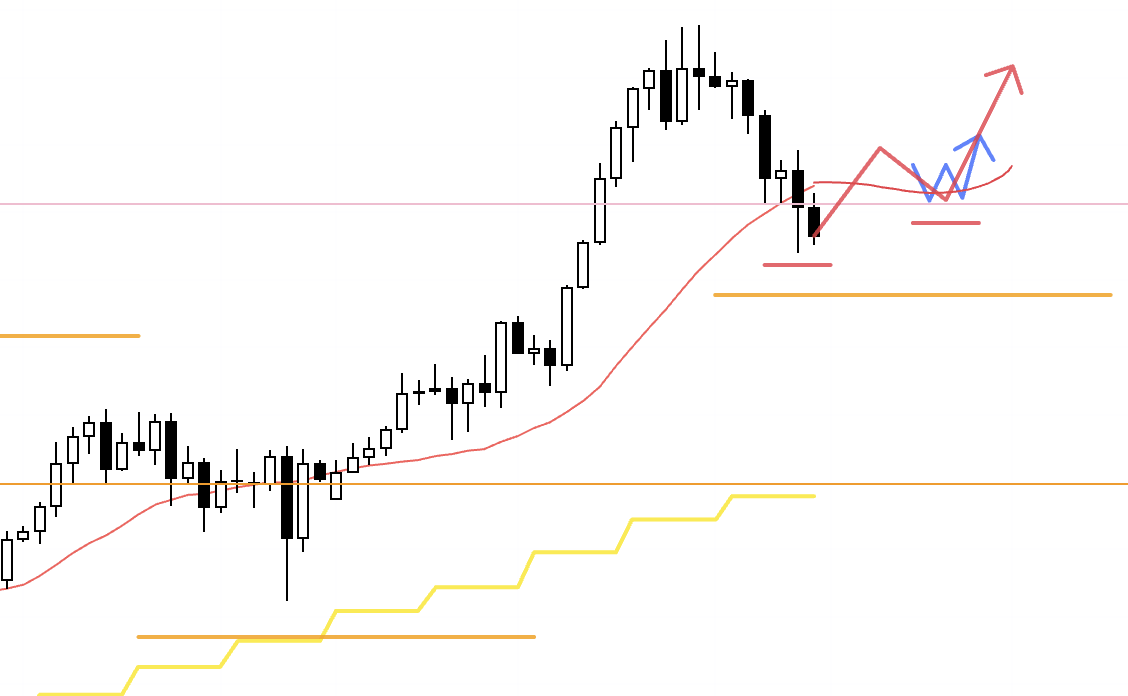
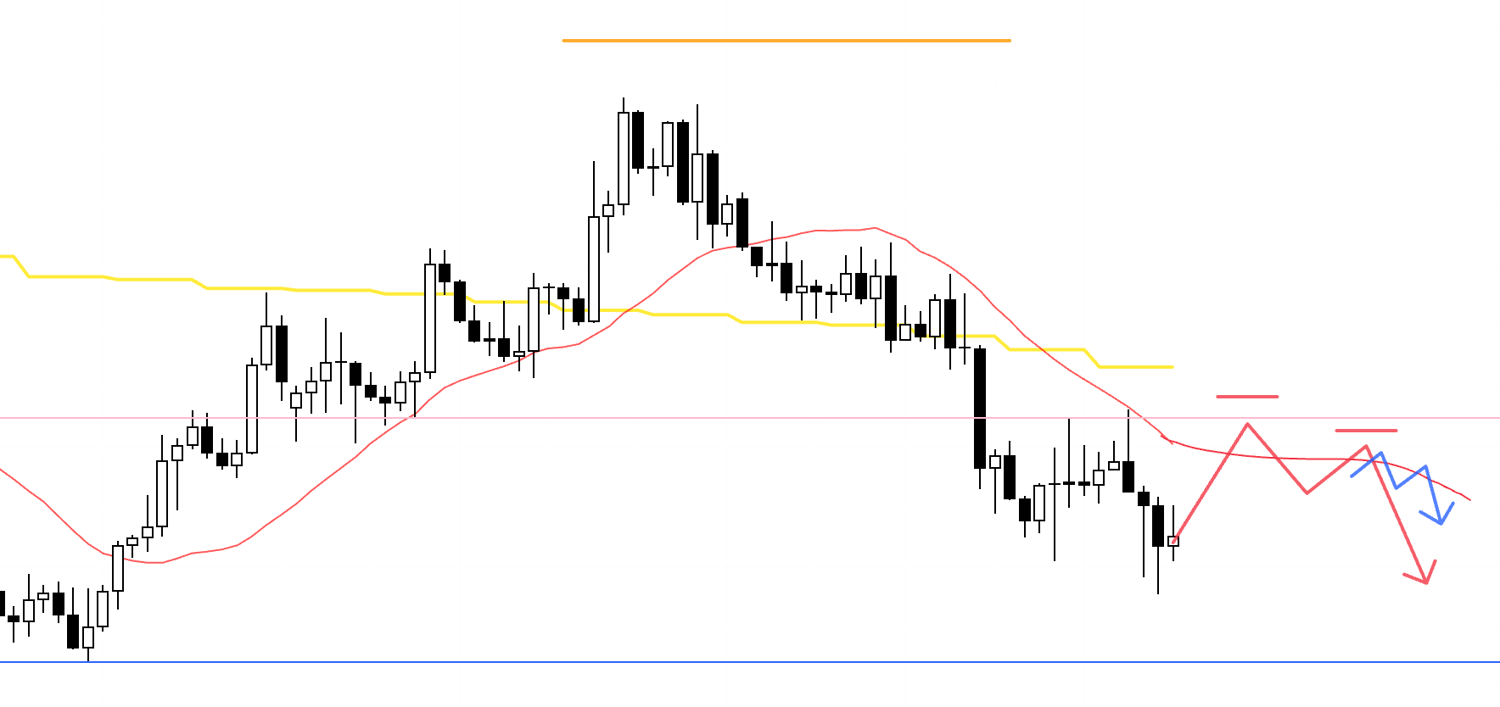
At the moment, price is trading below the moving averages here, so I have no interest in buying immediately from this level.
For me to get long, I would need to see a new higher-low form and the moving averages start to support price from below, and then I will look to ride the move up as part of the daily dip-buying scenario.
4h
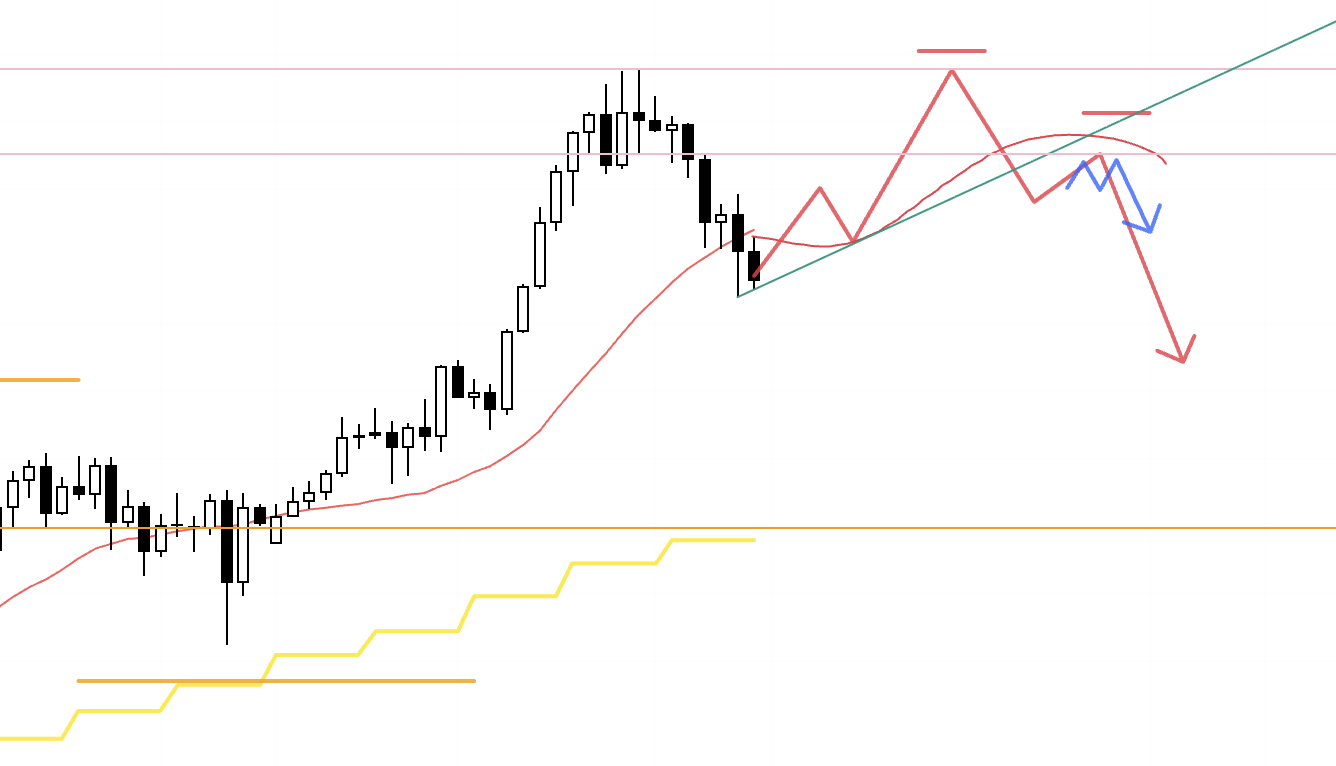
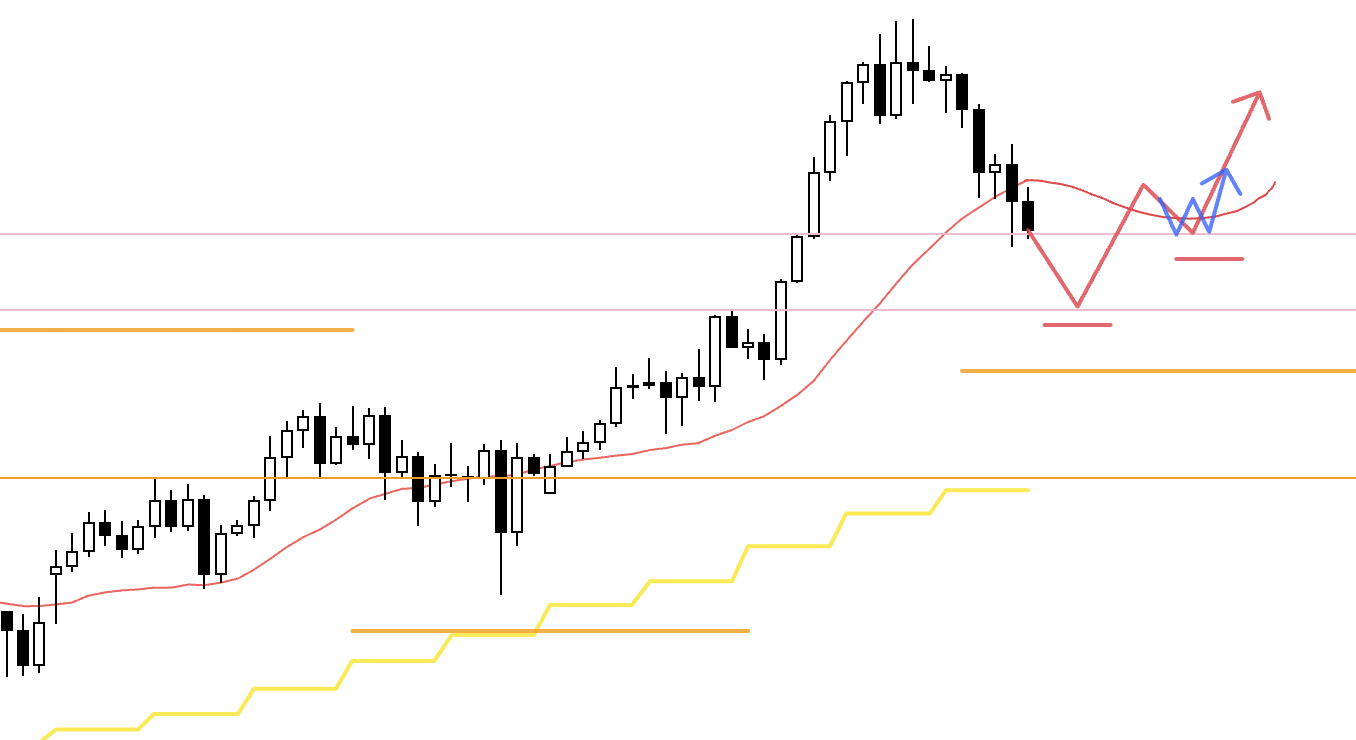
If, after an advance, price fails to break the previous high and starts to roll over into lower highs, I will consider shorts on the lower timeframes.
In that case, if the moving averages are still supporting price from underneath, dip-buying will continue to come in and I myself would need to be buying in that scenario as well, so I will be watching closely whether price has actually broken back below the moving averages.
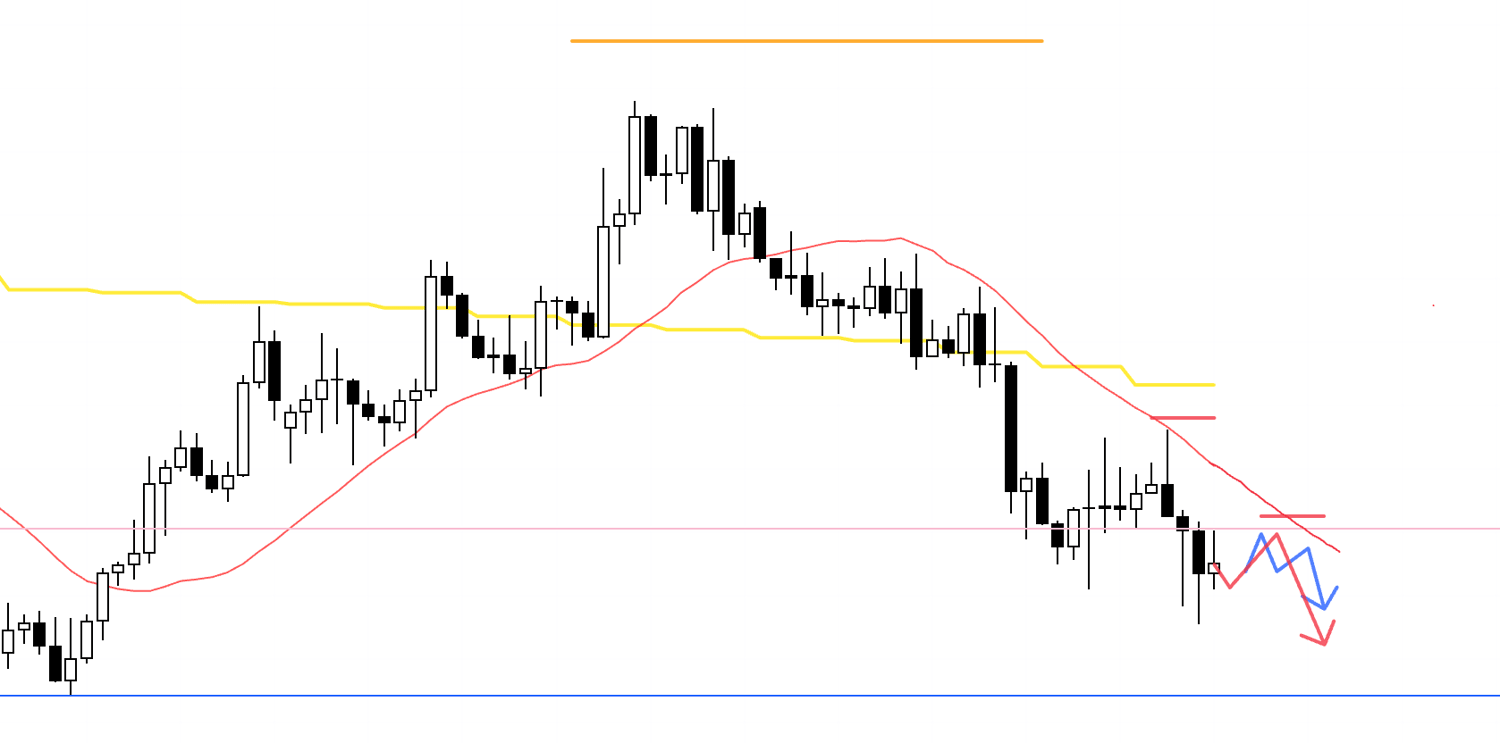
4h
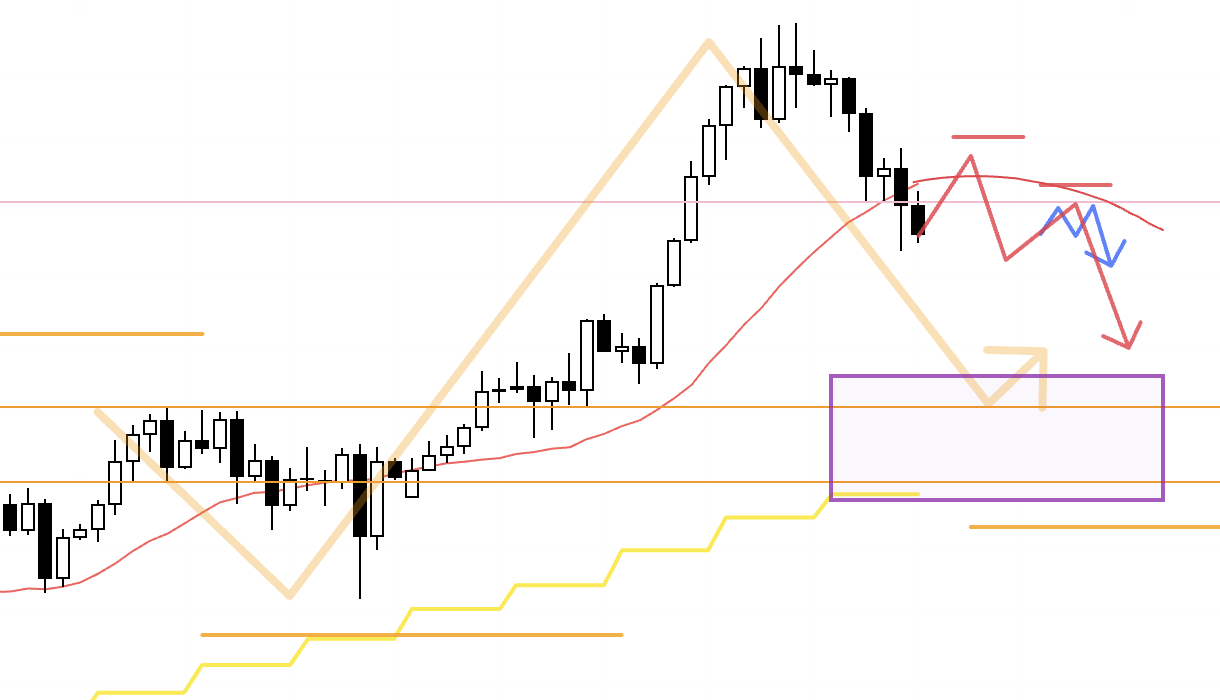
On the 1h, we already have a downtrend in place, so I am not going to jump in and sell from here.
For shorts, I would first want to see that 1h downtrend complete, and then look to sell at the very first entry point of the next fresh downtrend.
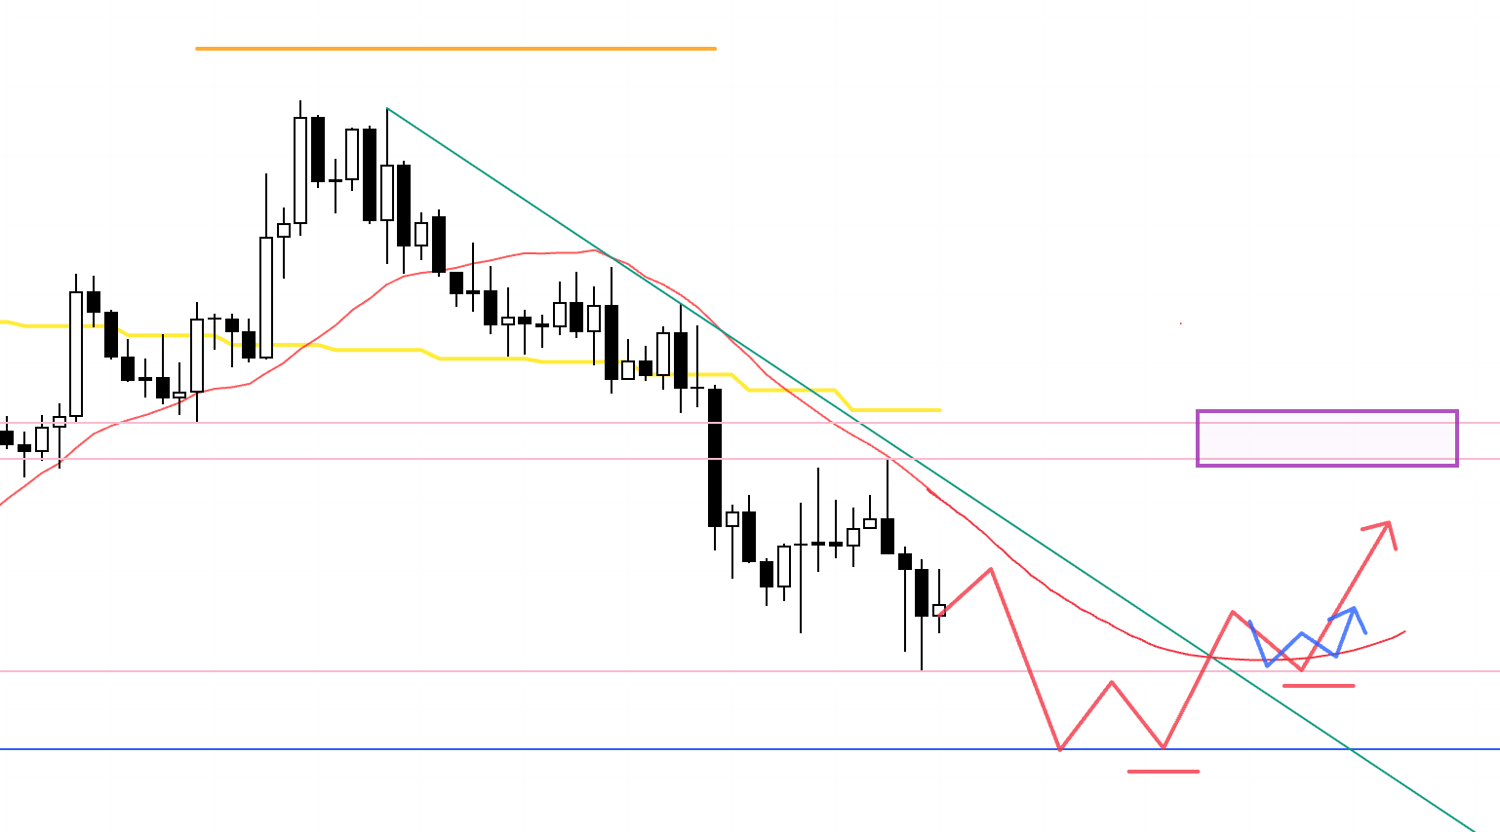
On the daily chart we are still making higher lows and higher highs, so the cheaper it gets, the greater the risk that dip-buyers step in aggressively.
The area highlighted by the purple box is where buying pressure is likely to intensify, so if I am already in a position I will need to respond there, for example by locking in half the profit.
4h
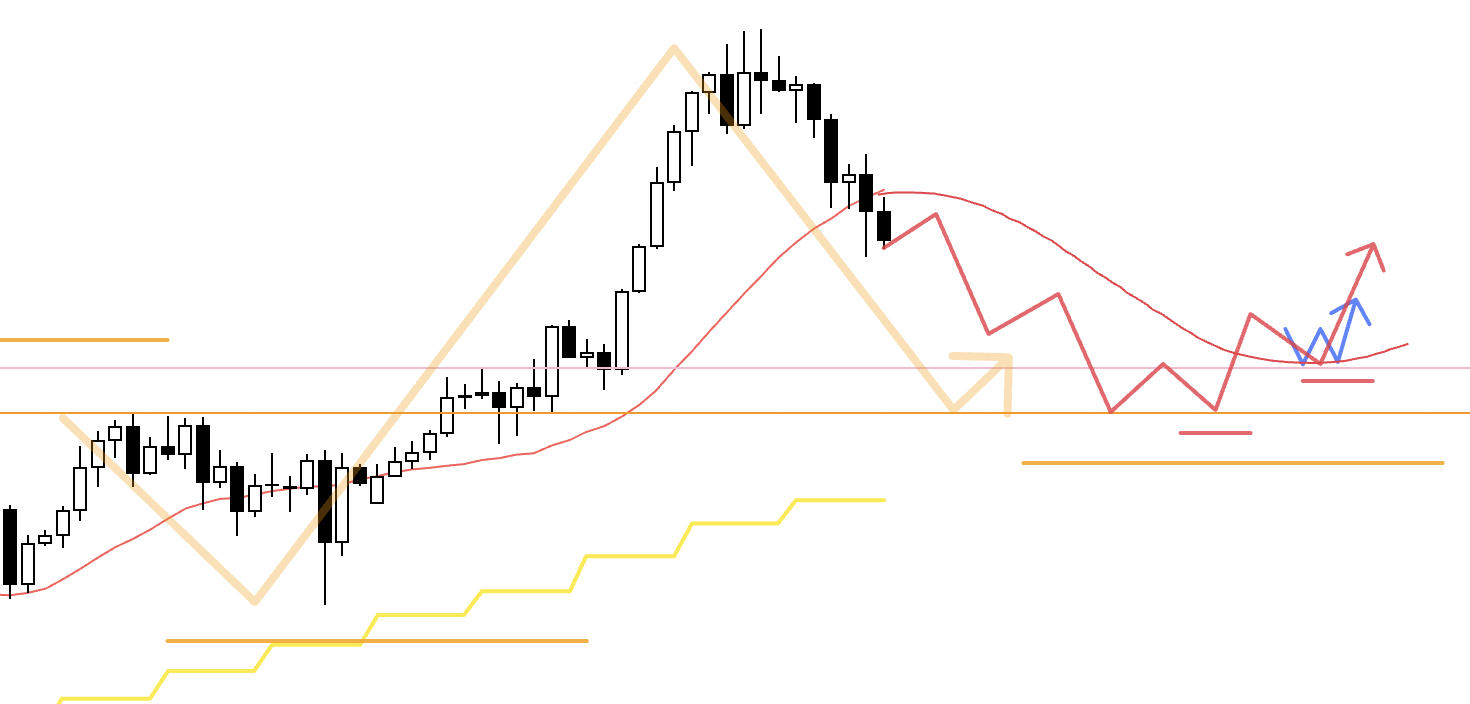
Conversely, if price holds at one of these levels and the 4h structure actually turns back up, then I need to be going with that move as part of the daily dip-buying scenario.
Now let’s move on to EURUSD.
〜・〜・〜・〜・〜・〜・〜・
EURUSD
Weekly chart
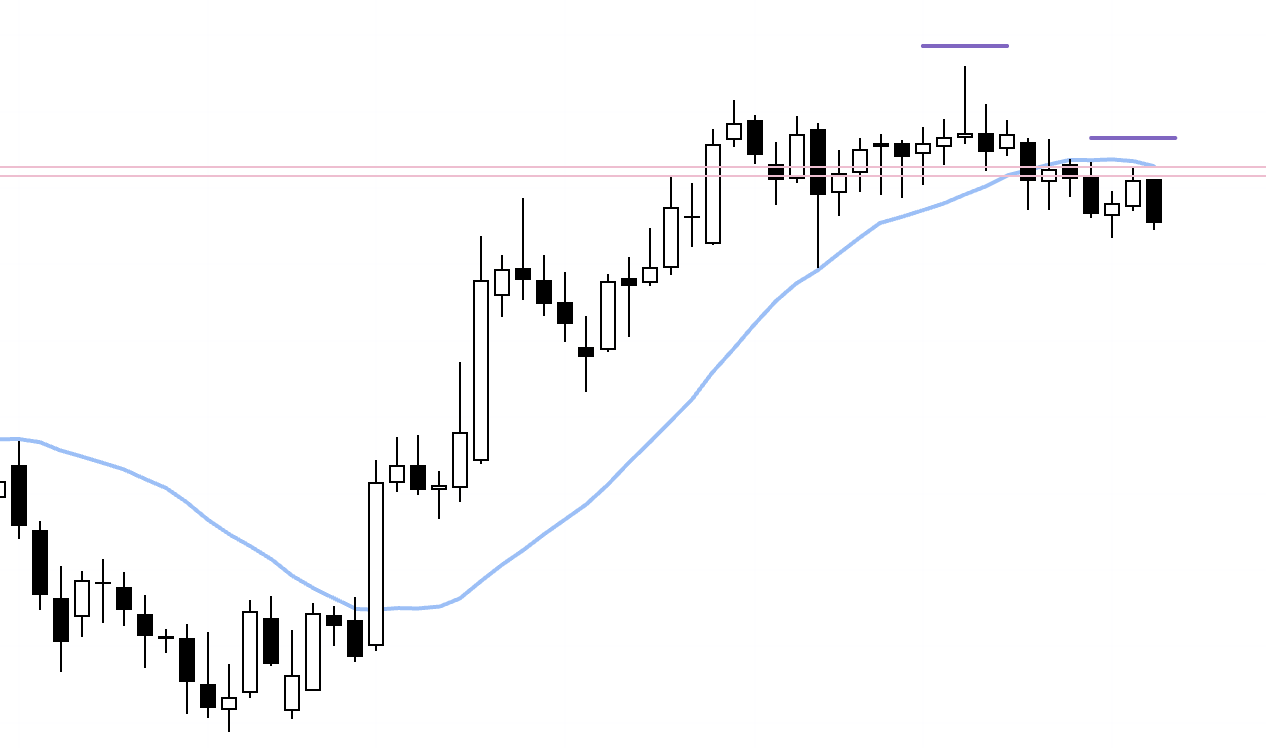
We had been in a consolidation phase for a while, but price has now broken below the moving averages, which are starting to cap the market from above, and the series of lower highs has become clearer.
Daily chart
On the daily chart, we are printing lower highs and taking out lows, so the pair is in a downtrend.
However, the last low (the blue line) coincides with a previous high that can also be seen on the weekly chart, so I want to be a bit careful around that level.
4h
If the 4h can carve out a fresh lower-high area, and the lower timeframes also start to show lower highs and lower lows, I will look to initiate shorts.
In that case, the key is whether an entry appears that offers acceptable risk–reward down to the lower blue line.
If price is already too close to that blue line, I will stand aside.
4h
After that, if price holds at, for example, this blue line, forms a new higher-low area and the 4h structure flips into an uptrend, I will then consider longs on the lower timeframes.
Any such rally would, on the daily chart, just be a corrective move forming a new swing high, so the higher it goes, the more selling pressure is likely to build.
I will check that the risk–reward makes sense at entry, and if I am already in a position I will look to respond at key levels, for example by banking half the profit when price reaches an important level.
〜・〜・〜・〜・〜・〜・〜・
That’s it for now.
These are only the scenarios as of this moment, and once the new week actually gets under way I intend to watch how price moves and update or rebuild the scenarios as we go.
I have had a few questions about this on X, so let me clarify that the levels I draw in these scenario posts are based on the current snapshot (Sunday) and are therefore provisional.
Once the week starts, I frequently redraw the levels as new price action comes in.
As traders, we have to make decisions based on the information available at that moment, and we are never given future information in advance.
Of course we have to use historical information, the chart, but when new information arrives, we should also make use of that latest information.
Clinging to levels drawn in the past and holding on to the idea that "this is how it should play out" as a fixed "forecast" is not a healthy habit.
For example, if a provisional level you drew gets broken, and the new structure shows that price is now being supported by a different level, that is the footprint of many traders transacting around that new line, and you simply cannot ignore it in your trading.
This blog is not here to provide trading signals.
Its purpose is for you to see how I think ahead of time, how I build scenarios, and then how I actually execute those scenarios once the week begins, as one coherent sequence.
So if you do use my trading approach or market views as inspiration and go on to define your own rules, make sure you rigorously test and practice them yourself.
I have said this many times, but building scenarios in advance is not "forecasting the chart".
It is my own "action plan".
I am not drawing the chart’s future, I am drawing my own.
It is a "if this happens, I will do that" plan, and fundamentally different from a prediction.
That is why I do not care whether the chart goes up or down.
If I have an edge on the long side, I buy, and if I have an edge on the short side, I sell, that is all.
Because I have clearly defined the conditions under which a buying edge exists, I can build scenarios in advance and simply wait for them.
If you are not clear on what you are waiting for, you cannot wait in the first place.
The same goes for when I am in a position, I also define clearly what conditions will invalidate that edge, so when they occur I can cut the loss without hesitation.
To me, there is nothing more pointless than holding a position after the trend has broken, so once the rationale for holding the position is gone, there is no reason to stay in it.
A stop-loss is not something you randomly widen or tighten, and arbitrary numbers like "15 pips" have no meaning on their own.
You exit precisely because the premise and logic behind your entry have broken down.
I have written about how I set stop-loss levels in a previous blog post, so have a look if you are interested.
These trading scenarios are nothing more than my own plan, so if your trading approach is not yet firmly defined, feel free to use them as a reference when building your own strategy, but if your own trading is already solid, please do not let my plan distract you from following your own rules.
Thanks for reading all the way to the end.