


Hello.
I’ll lay out my trading scenarios for the coming week.
I publish this “Trade Scenarios” blog every Sunday.
And every Saturday I post a “Weekly Trade Report” where I explain how I actually thought about the market and executed my trades during the week.
By reading this trading-scenario blog together with the Weekly Trade Report, I think you’ll be able to use my process as a practical reference for how to think ahead of time, what to wait for, and how to execute in a consistent way.
For the underlying strategy, please refer to my blog posts on Dow Theory and multi-timeframe analysis.
A “scenario” is not a forecast.
It is not a prediction, but my personal plan that says, “If the market does this, I will do that.”
I don’t try to predict the market, and this is not intended as such, so please keep that in mind.
Nor is this a set of instructions telling you what to buy or sell, or a service providing trading signals.
It does not guarantee any future profits; it is provided purely for educational purposes, using my own consistent process as the example.
I cannot take responsibility for any outcomes of the trades you place, so please trade at your own risk.
With that, let’s start with USDJPY.
(On my charts, the colors of the lines I draw represent each timeframe: orange for the daily, red for 4h, blue for 1h, and green for 15m.)
〜・〜・〜・〜・〜・〜・〜・
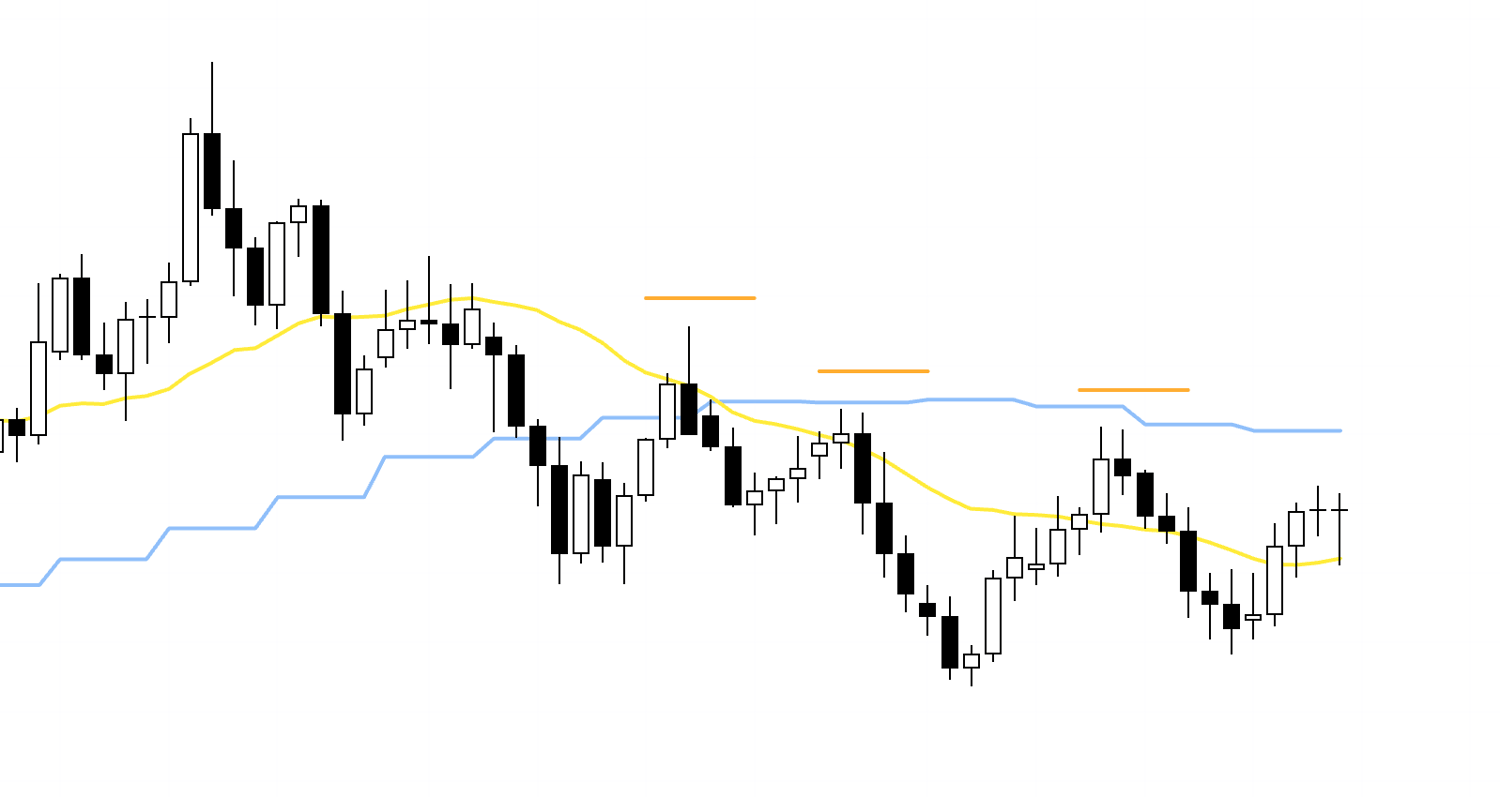
USDJPY
Daily
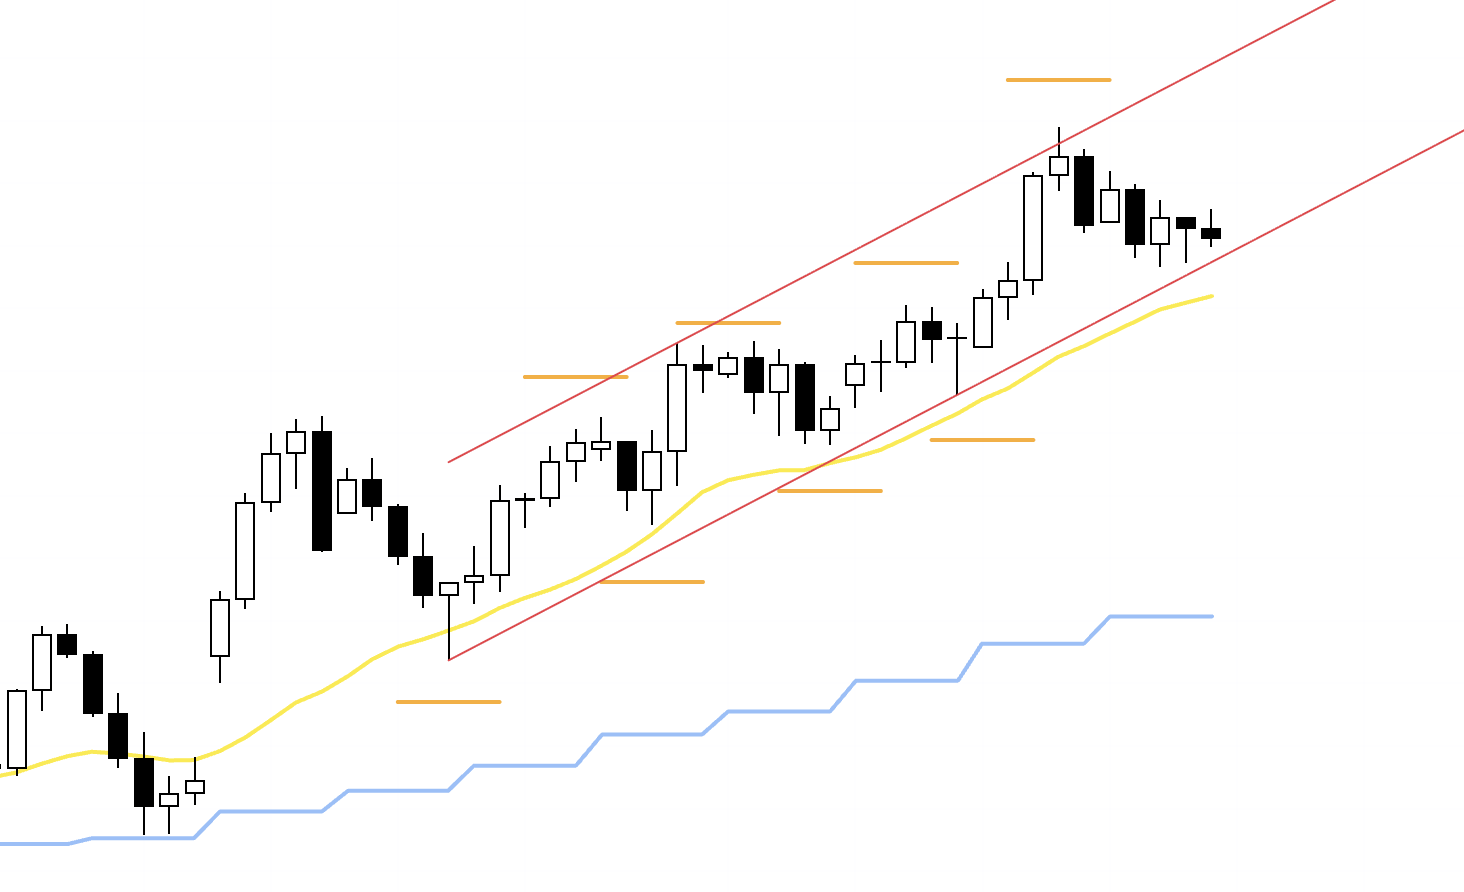
The daily chart remains in an uptrend, with higher lows and fresh highs printing one after another.
Price is currently sitting in a buy-the-dip area.
This red channel line also appears to be doing its job, so I want to build my scenarios with an eye on how price reacts around these lines.
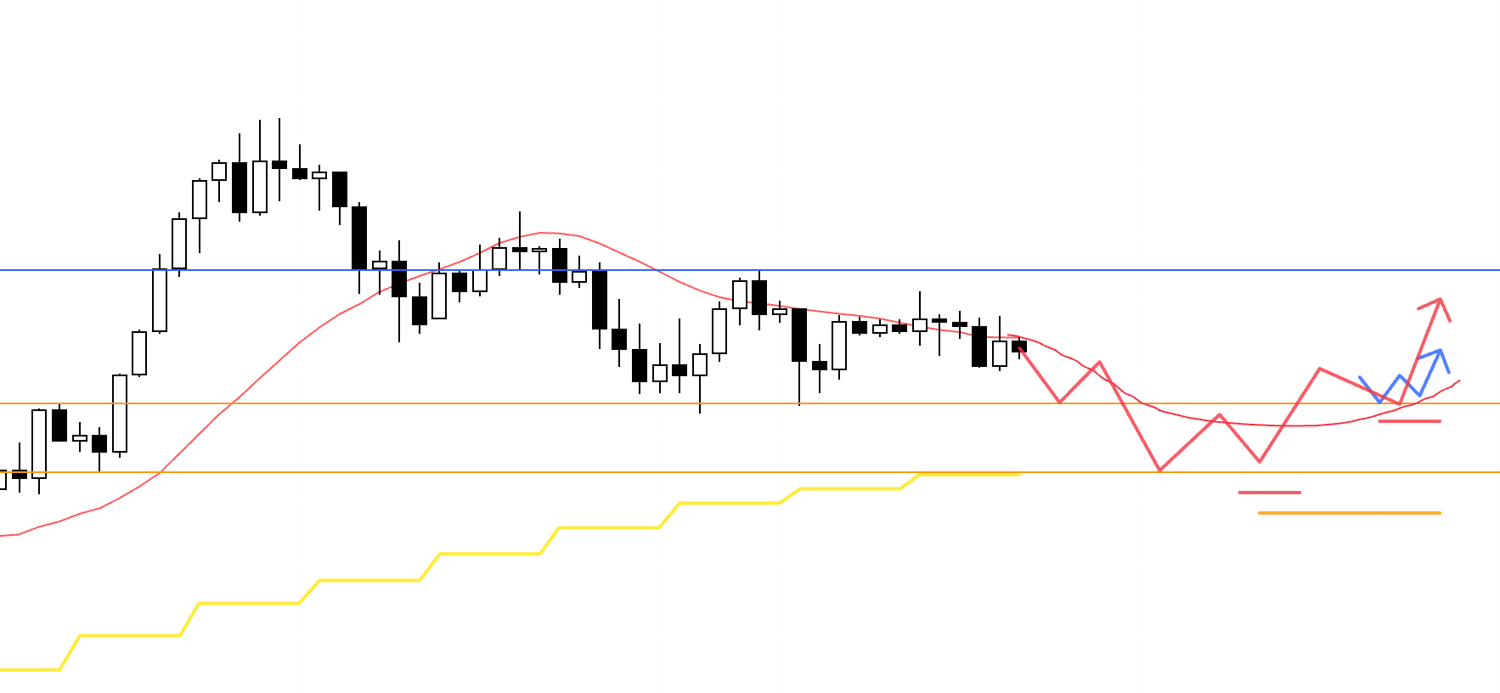
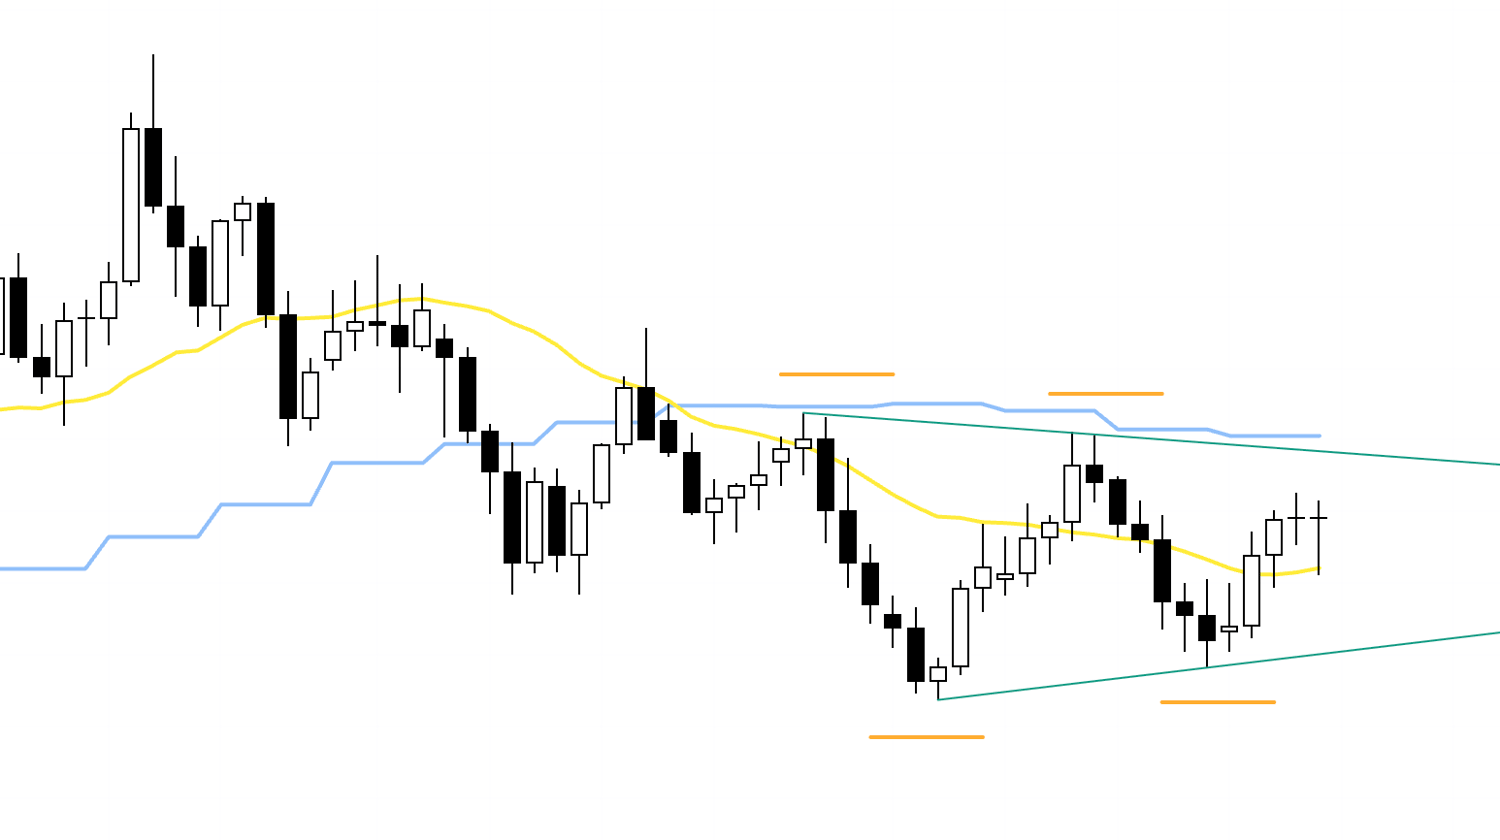
4h

As I wrote in yesterday's Weekly Trade Report, on the 4h chart we have failed to break the most recent low (the orange line) and are instead starting to put in higher lows, so it makes sense to look for trades that ride the daily buy-the-dip move higher.
That said, the upper blue line is also on my radar, so I will only consider longs if an entry sets up with a risk-reward profile that is acceptable at least up to that blue line.
If not, I would rather wait for price to break cleanly above the blue line, then look to enter on a pullback where that line starts to act as support again, using the lower timeframes to trigger entries.
Which way this ultimately plays out is something I will judge in real time as price develops.
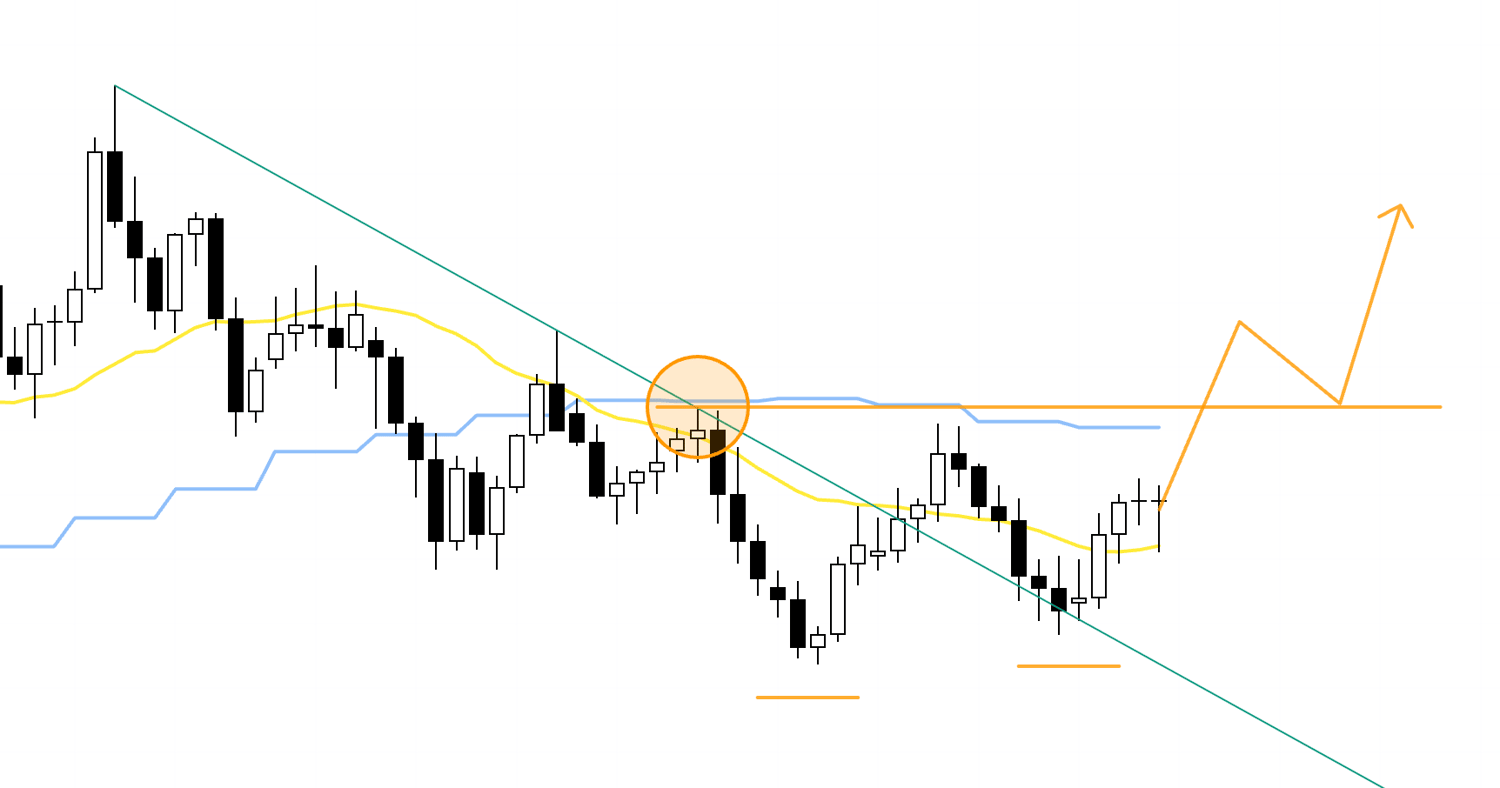
4h
Alternatively, we could see a deeper pullback that still ends up connecting into the daily buy-the-dip continuation.
In that case, if the 4h starts to carve out a fresh higher low and we see price getting supported by tools like the moving averages, I will start considering longs from there.
4h
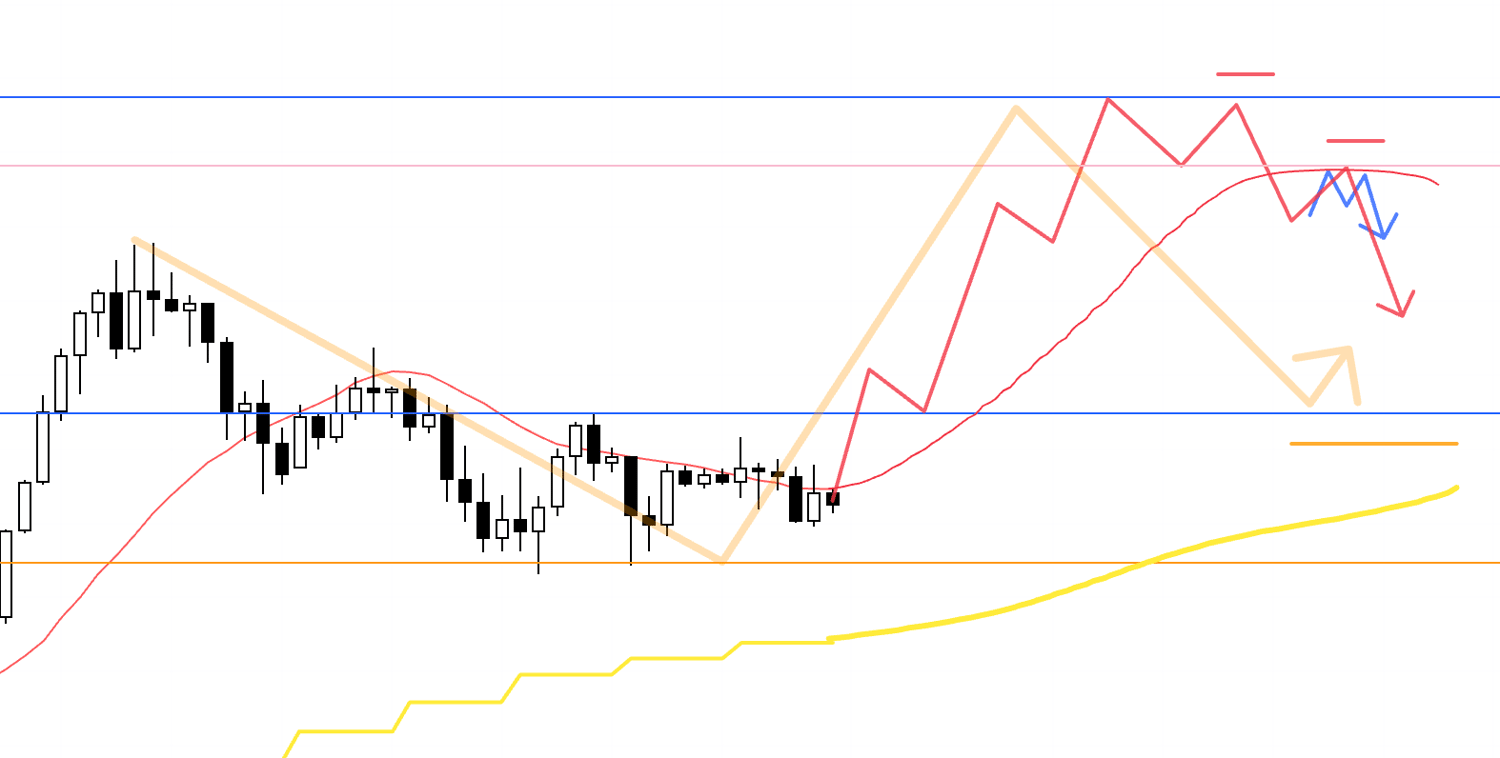
If we do get that next leg up, I will then also be looking at a short scenario that rides the corrective leg down that forms the next buy-the-dip on the daily.
Because this 4h trend reversal to the downside would be counter to the uptrend on the daily, the move would essentially be a mean-reversion leg to close the gap versus the daily moving averages, which means the deeper it sells off, the higher the risk that daily dip buyers step back in.
So the key is whether we can secure an entry as high as possible with a risk-reward profile that makes sense, and once in a position, I will look to lock in partial profits at key levels as price reaches them.
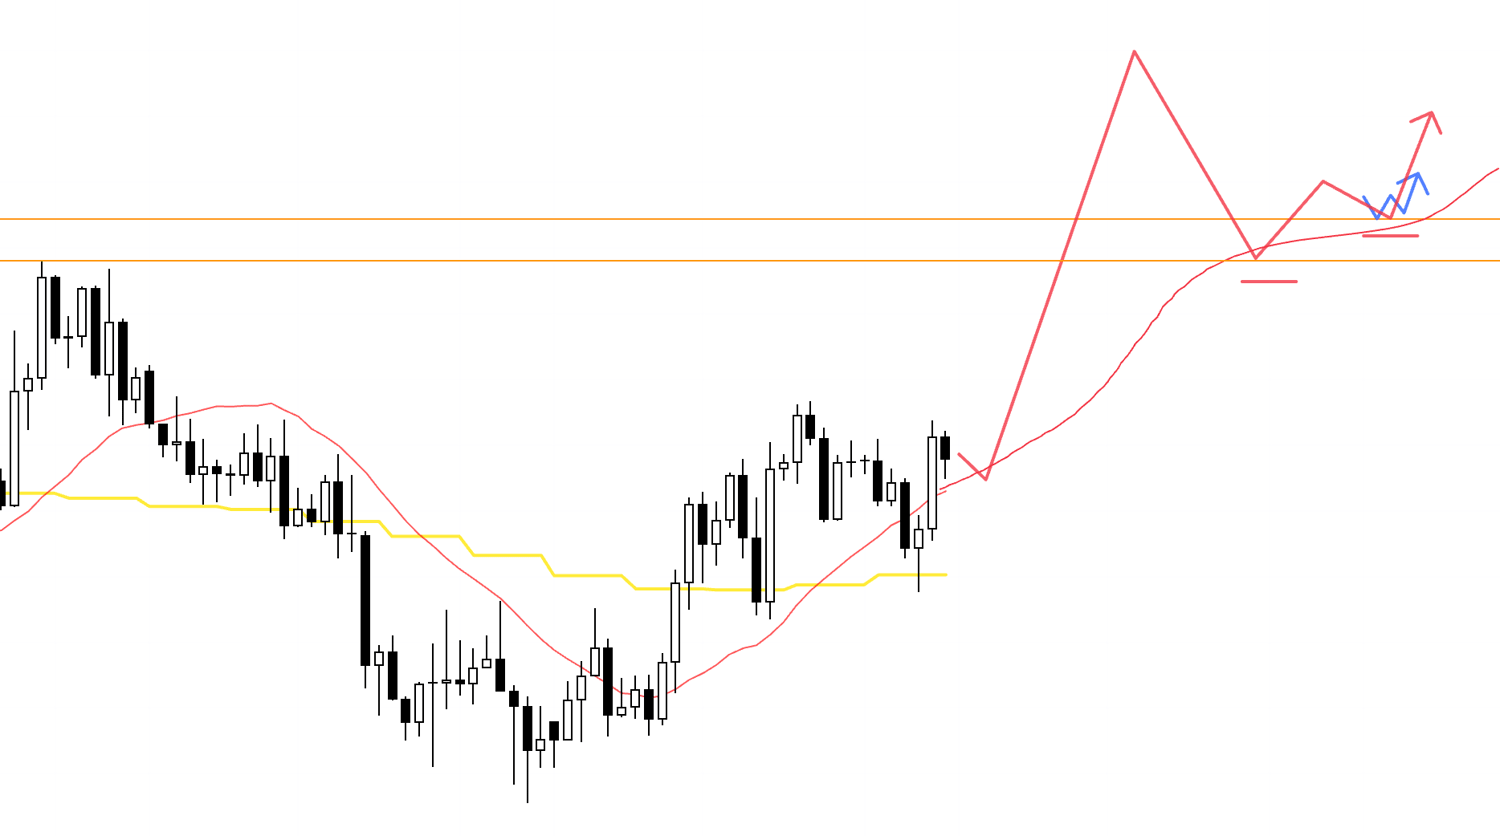
4h
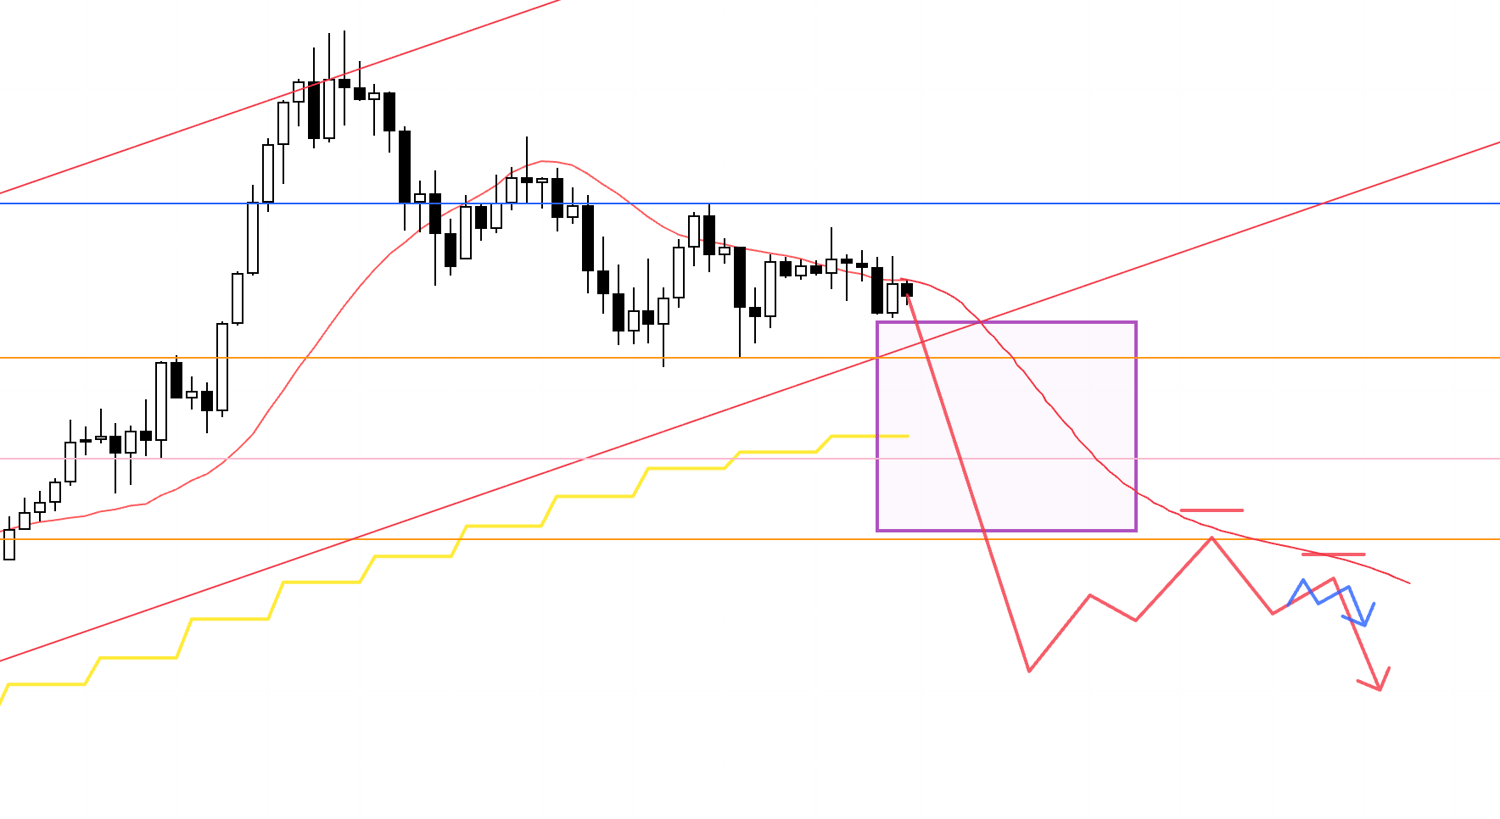
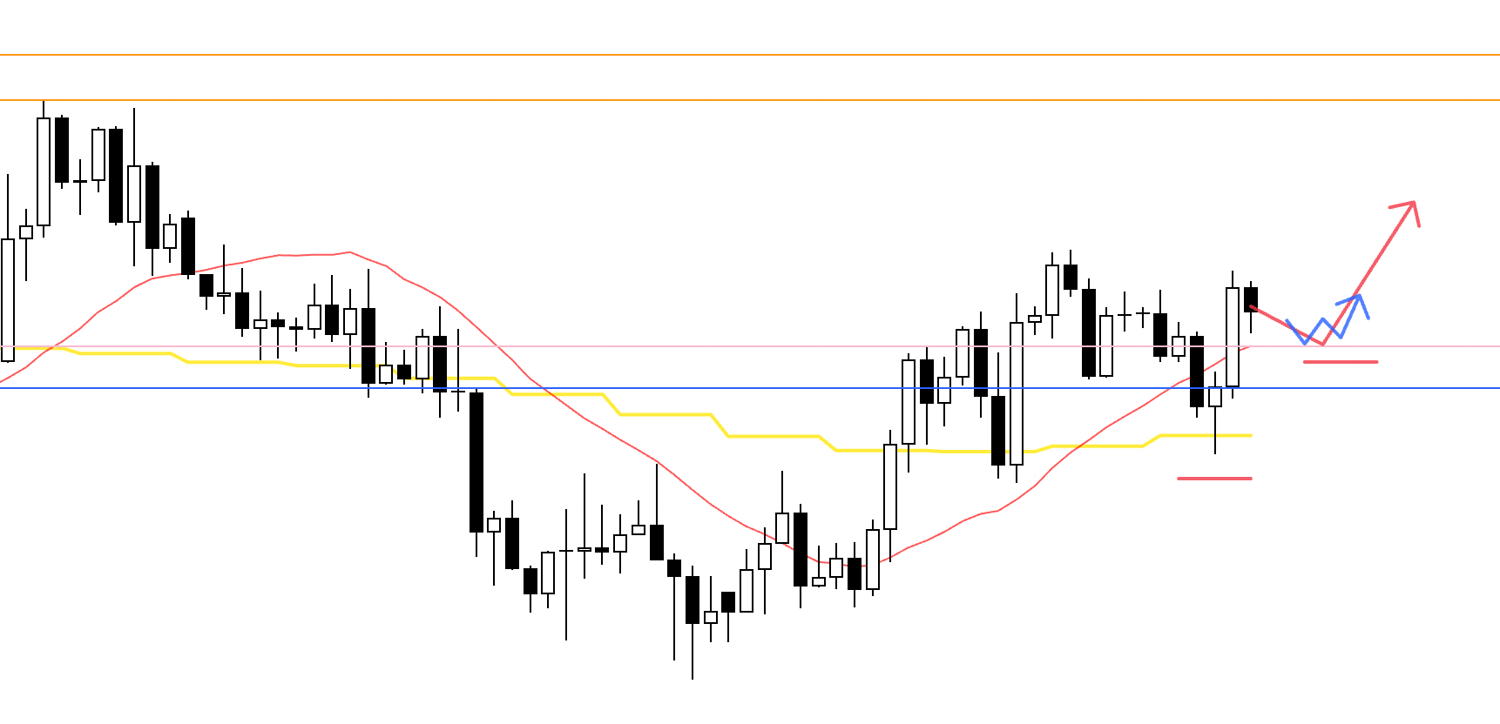
Next, the short scenario.
Right now the daily is in an uptrend, and we are also in an area where buy-the-dip flows are likely to come in, so I have no interest in shorting inside the region marked by the purple box.
If we see price break below the lower orange line and then start forming a lower high on the daily as well, I will look for shorts on the lower timeframes.
With that, let's move on to EURUSD.
〜・〜・〜・〜・〜・〜・〜・
EURUSD
Daily
On the daily we are in a downtrend, with lower highs printing like this, but recently price has failed to make new lows and has broken back above the daily moving averages.
Daily
At the same time, while those lower highs remain in place, we are also starting to see higher lows, which is creating a messy tug-of-war between buyers and sellers.
Daily
The trendline in green, drawn from the high that kicked off the daily downtrend to the high that preceded the lowest low, has already been broken to the upside, and more recently price is also starting to put in higher lows, so I imagine there are traders who see this as an emerging uptrend.
However, because price has still not taken out the previous high (the point inside the orange circle), shorts have not been fully forced out yet.
So, the easiest spot to get long will be the buy-the-dip opportunity that forms after price has broken above these highs and flushed out the selling pressure.
With that in mind, let's drop to the 4h.
4h
On the 4h, if we see the daily shorts getting squeezed out and a fresh higher low forming, that will make it much easier to look for long setups on the lower timeframes.
That said, even the advance required to build out this structure is tradable "if the risk-reward looks good".
Take a look at the following.
4h
On the daily, price is already starting to put in higher lows and looks to be finding support at the moving averages, so when the 4h also starts its uptrend from a higher low like this, I can certainly look for buys from that initial launch point using the lower timeframes.
However, as we have been noting, on the daily we still have what looks like a series of lower highs, and price is compressing from both sides, so if you are going to buy, you need to be fully aware of these risks.
I will be watching to see whether an entry appears with attractive risk-reward, and once in a position I will look to secure partial profits at key levels as price is hit.
4h

As for shorts, I see the area inside this purple box as high risk, so at the moment I have no short scenario.
That said, if an event like an economic data release or major news pushes price through the lower blue line, I will build a fresh short scenario at that time.
That will be something I work out once the week gets underway and I can see how the charts are actually moving.
〜・〜・〜・〜・〜・〜・〜・
That wraps it up.
These are scenarios based on what I am seeing right now, and once the week actually starts I will be watching price action and updating or rebuilding my scenarios as we go.
Most of the work in trading is effectively finished at the scenario-building stage.
Because at this stage you have already decided "where the risks are lurking, what needs to happen for an edge to appear, and how you will act when it does", all that remains is to execute when the market delivers that setup.
Conversely, it is precisely when you neglect this scenario-building process that your actions become fuzzy, you open your charts and feel lost, you look back and regret your decisions, or you fail to wait because you do not know exactly what you are waiting for and every little move on the screen starts to look like an opportunity.
Even in my backtesting and practice phases, I spend real time building scenarios just as I would for live trades, and then I simply execute them and measure the expectancy of repeating that same behaviour.
So rather than saying I am "testing the rules of a strategy", it is probably more accurate to say that I am "testing whether my own scenario-building has positive expectancy".
Because I have done this thoroughly, I am able to keep following the scenarios I build with genuine conviction.
These trade scenarios are nothing more than my own plans, so if you are still in the process of figuring out how you want to trade, feel free to use them as one reference point when you build your own strategy.
But if your own trading approach is already firmly in place, then please do not let my trade plans distract you and stay fully committed to your own rules.
Thank you for reading to the end.