


Hello.
I’m laying out trade scenarios for the week ahead.
I publish this “Trade Scenarios” post every Sunday.
And every Saturday I post a “Weekly Trade Report” detailing how I thought through and executed trades over the prior week.
Read together with the scenario post, it should give you a practitioner‑level, end‑to‑end view of how I prepare in advance, what I wait for, and how I execute.
For the underlying strategy, please see my posts on Dow Theory and multi‑timeframe analysis.
A scenario is not a forecast.
It’s my personal if‑then plan: if this happens, I’ll do that.
I don’t predict markets, and this is not an attempt to do so, so please understand that up front.
This is not a directive to buy or sell, nor does it provide signals.
It does not guarantee future profits, and is offered strictly for educational purposes to illustrate the consistent process I run.
I cannot assume responsibility for any outcome of your trades, so please trade at your own risk.
Let’s start with USDJPY.
(On my charts, orange denotes the daily, red the 4h, blue the 1h, and green the 15m price action.)
〜・〜・〜・〜・〜・〜・〜・〜・〜・〜・〜・〜・〜・〜・
USDJPY
Weekly
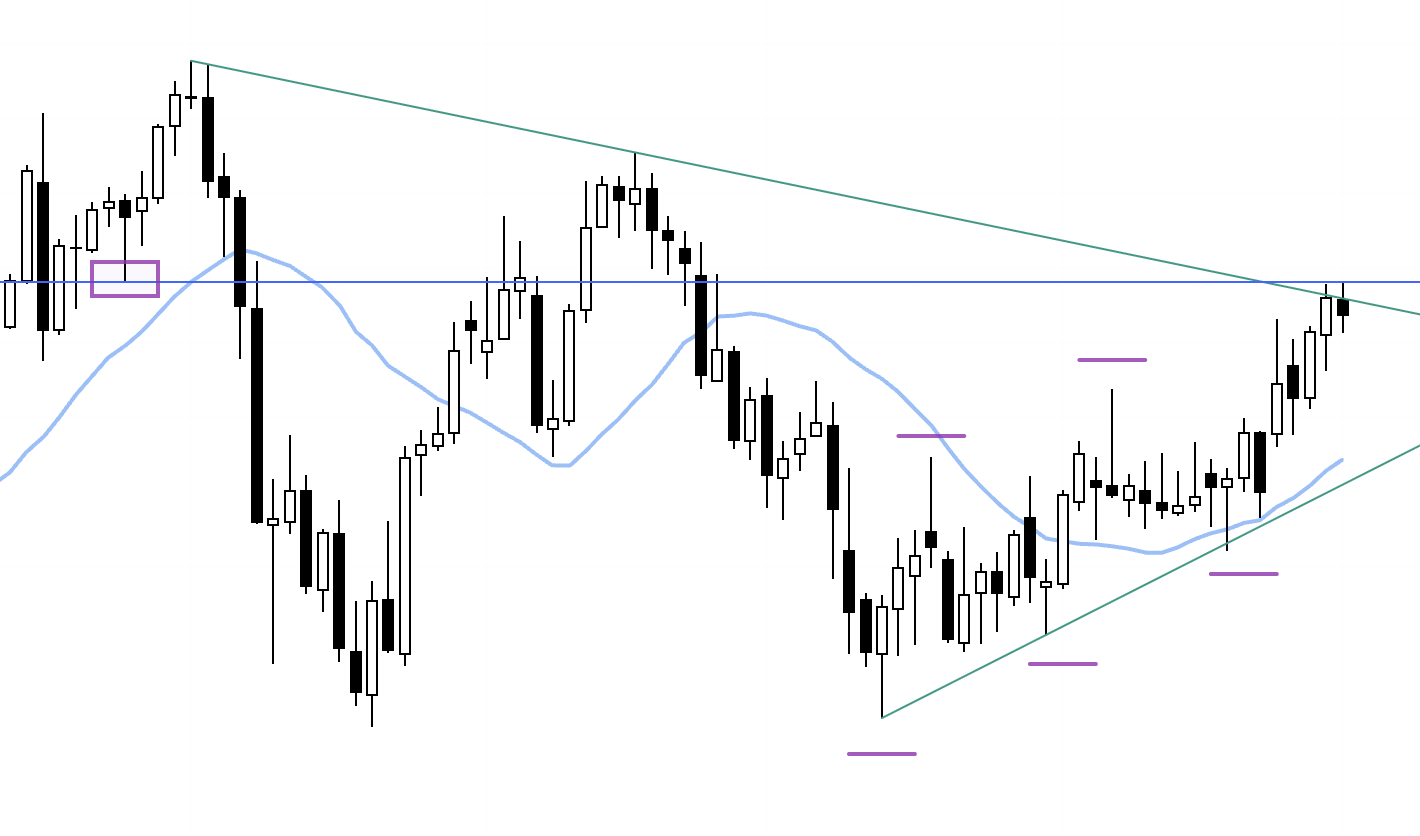
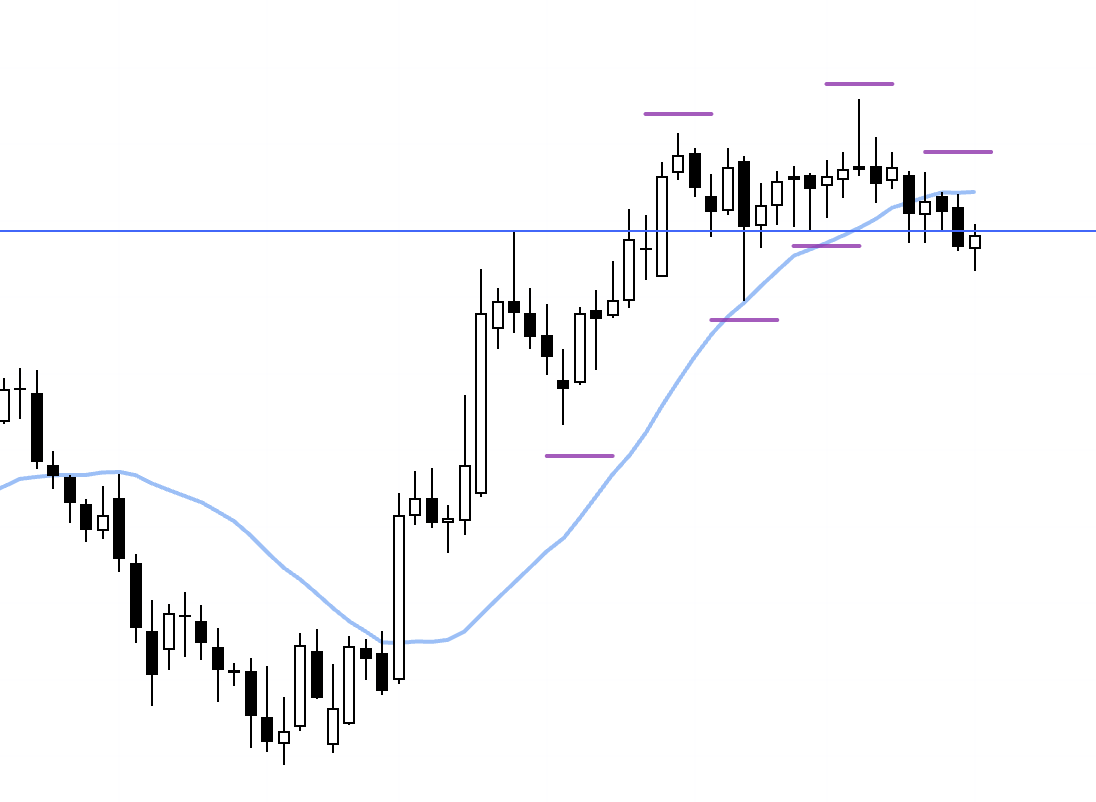
On the weekly, price remains in an uptrend, printing higher lows and higher highs, but it is capped by a blue line drawn from prior lows and by a green descending trendline that can be drawn from the lower‑high sequence on the monthly chart.
From here, I’m assessing whether price punches through these lines and extends the uptrend, or instead rolls into a pullback that builds out the dip.
In either case, I want to map scenarios that identify levels where longs have edge and levels where shorts have edge.
With that in mind, let’s look at the daily.
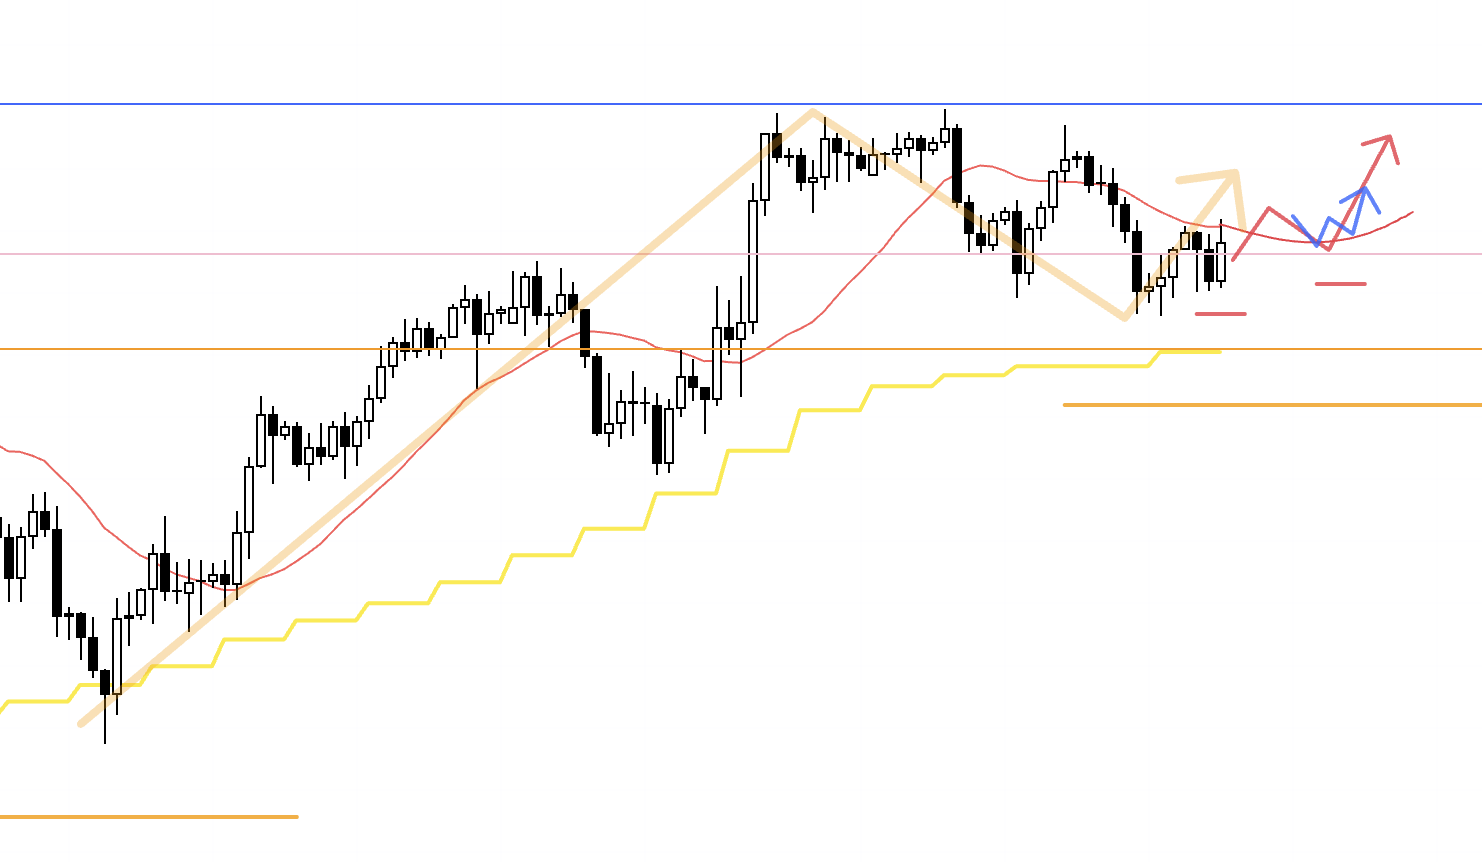
Daily
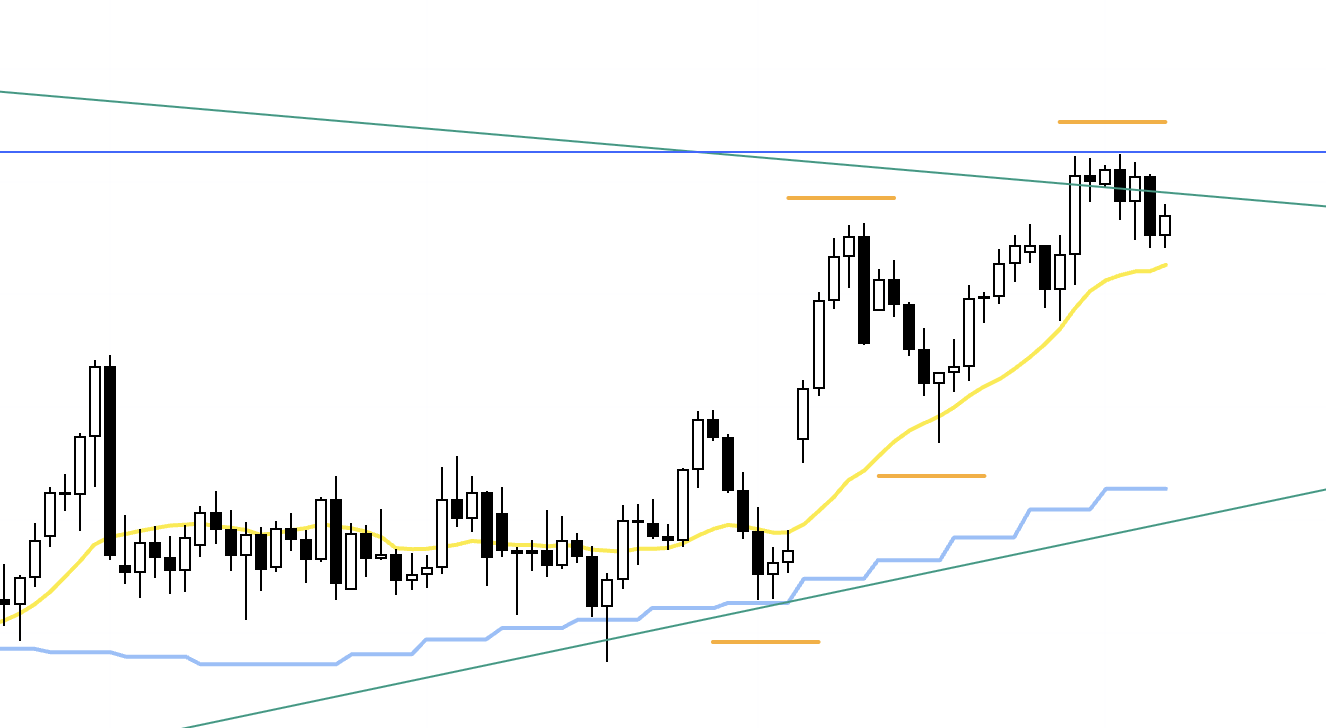
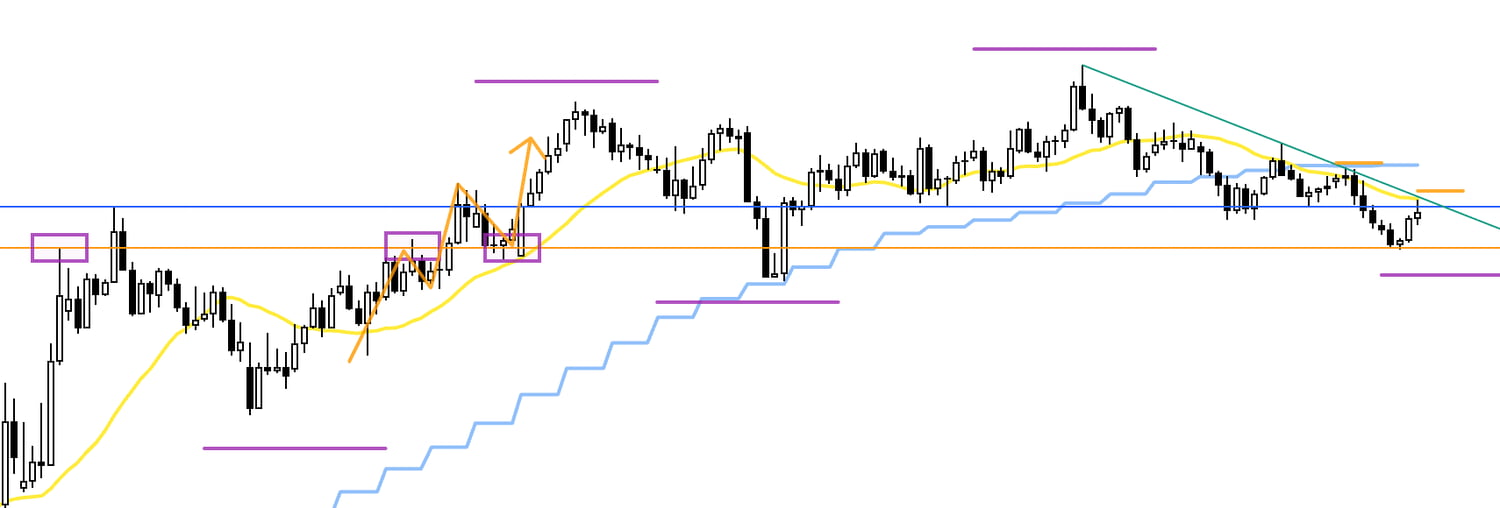
The daily is also trending higher with higher lows and higher highs, but we are currently in a pullback‑buy zone, and the moving averages just below are acting as support, so shorts require caution.
For longs, price is capped by the blue line, so failure risk must be accounted for, and the key is whether an entry can be structured with acceptable risk‑reward.
Daily
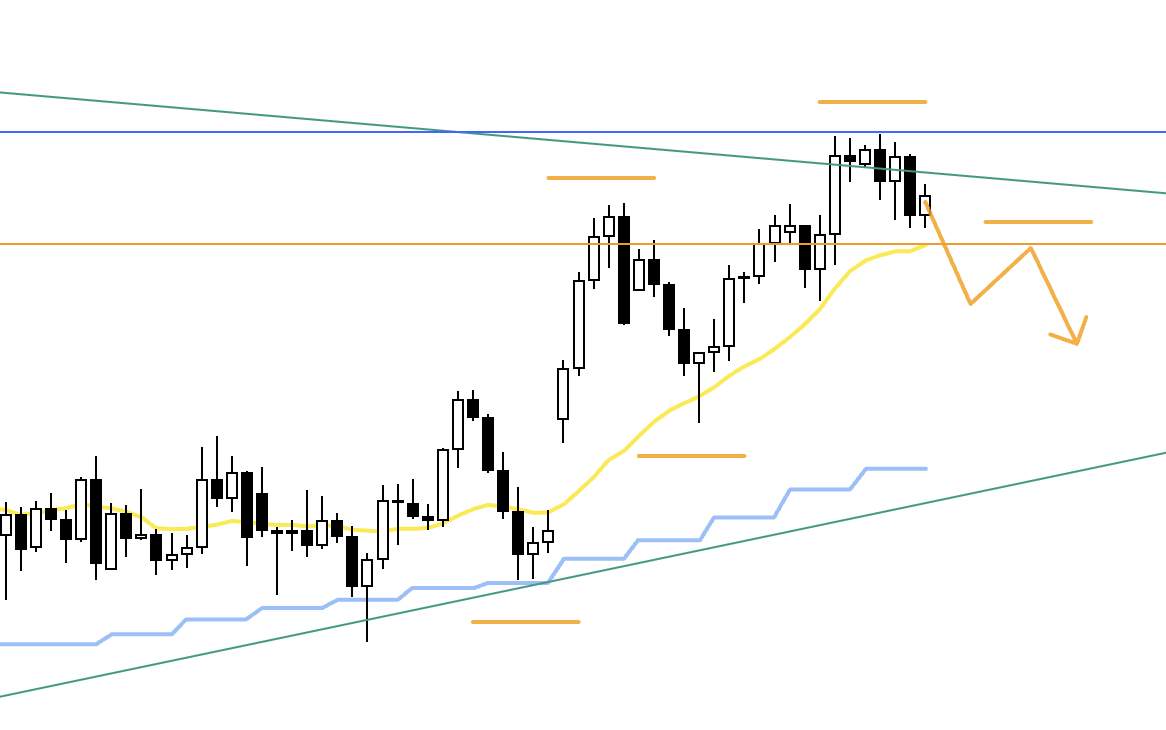
If short, I want to wait for a clear lower‑high pivot to form.
If long, I’m looking for a push that fills the room up to the overhead blue line.
Now to the 4h.
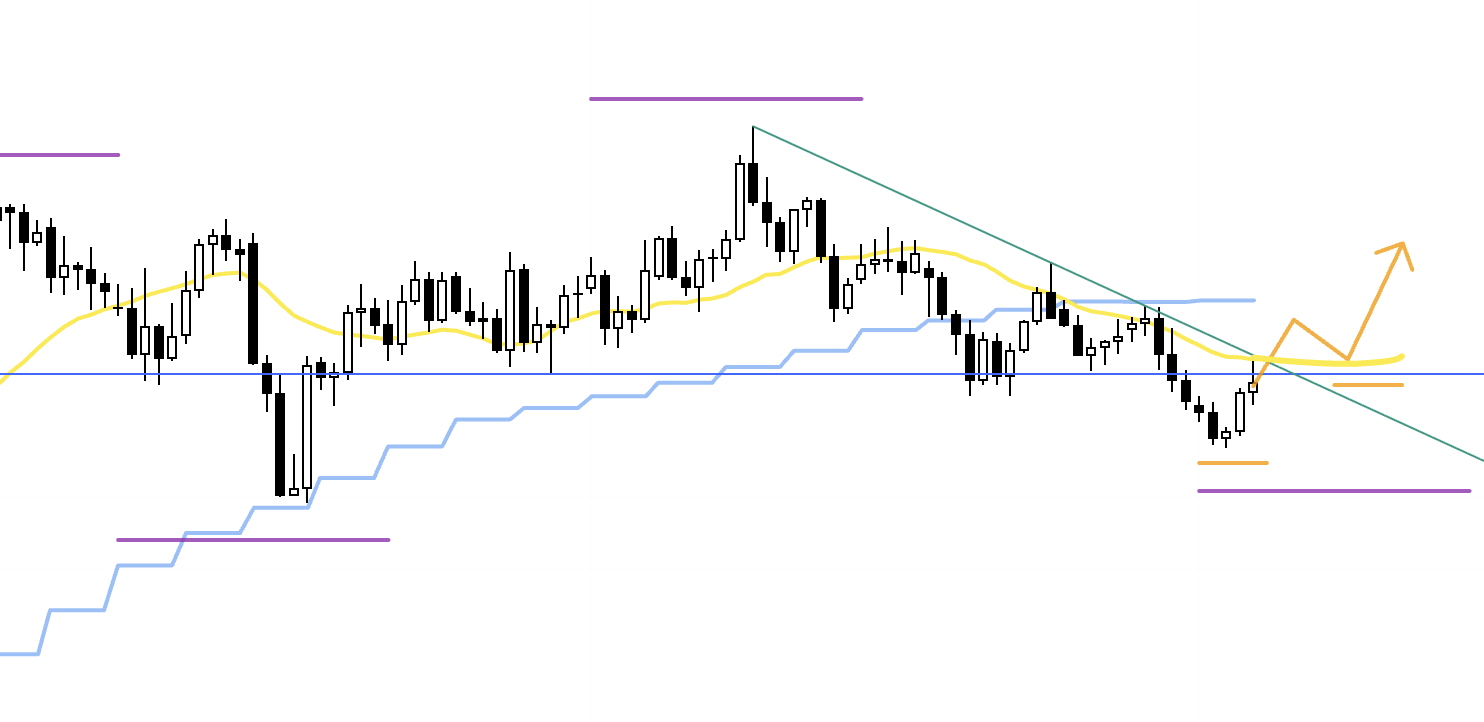
4h
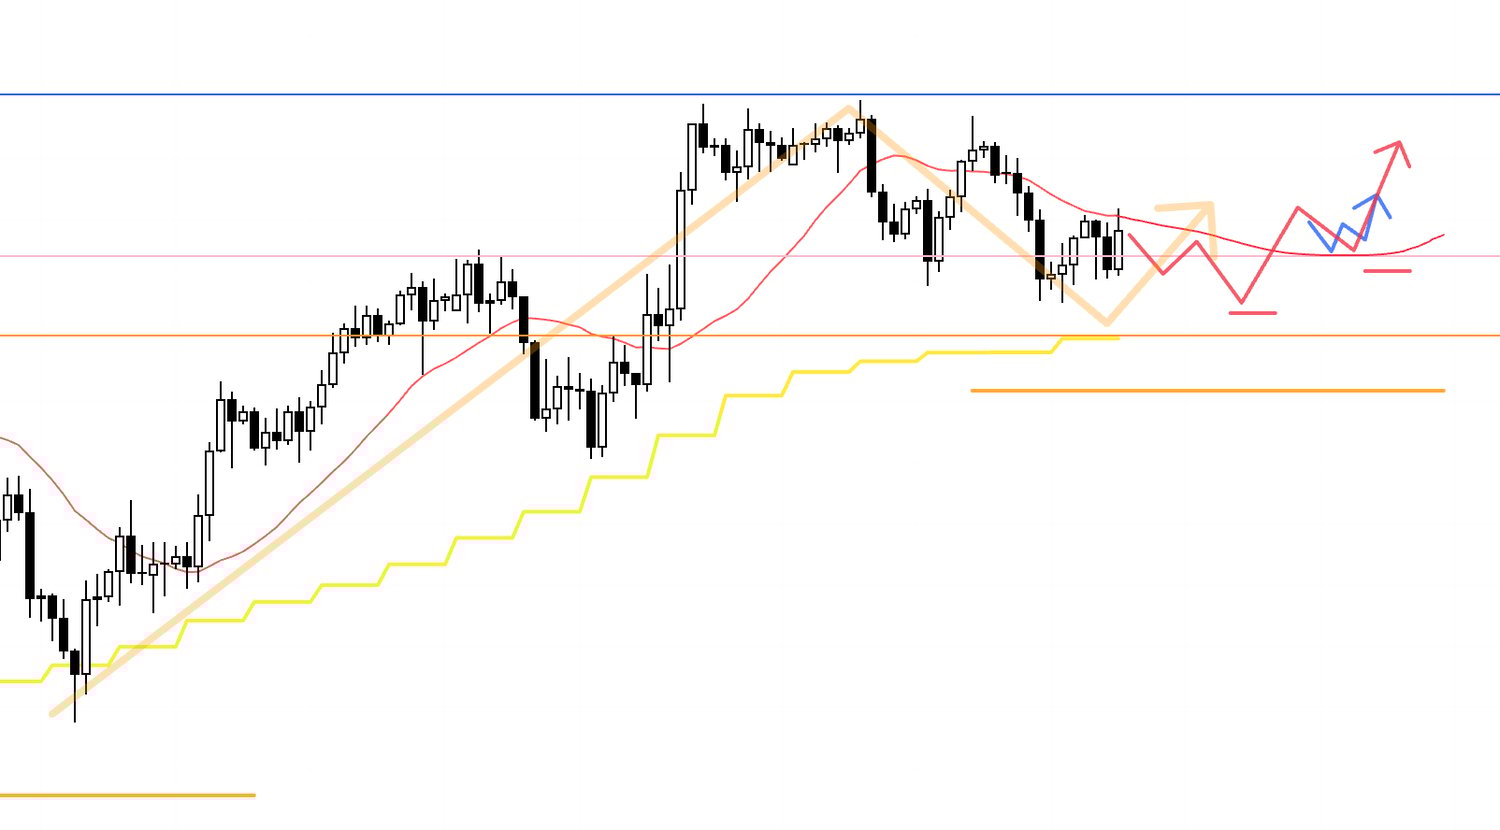
For longs, I want the 4h to build another higher‑low pivot and then lift as the daily pullback buy engages, at which point I’ll refine entries on lower timeframes.
If the overhead blue line is too close and the risk‑reward is unattractive, I’ll pass.
4h
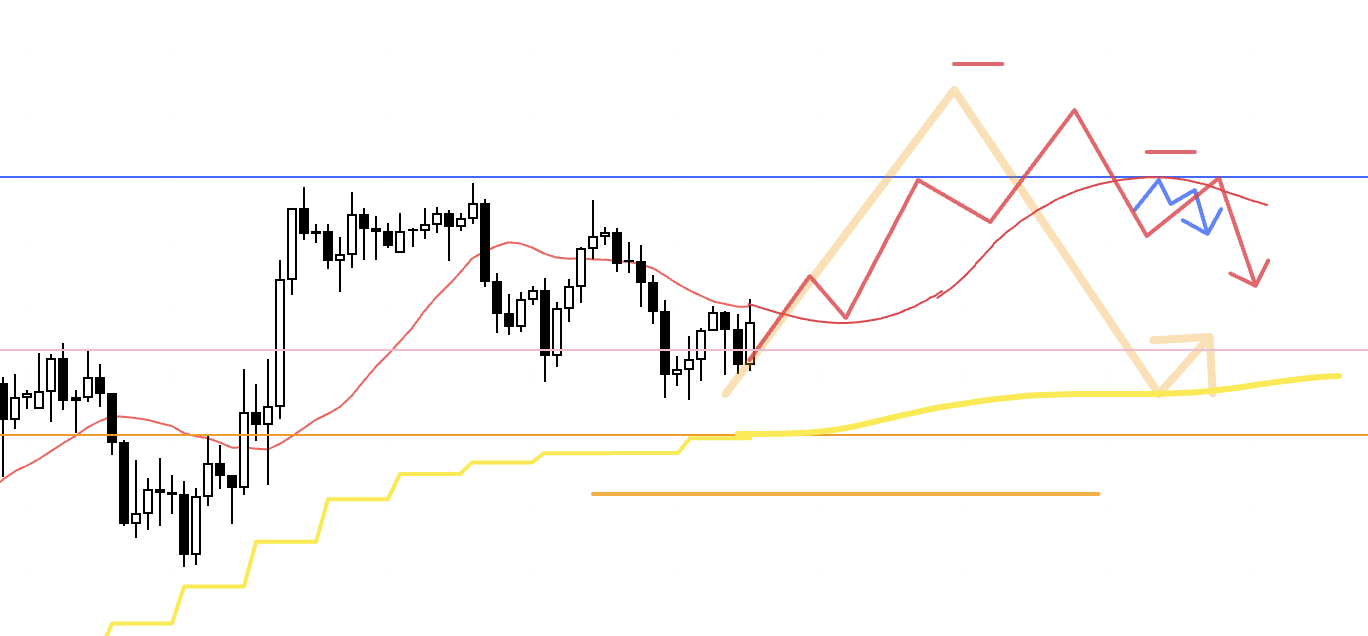
If price ultimately fails to clear the blue line and the 4h rolls into a lower‑high against it, I’ll consider shorts from the lower timeframes.
Because the daily has already posted a fresh high, dips may attract pullback‑buy flows as price gets cheaper, so the focus is on securing entries as high as possible with favorable risk‑reward.
If I’m in a short, I’ll look to secure half the profit around the pink line.
4h
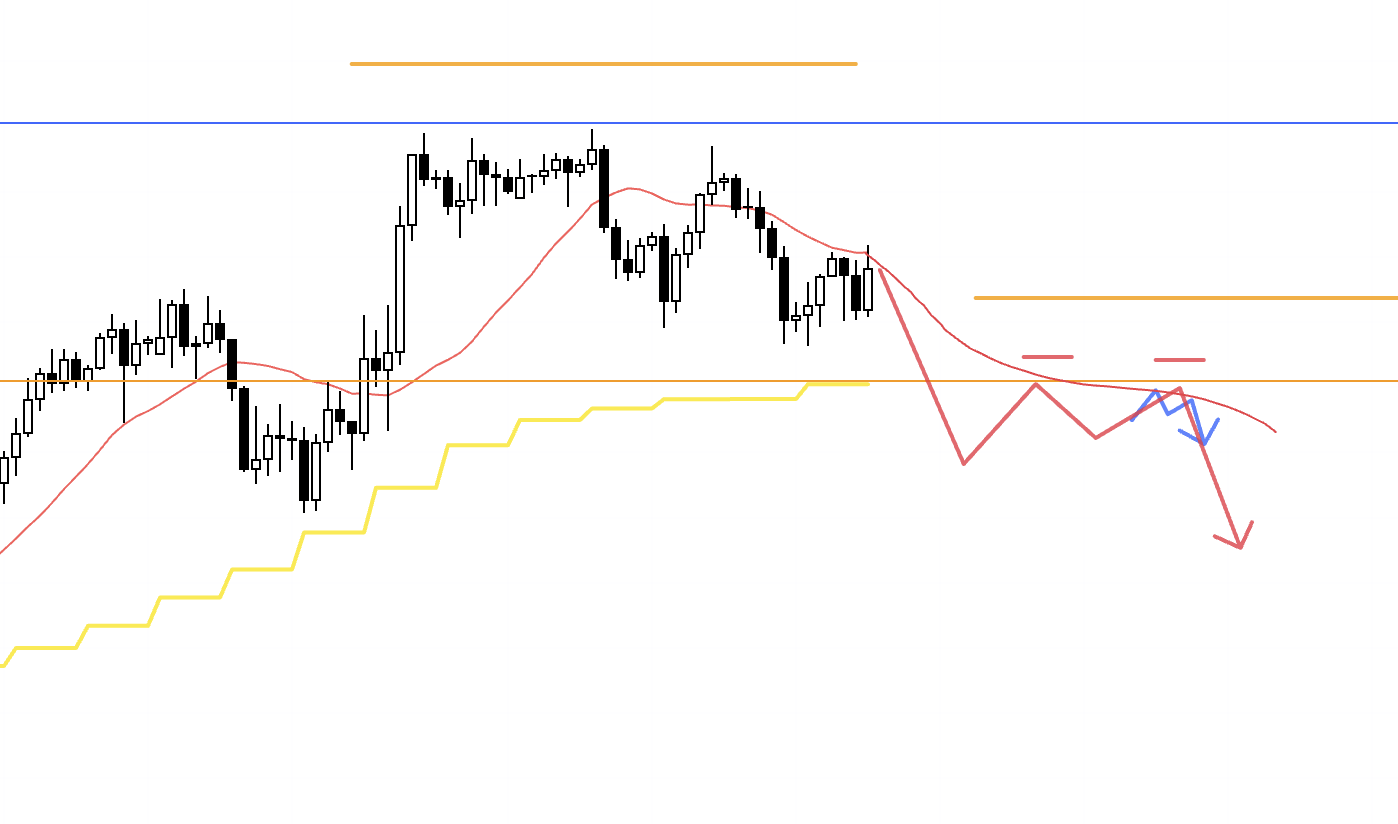
Given the daily remains in an uptrend, I would only turn more aggressive on shorts if price first breaks below the daily moving averages (yellow) and forms a new daily lower‑high structure, with the 4h also carving a lower‑high within it, after which I’ll look to enter using the lower timeframes.
Next, EURUSD.
〜・〜・〜・〜・〜・〜・〜・〜・〜・〜・〜・〜・〜・〜・
EURUSD
Weekly
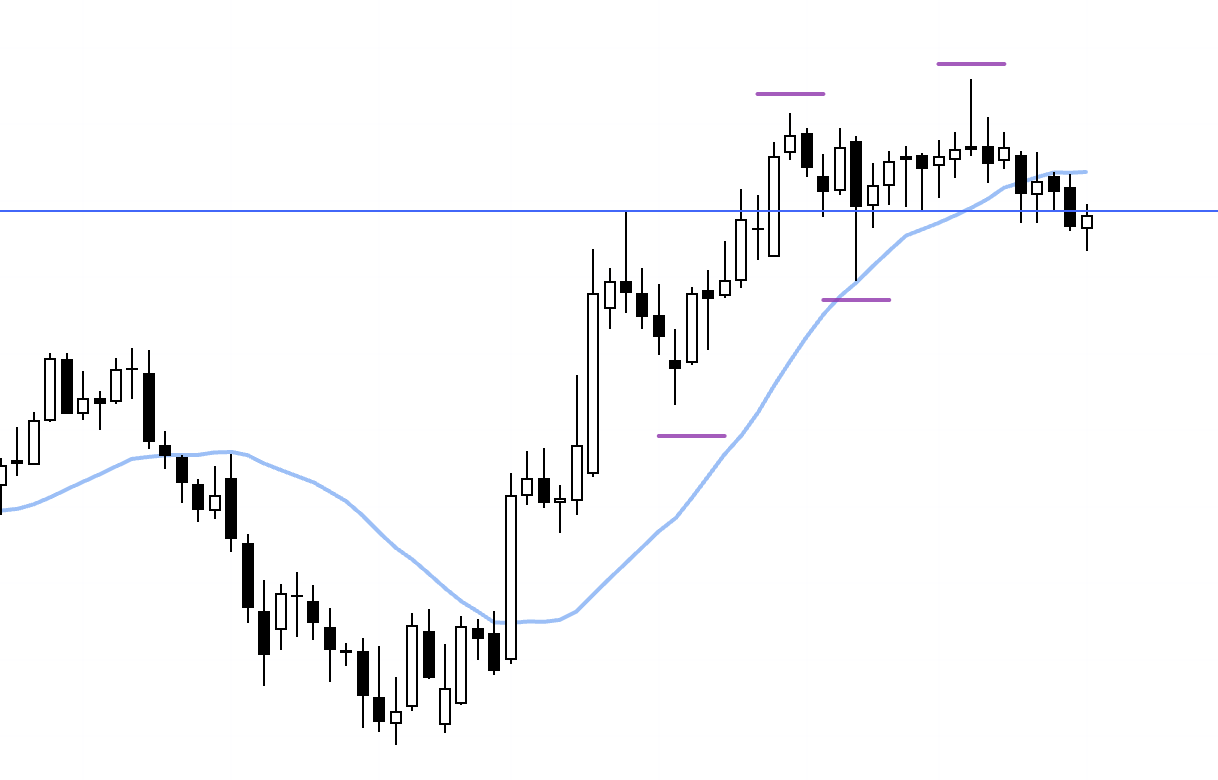
On the weekly, price has been in an uptrend with higher lows and higher highs, but it has slipped below a support line that had been working, and it is now showing signs of being capped from above by the weekly moving average (light blue).
Whether traders treat this blue line as the weekly swing low is a point of disagreement.
Weekly
Some traders do recognize this blue line as the weekly low, and if we accept that definition, then that low has clearly been broken, which would mark an end to the weekly uptrend and a turn into a downtrend.
That said, the most recent lower‑high pivot is quite marginal and not especially clear.
Ambiguous charts like this are common, where interpretation varies by trader.
What matters is not “which interpretation is correct” or “who is right,” but “how the majority will see it and how they will act.”
So rather than anchoring to my own opinion, I’ll build scenarios on the premise that “this other path is still possible.”
In other words, I have not completely discarded the case for a weekly pullback buy, and I’ll craft scenarios while observing the price action around the blue line.
Daily
For example, if the daily downtrend ends and price forms a higher‑low pivot again supported by the blue line, I’ll look to buy on the lower timeframes.
Let’s check the 4h.
4h
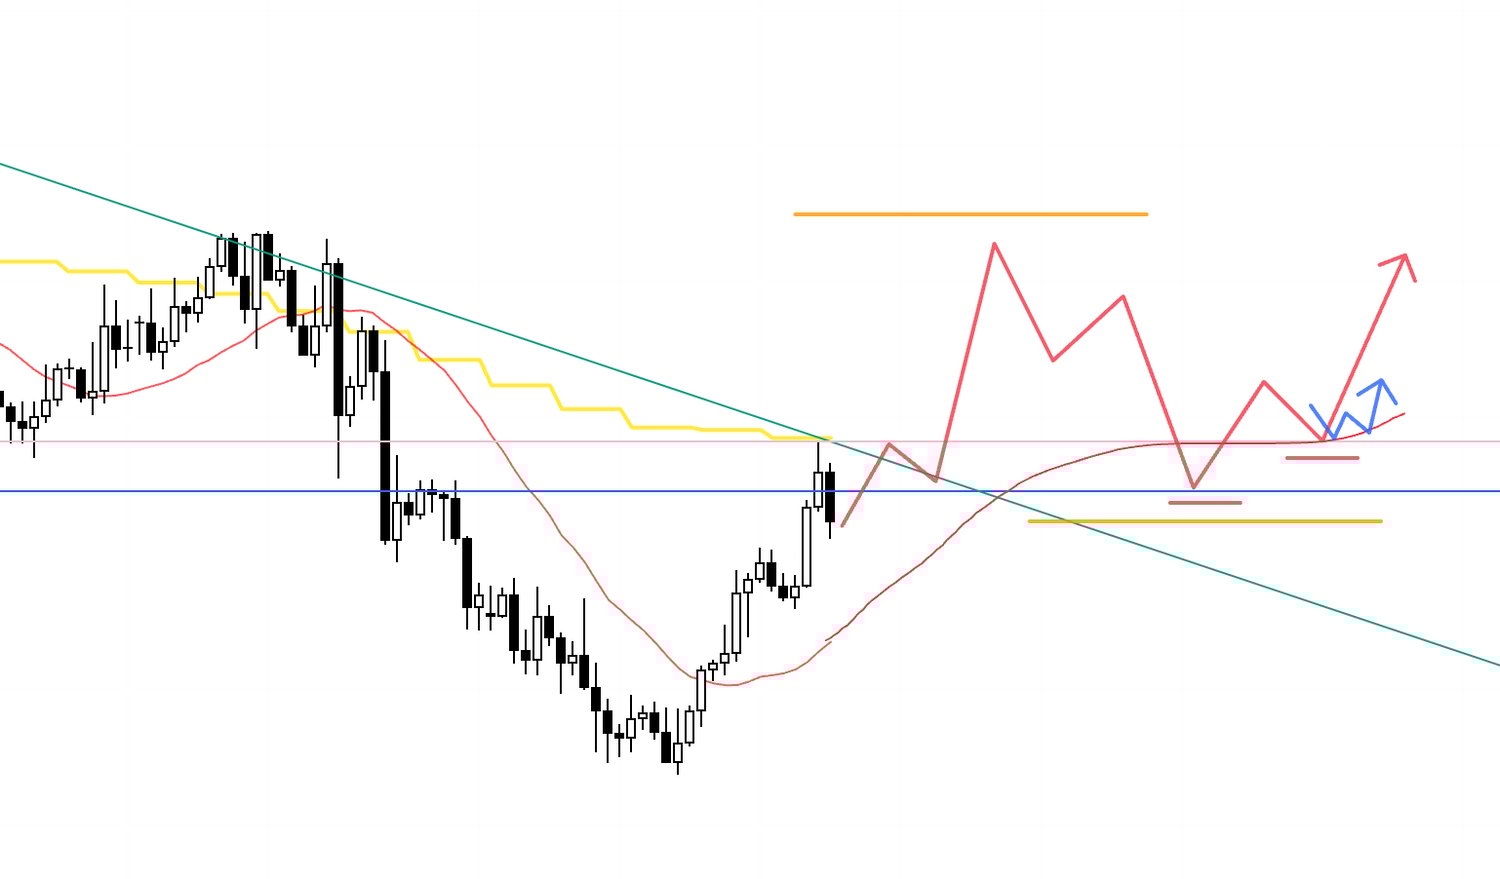
I don’t know how the price will actually move, but if we form a new daily higher‑low and, supported by the blue line, the 4h also carves out a higher‑low, I’ll then consider longs on still lower timeframes.
4h
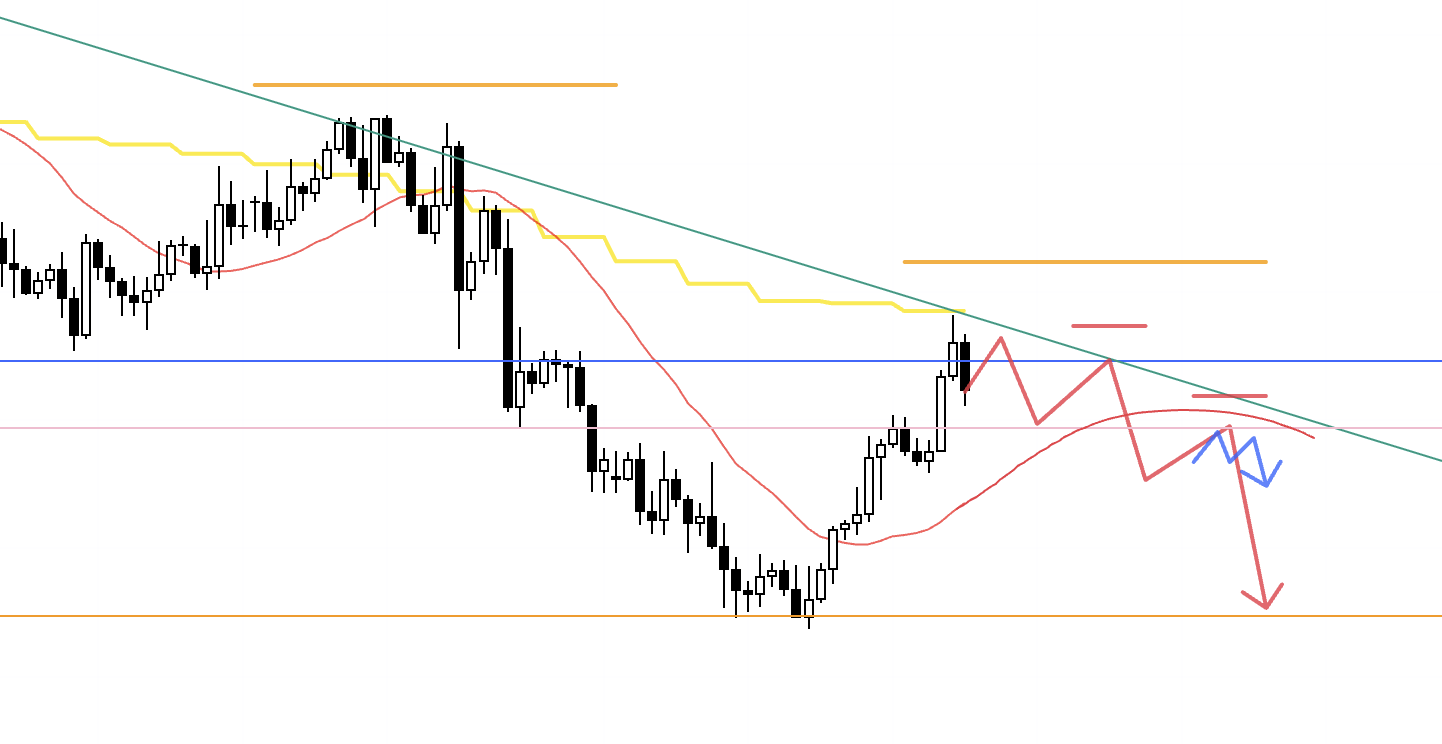
Conversely, if price cannot break above the blue line or the green trendline and instead rolls into lower highs beneath them, I’ll follow that move as a daily sell‑the‑rally.
However, in that case, the 4h moving averages are currently lending support from below, and the 4h has been trending up with higher lows and higher highs, so a mere touch of the green trendline or blue line is not an immediate sell.
I will wait for a 4h lower‑high to form and/or a decisive break below the moving averages.
This 4h uptrend is the ascent that forms the daily corrective rally, so the very first 4h trend‑change to down is the earliest entry for the daily sell‑the‑rally.
I want to be patient and target that specific pivot.
Also note that the prior daily low reacted cleanly at the orange line, which historically separated daily buyers and sellers, so if you hold the view that the weekly trend is still up, take care around that orange‑line area.
If holding a short, I’ll look to secure half the profit near that line.
Let’s confirm the orange line on a rescaled daily for clarity.
See below.
Daily
It’s a line you can draw off prior highs, where resistance has flipped to support, and the latest low appears to have respected it.
Therefore, if you allow for the possibility that the weekly pullback buy is still in play, the orange line is a level to treat with caution on the short side.
〜・〜・〜・〜・〜・〜・〜・〜・〜・〜・〜・〜・〜・〜・
That’s all for now.
These are scenarios as of today, and I’ll update or rebuild them as the week actually unfolds and the tape reveals itself.
Sketching scenarios on the blank right‑hand side of a chart may look easy, but it’s a demanding skill.
This is not a prediction of how the chart will move, but an action plan that states, “if this happens, I’ll do that.”
It’s not helpful to think “this has to happen” or “it has to reverse at this line.”
You must also define what it means if it doesn’t happen, and how you will respond if it doesn’t, and every action needs to have statistical edge.
I don’t read charts as mere shapes.
I’m constantly imagining how traders on other timeframes see things, which highs would unlock fresh orders, where stop orders are likely clustered, and what any given move would mean to higher‑timeframe participants.
For example, if I were trading the daily, I might be thinking, “I’m still in with a trailing stop, so I won’t exit unless this low breaks,” and conversely, “If that low breaks, the uptrend is finished and I’ll exit,” and I map where orders from each timeframe are likely to concentrate.
I’ve written previously about these order‑concentration zones and the points where one timeframe’s orders cascade into another, so feel free to have a look.
These trade scenarios are my personal plan.
If your approach is not yet fixed, by all means use them as reference for building your own strategy, but if your method is already well‑defined, don’t let my plan distract you from following your rules.
Thanks for reading to the end.