

In this report, I will review the key points of my trading this week, focusing on the actual trades I took.
This “Weekly Trade Report” is posted every Saturday.
If you read it together with the ”Trade Scenarios” I publish every Sunday, you can see how I think in advance and how I then execute in line with those scenarios in real time.
This is not advice telling you “this is how you should trade,” nor am I claiming this is the correct answer.
It is not about showcasing individual wins or losses, nor about recommending any specific strategy based on those results.
Its purpose is to show, in practical terms, how I repeatedly follow a scenario-based process with consistency, so that you can use it as a reference when building your own strategy and your own process discipline.
All results shown are solely my personal outcomes and do not guarantee any future profits on your part.
Please keep that firmly in mind, and make sure you conduct your own testing and preparation, and trade entirely at your own risk and responsibility.
My approach is trading pullbacks on the 4h timeframe: buying dips and selling rallies.
For details on my pullback and rally strategies, please refer to my previous posts on Dow Theory and multi‑timeframe analysis.
Now, let’s look at the charts.
USDJPY 4h
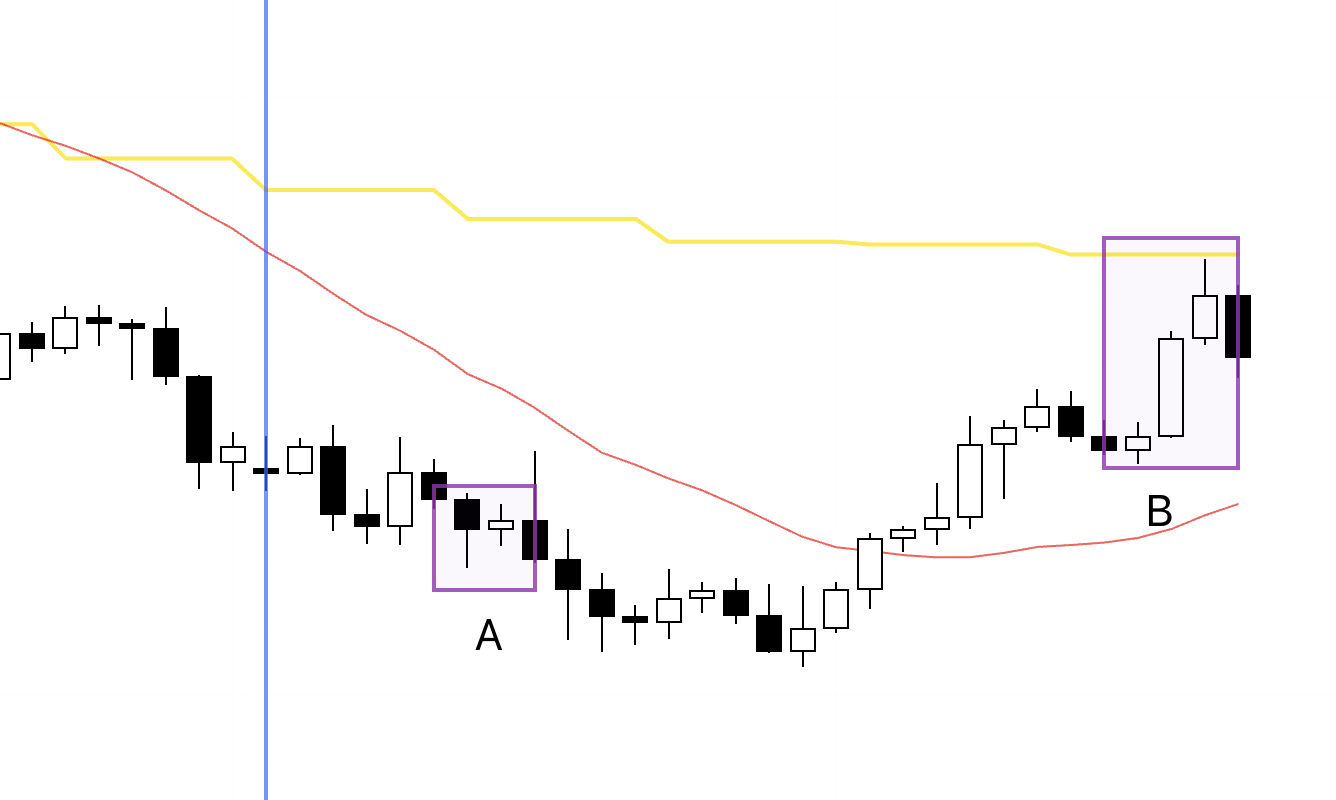
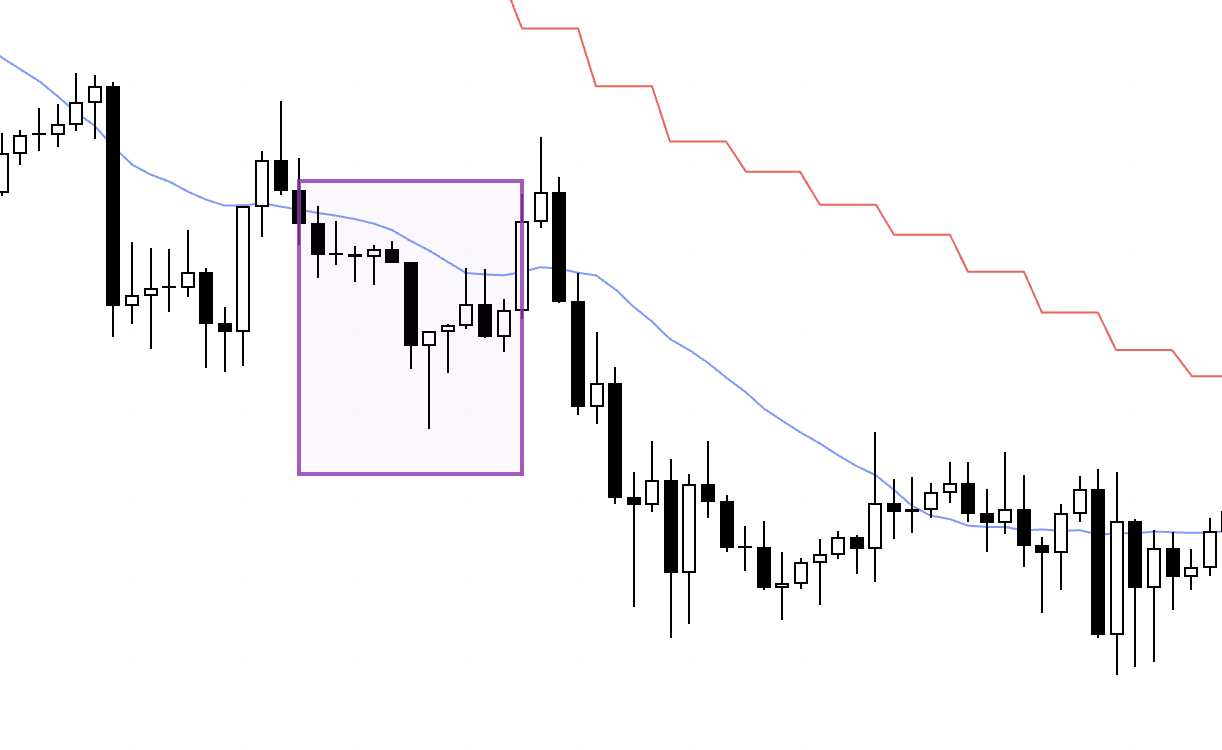
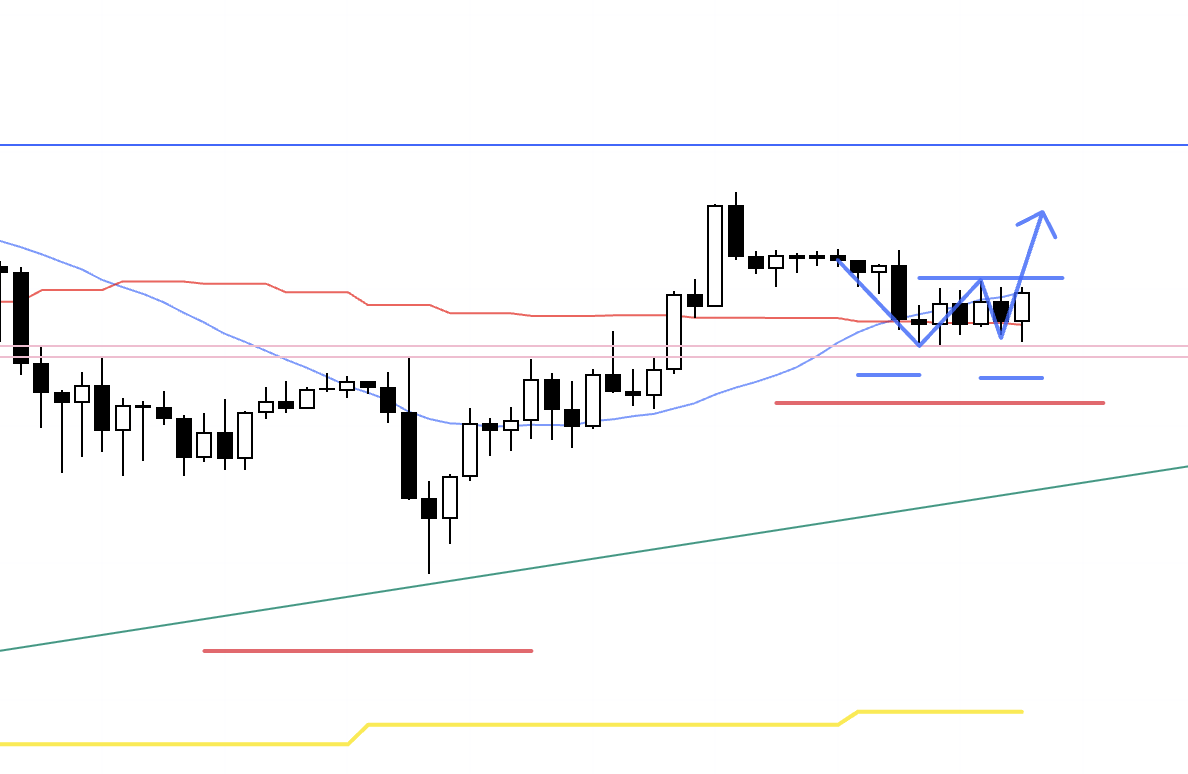
This is the USDJPY 4h chart.
This week’s price action is the portion to the right of the blue vertical line.
I was watching for a pullback buy in the boxed area on USDJPY, but my entry criteria were not met, so I did not take a trade.
I recorded the sequence in real time, from placing the order through cancellation; I will show that later.
Next, let’s look at the EURUSD chart.
EURUSD 4h

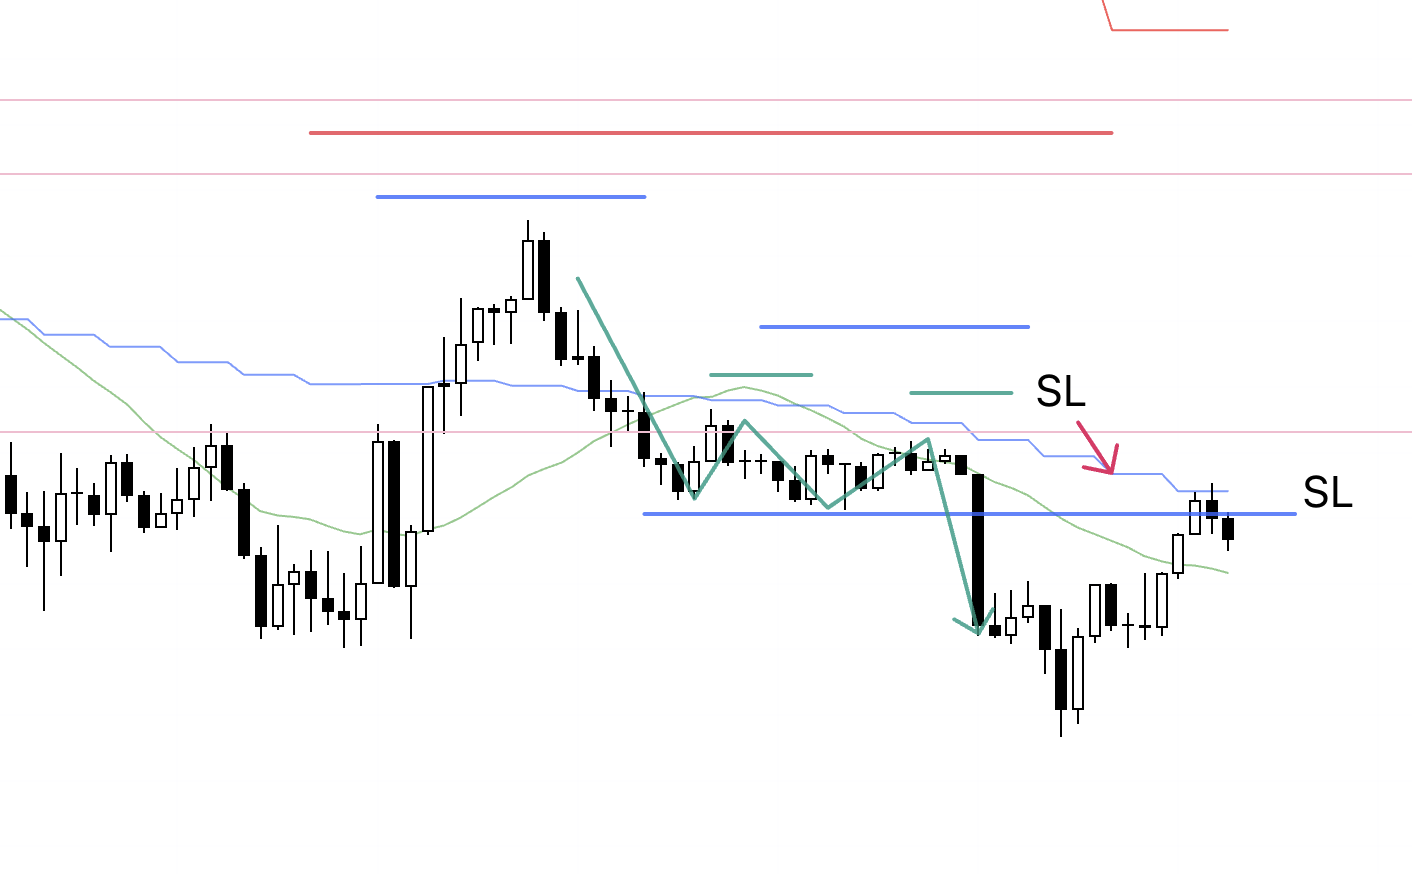
This is the EURUSD 4h chart.
Two of the scenarios I outlined on Sunday played out during the week.
I executed setup A, while setup B did not meet my conditions and was skipped.
For setup A, I captured screenshots in real time while trading, which I will show below.
〜・〜・〜・〜・〜・〜・〜・〜・〜・〜・〜・〜・〜・〜・
Tuesday, November 4
EURUSD
4h chart from Sunday’s scenario blog
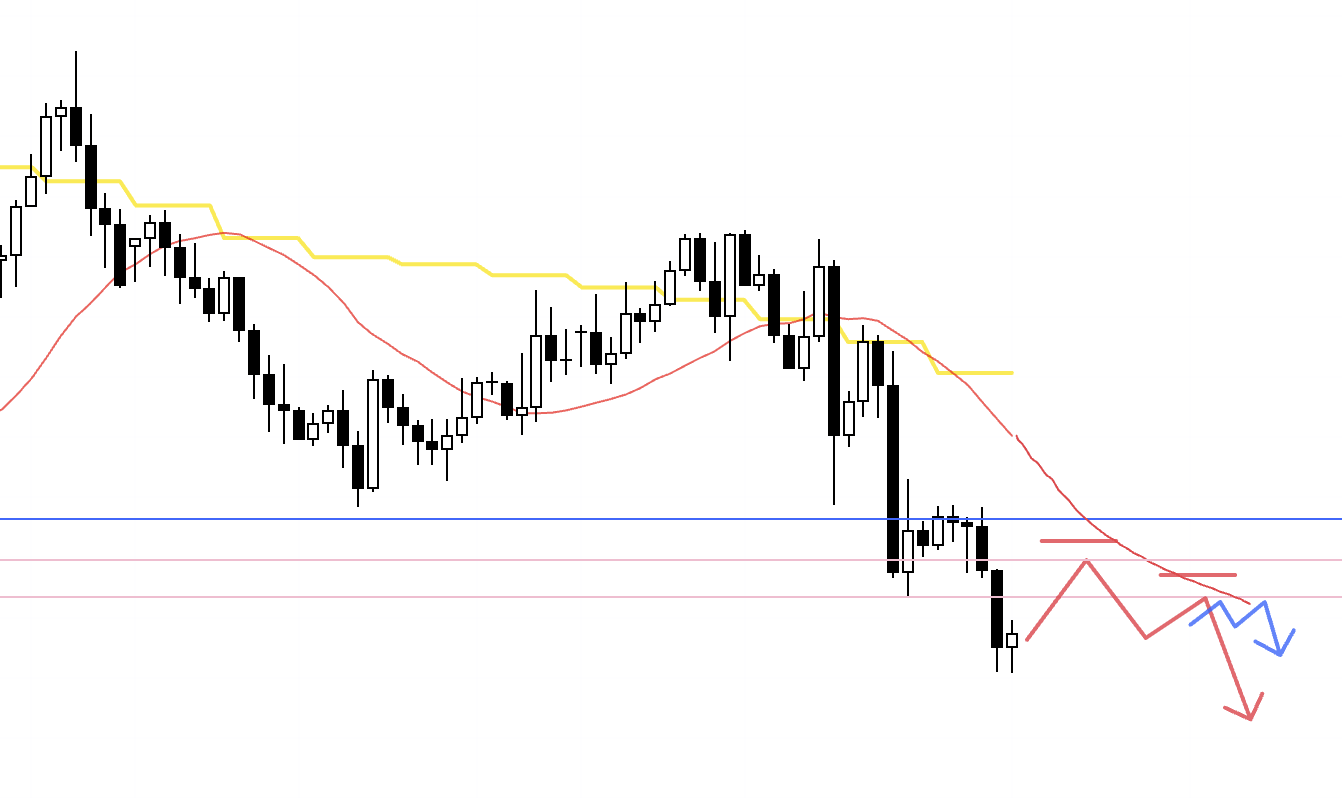
This is the 4h chart from last Sunday’s scenario blog.
Last week ended with price breaking below the blue line marking the weekly pullback buy zone, creating an environment where shorts became attractive.
So my scenario was:
if the 4h formed another lower high, I would then look for shorts on a lower timeframe.
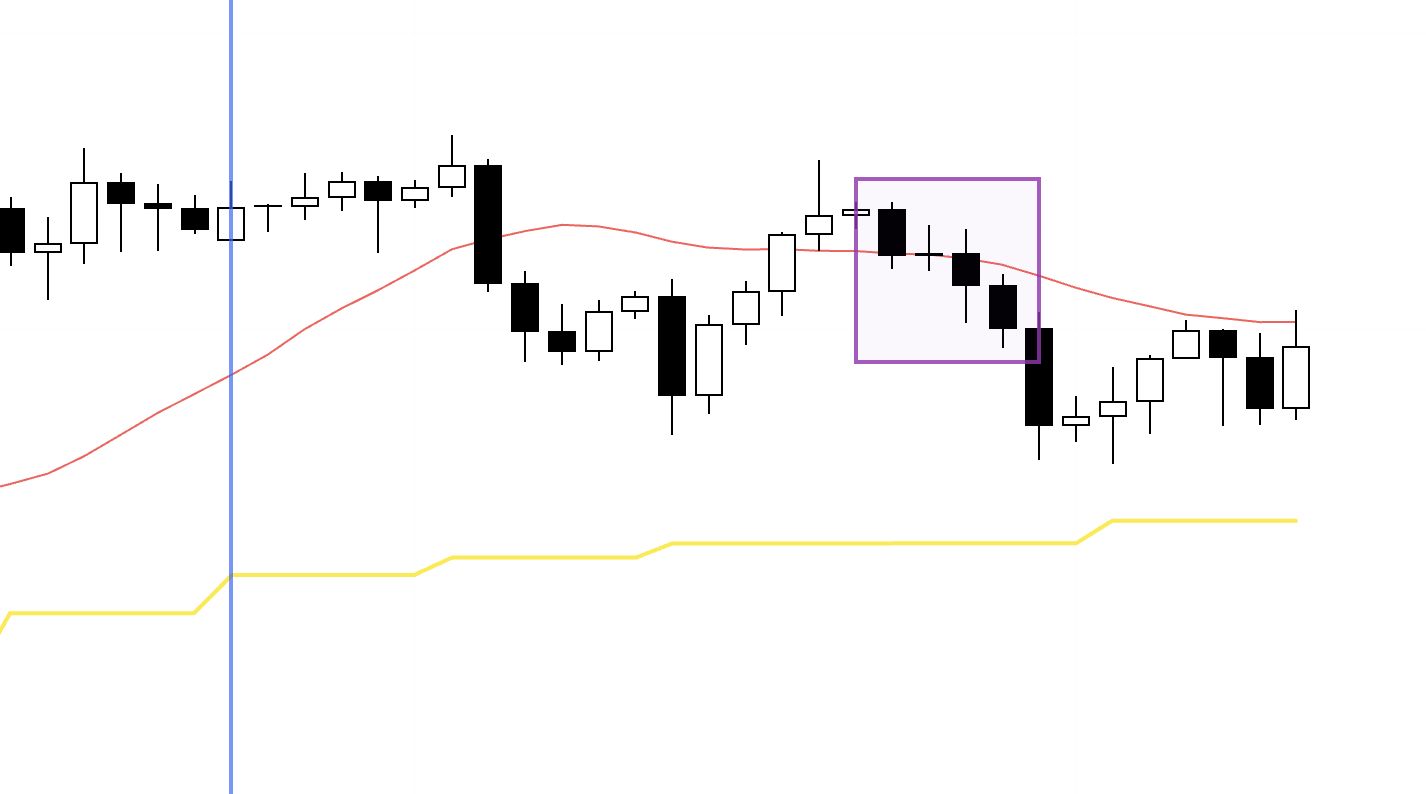
4h
Here is the actual chart.
The 4h has formed a new lower high.
I did not trade the previous lower high.
The reason is that the 1h trend had not been broken even once at that point.
Let’s look at the 1h.
1h
On the 1h, at this latest 4h lower high on the right, the downtrend has finally broken once, and price is now setting up to roll into a fresh 1h downtrend.
By “breaking the 1h downtrend,” I mean invalidating the sequence of lower highs and lower lows on the 1h.
Until now, the 1h had kept printing lower highs and lower lows, but it has just taken out the most recent swing high, negating that sequence.
Why do I wait for this?
Because if the 1h downtrend has not broken at all after a sharp slide, you risk selling the lows into clustered profit-taking buy orders.
Traders who are already short are watching for a place to take profits and place buy orders.
In fact, I also took profits on this short last week, and because it was the weekend and I do not hold positions over the weekend, I closed.
But for traders who did hold over the weekend, the 1h downtrend was still intact, so they had no structural reason to exit.
That implies potential buy orders building up.
Therefore, I wanted to see the 1h downtrend break once, and then take a trade at the first point where a new 1h downtrend starts.
I mentioned this in last Sunday’s scenario blog as well.
Now, by breaking this 1h low, the new lower high is confirmed, and this becomes the first point where I can enter as the new 1h downtrend begins.
15m
This is the 15m chart.
Within the 1h lower high area, the 15m is also starting a new downtrend, forming lower highs and lower lows.
This break of the low is at the same level as the 1h low break.
15m
The low has just broken; my resting order has been filled, and I’m in.
I’ll hold until the 15m trend breaks.
15m
I’ve moved the stop-loss to breakeven.
15m
The trailing stop has been hit; the trade is closed.
1h
This is what happened afterward.
After my exit, price continued to fall.
It may feel like a frustrating move, and many people think,
“If only I had not exited there, I could have caught the rest of the drop.”
But this way of thinking is not good.
That is hindsight.
In my trading, once the trend is broken, I must exit there.
If the downtrend is broken and structure shifts to higher lows and higher highs, the probability of a rise increases, and I no longer have a reason to hold the position.
This time, it just happened to fall further afterwards, but you must not let a single outcome sway you.
We are not playing a game of predicting the future, nor are we trading to win each individual trade.
We are required to act with consistency so that, by executing our rules and scenarios over a large sample size, we can let the edge show up.
There is absolutely no need to feel regret.
If you feel frustrated in this situation, it means you are still operating with the wrong mindset.
Many people think this way.
If you followed your rules and are still upset that you “left money on the table,” then please think carefully about this:
your standard for evaluation should be whether you followed your rules, not how much extra profit you could have made in hindsight.
〜・〜・〜・〜・〜・〜・〜・〜・〜・〜・〜・〜・〜・〜・
That was the only actual trade I took this week.
Next is the USDJPY setup that I ended up not taking.
I recorded the process in real time from placing the order until cancellation, so I will show that.
〜・〜・〜・〜・〜・〜・〜・〜・〜・〜・〜・〜・〜・〜・
Thursday, November 6
USDJPY
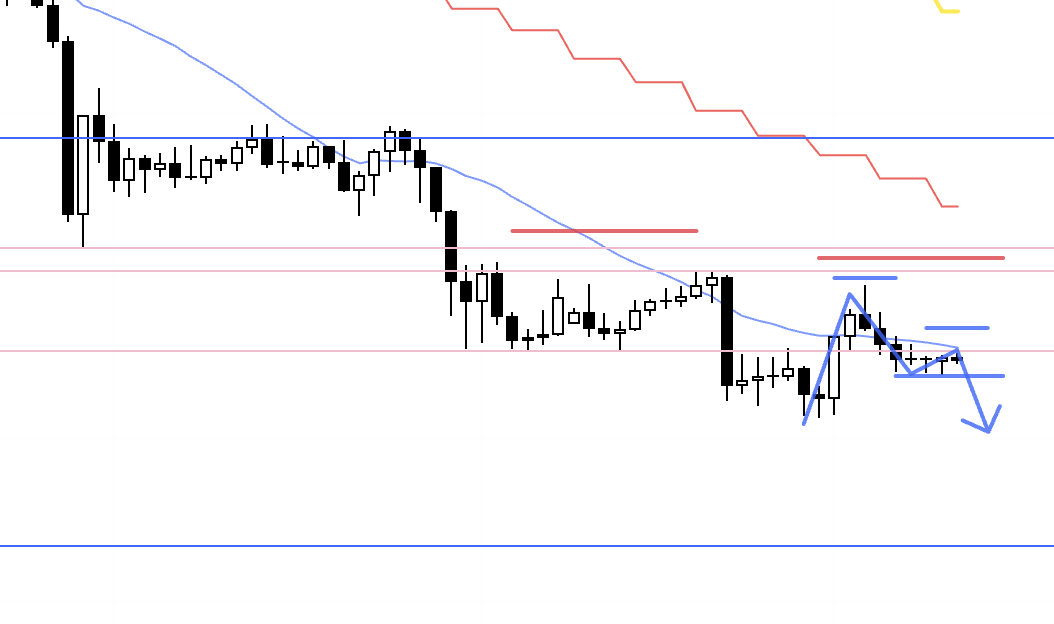
4h chart from Sunday’s scenario blog
This is the 4h chart from last Sunday’s scenario blog.
After the 4h turned down once, I was looking to buy the first higher low marking the turn back up.
This temporary decline on the 4h is part of forming a pullback on the daily.
The daily is currently in an uptrend, with higher lows and higher highs, so I want to look for pullback buys.
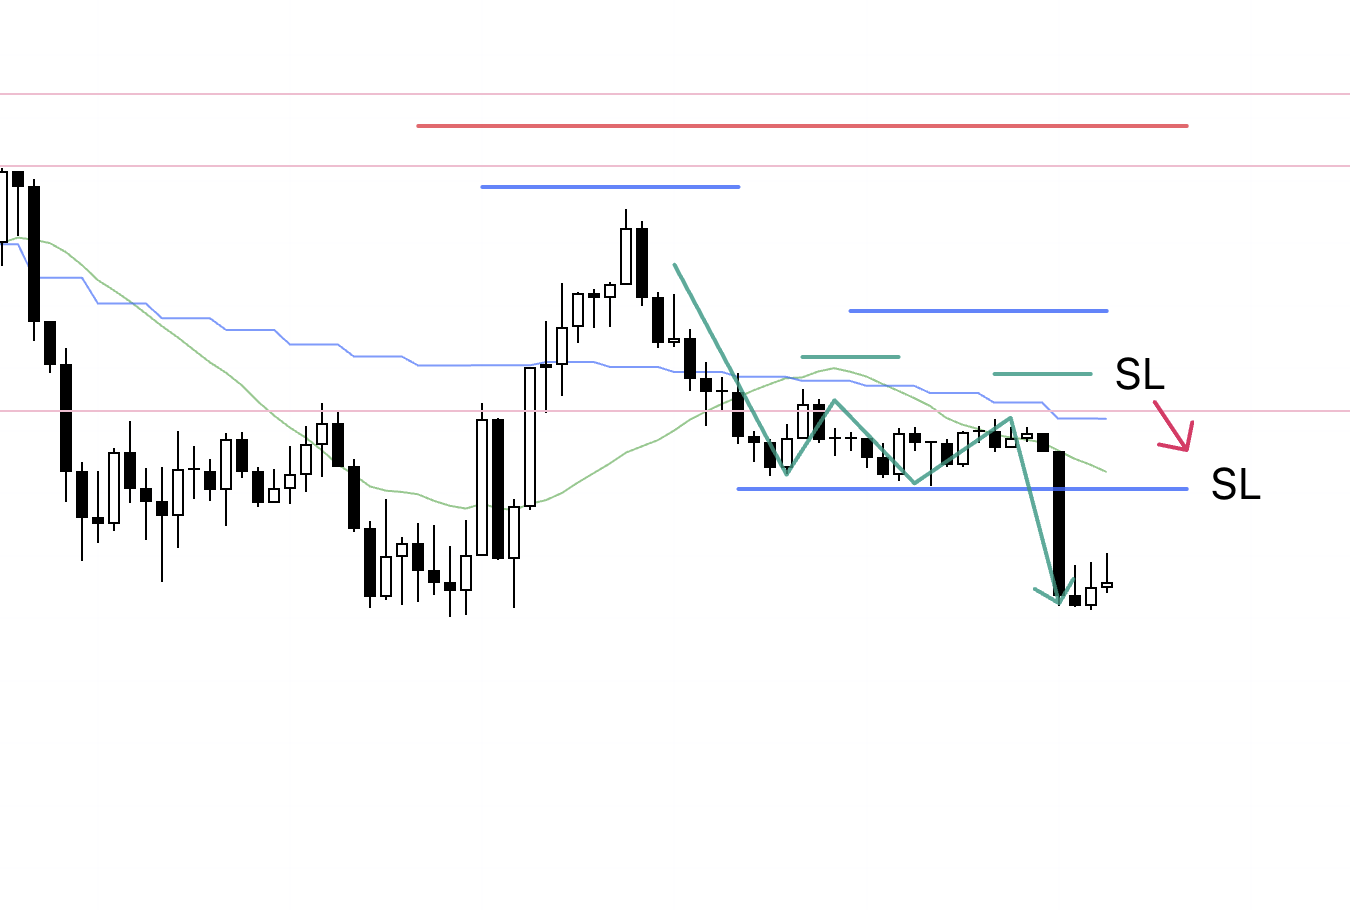
4h
Here is the actual 4h chart.
As outlined in Sunday’s scenario, the 4h uptrend has been broken once, and now price is forming a higher low, supported by the previous lows.
1h
On the 1h, inside that 4h higher low area, a new 1h uptrend will start once we print a higher low followed by a higher high.
I’ll place the stop below the supported low (the pink line).
1h

I set the buy order and waited, but price then broke the low, invalidating the setup.
So I canceled the order, and this trade was skipped.
〜・〜・〜・〜・〜・〜・〜・〜・〜・〜・〜・〜・〜・〜・
Next is point B on EURUSD, which I also skipped.
4h

I did not trade point B, but it was a level I had defined in my scenario and was waiting for.
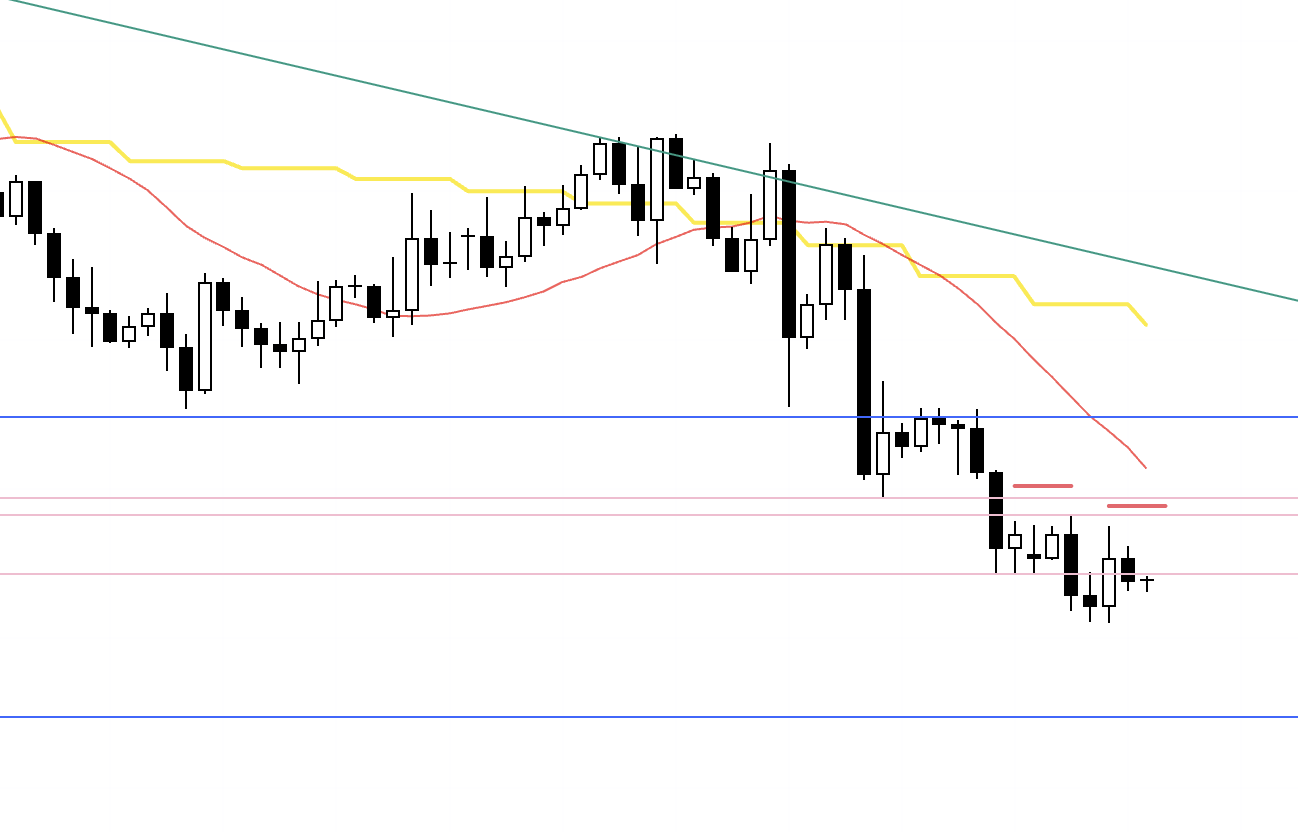
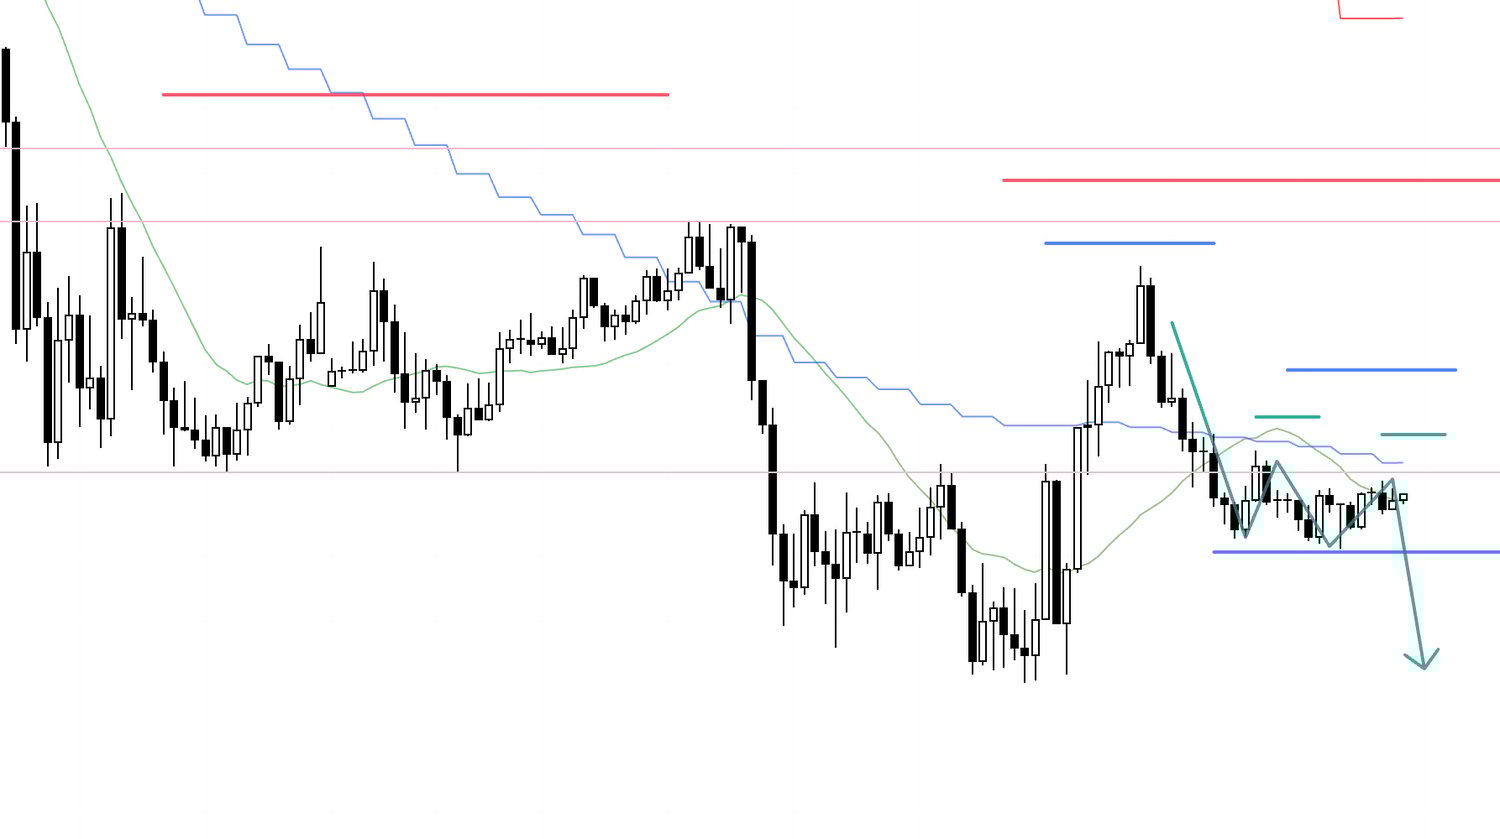
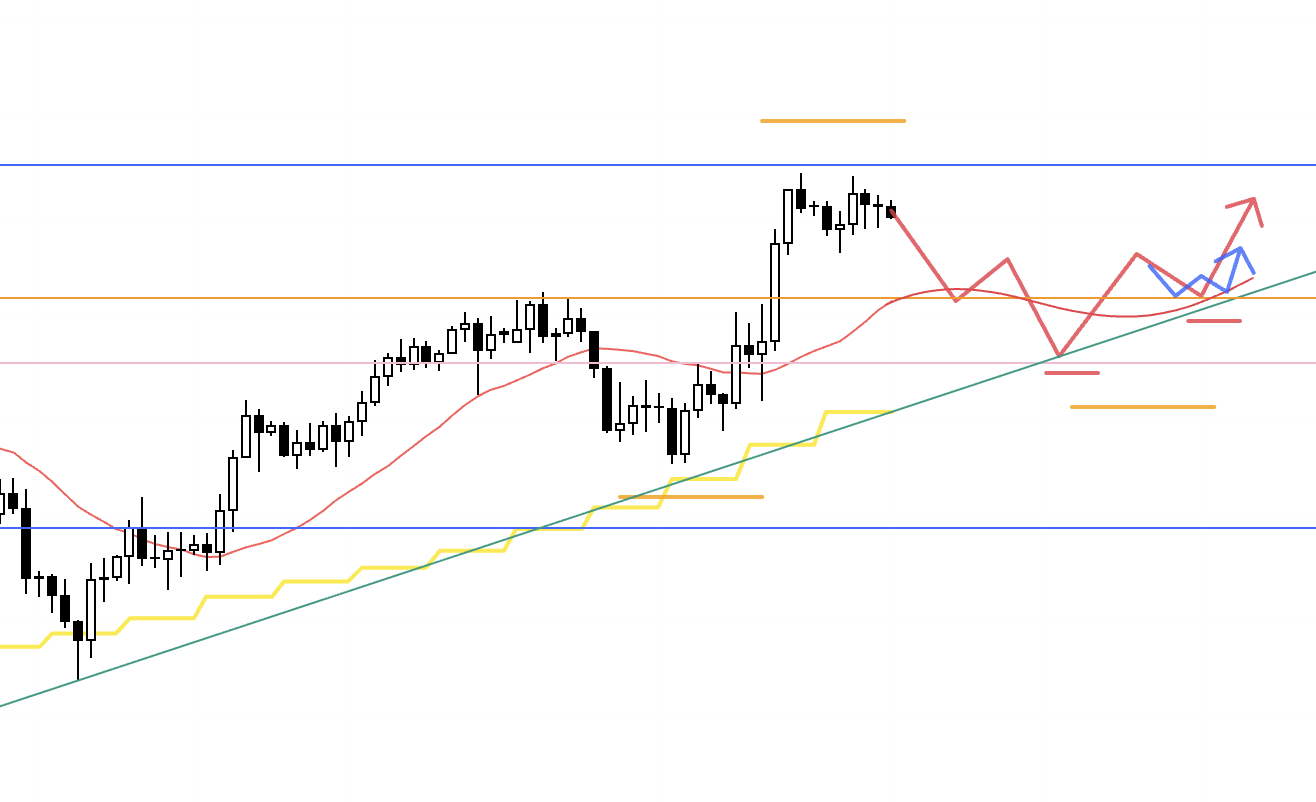
4h chart from Sunday’s scenario blog
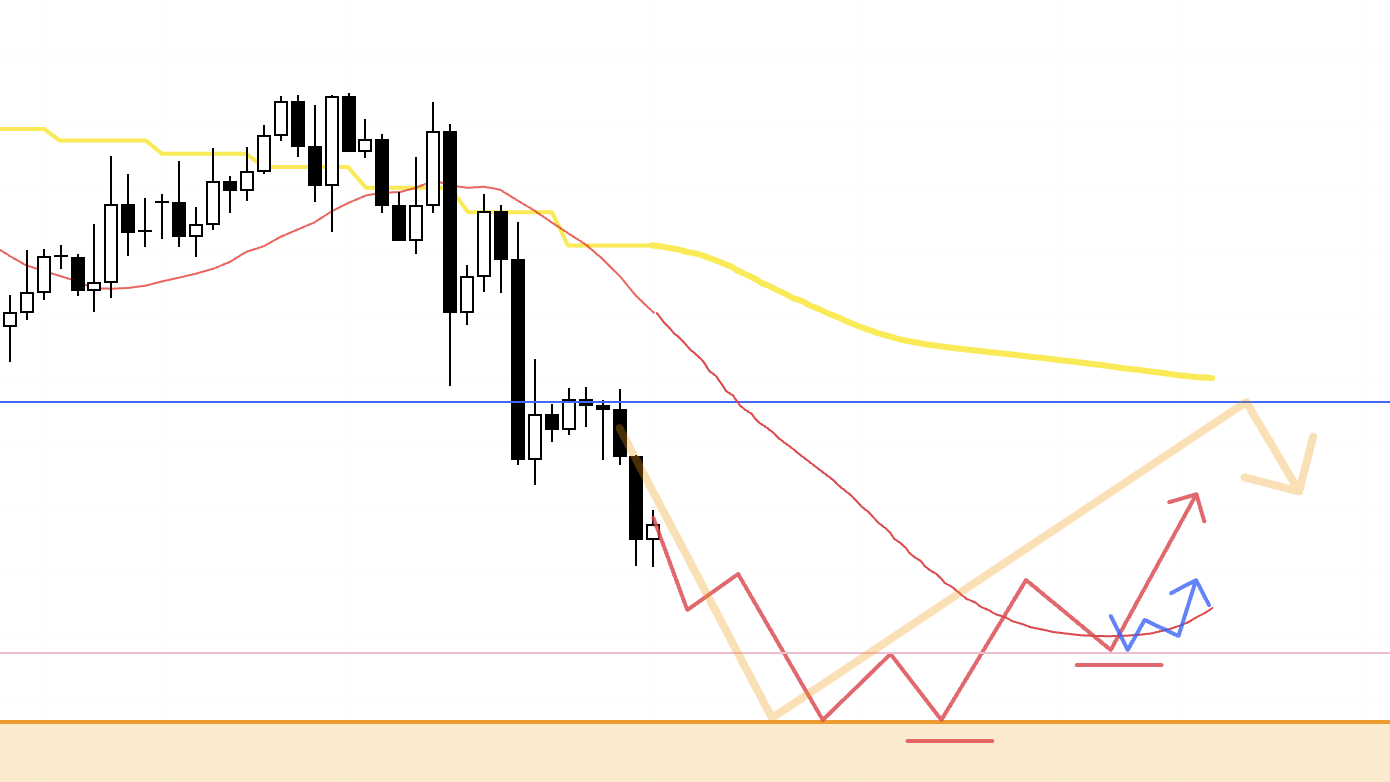
This is the buy scenario from Sunday’s blog.
After the 4h downtrend ended and structure shifted to higher lows and higher highs, I was looking to enter long on a lower timeframe.
At that time, I wanted to see solid support from the 4h moving averages, confluence with support lines, and sufficient distance up to the daily moving average in yellow above, so that the risk-reward would be acceptable.
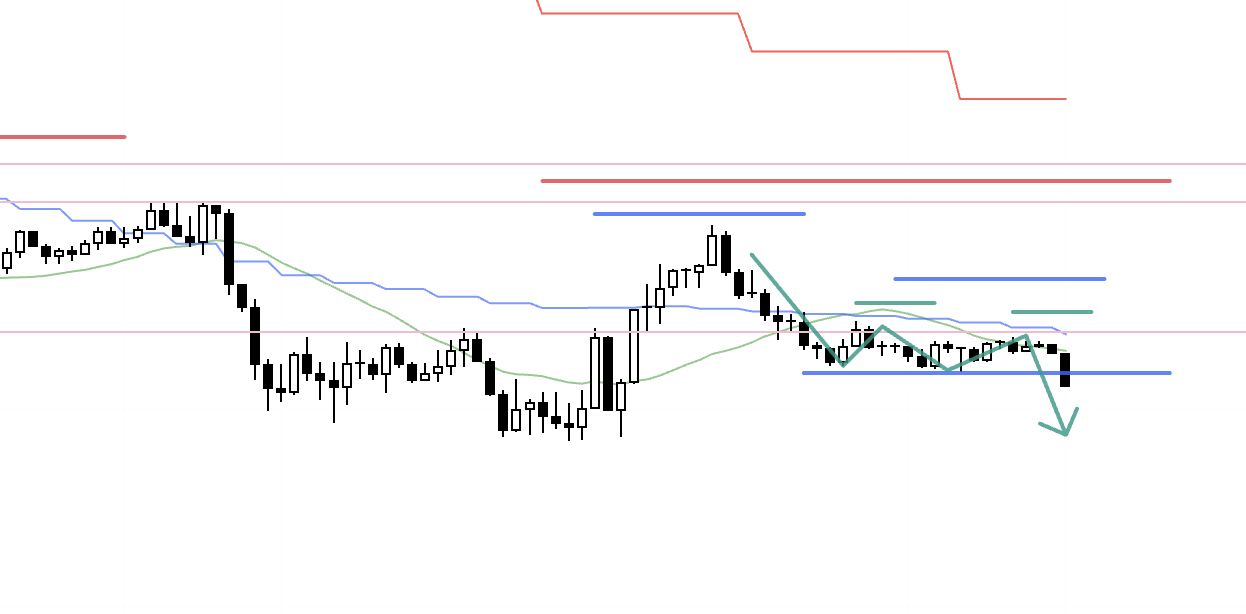
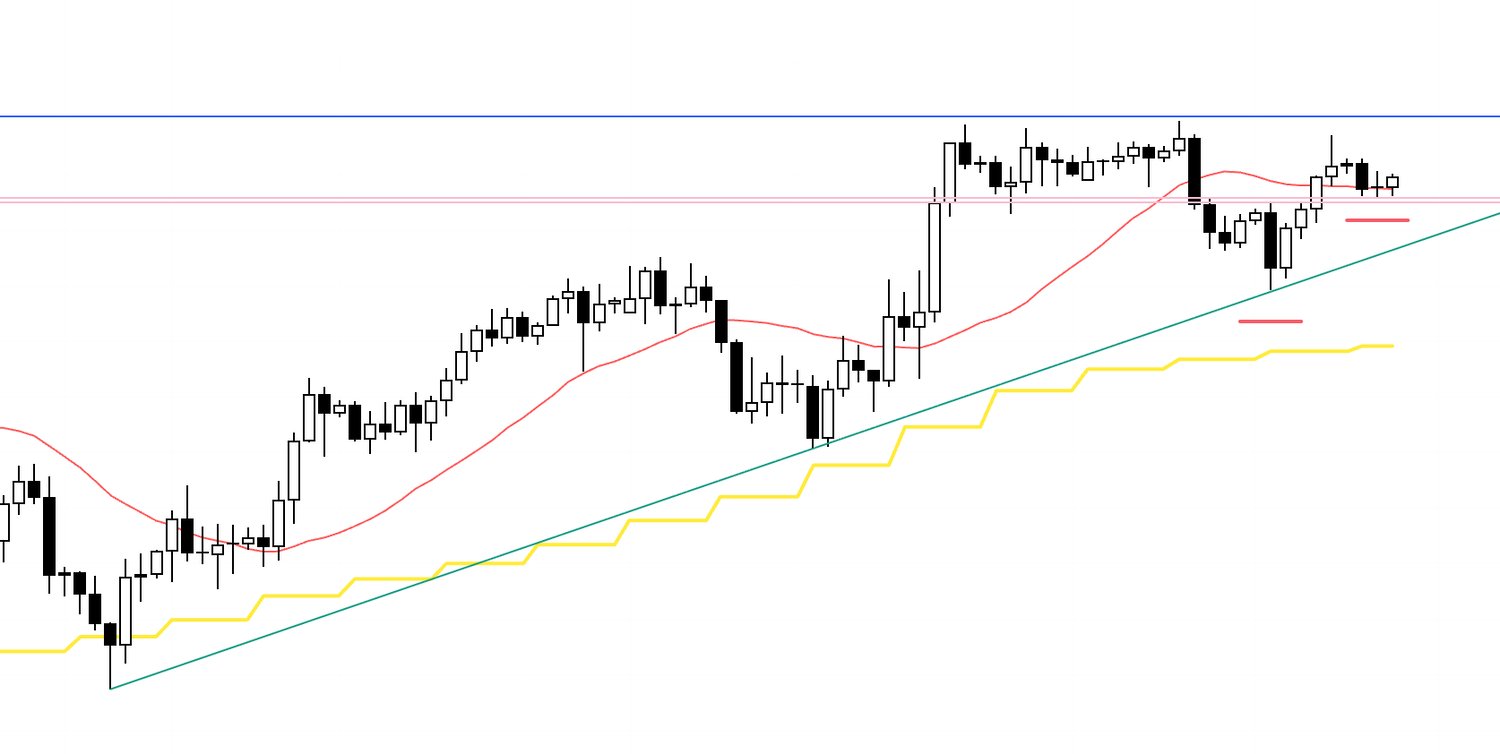
4h
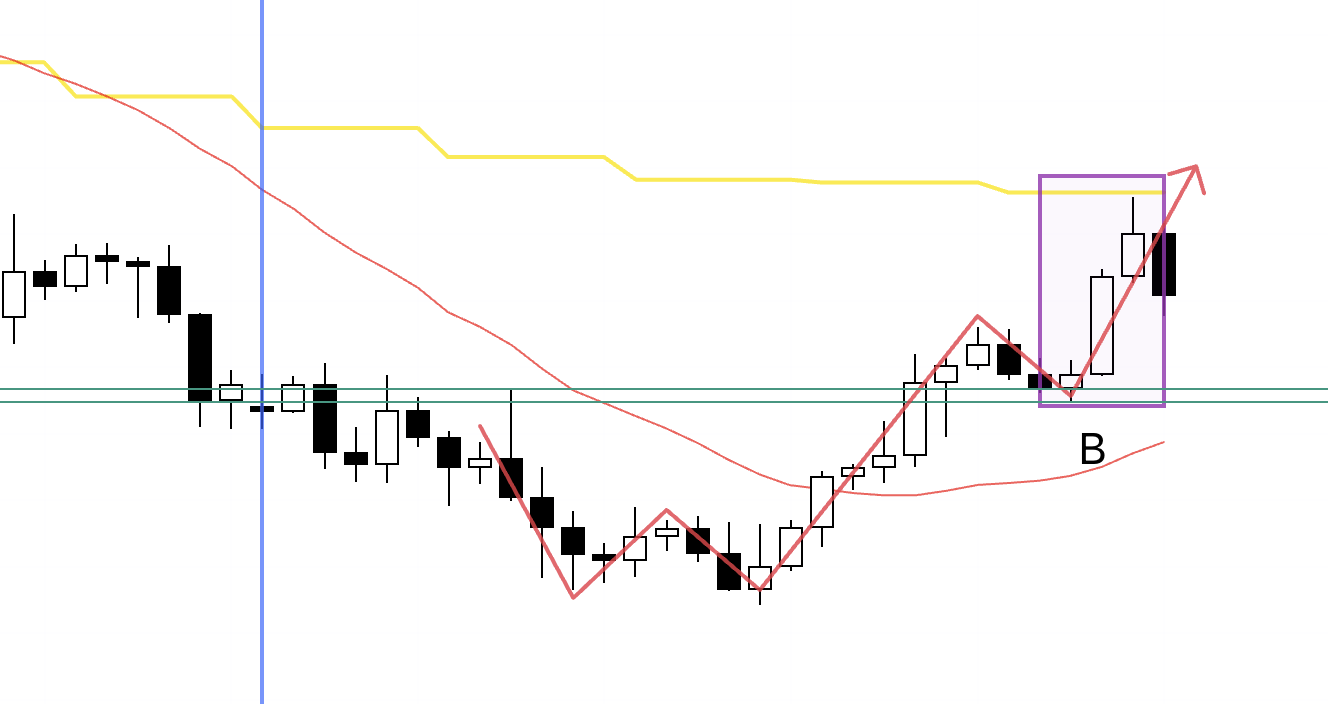
Here is the actual 4h chart.
The 4h downtrend ended, and price formed a higher low, apparently finding support around the prior high (green line), so I was waiting to buy there as a point where I believed an upside edge could emerge.
In reality, on the 1h, price never formed a higher low.
It simply broke to a new high in one move and continued rising, so I had no opportunity to enter.
1h
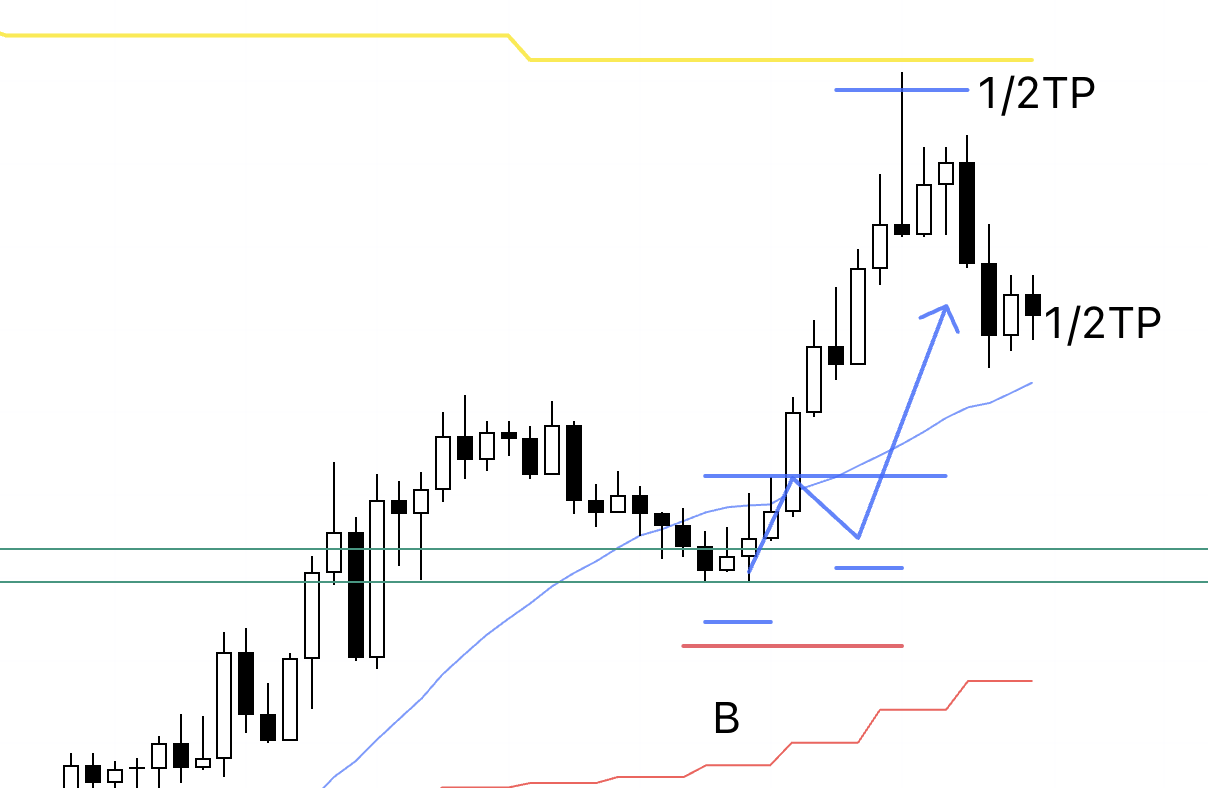
If the 1h had formed a higher low and then taken out the high, I would have taken the trade.
As I wrote in Sunday’s scenario, this rise would have been a move to form a lower high on the daily, which means that the higher it goes, the greater the risk of increasing selling pressure.
So I had planned to secure half the profit just before the daily moving average in yellow.
Then, since it would be the weekend, I would have closed the remaining position before the market closed.
〜・〜・〜・〜・〜・〜・〜・〜・〜・〜・〜・〜・〜・〜・
That is all.
This week, several scenario-based, edge-producing spots I had been waiting for did appear, but in the end the criteria were not fully met, so I had only one near-breakeven trade and overall a very quiet week.
However, as I have written many times, what matters is not each individual result, but how faithfully you continue to follow your own scenarios and rules.
If you ride the emotional ups and downs of every single outcome and keep changing your rules to match the last trade, you will never achieve consistent trading, and your edge will never surface.
Edge appears only when a strategy is repeated many times.
I start from a blank chart and predefine the conditions that create edge on the long side and on the short side.
From there, I wait for those conditions and execute.
Each week in this blog, I show both the scenarios defined in advance and how I actually acted based on them.
This is not meant to show whether I made or lost money in that particular week, and I do not want it to be read that way.
What matters is the process and the mindset:
how you build scenarios from an unknown future and a blank chart, and how you keep executing them with consistency.
On social media and across the web, many trades are presented, but simply showing the end result and saying “I would do this here” is hindsight—anyone can say that after the fact.
Whenever I see those images, I wonder how someone who is not a prophet supposedly manages to buy at the exact bottom and take profit at the exact top of the reversal, and how they would turn that into rules that apply consistently.
Entry criteria and exit criteria must be consistent, and they must exist as scenarios before the move happens.
If they cannot be shown in advance, there is a very high chance that the trade was just luck.
We are not prophets, and we do not need any mystical ability to pick exact tops and bottoms.
What is required of us as traders is the ability to keep executing clearly defined rules and scenarios with consistency.
I hope this blog can provide hints for those who are trying to build a strategy and for those who are struggling to achieve consistency.