

Hello.
I’ll outline trade scenarios for the week ahead.
This “Trade Scenarios” blog is posted every Sunday.
And every Saturday I publish a “Weekly Trade Report” that explains how I thought through and executed trades during the week.
Read together, the scenario blog and the weekly report will show you, at an operational level, how I think in advance, what I wait for, and how I execute consistently.
For the underlying strategy, please see my posts on Dow Theory and multi-timeframe analysis.
A scenario is not a prediction.
It is my personal plan that states, “If this happens, then I will do that.”
I do not forecast the market, and this is not a forecast, so please keep that in mind.
Nor is this a set of trading instructions or signals for you.
It does not guarantee future profits, and is provided strictly for educational purposes to illustrate how I run a consistent process.
I cannot take responsibility for any outcome of your trades, so please trade at your own risk.
Let’s start with USDJPY.
(On my charts, color denotes timeframe: orange for the daily, red for 4h, blue for 1h, and green for 15m.)
〜・〜・〜・〜・〜・〜・〜・〜・〜・〜・〜・〜・〜・〜・
USDJPY
Weekly
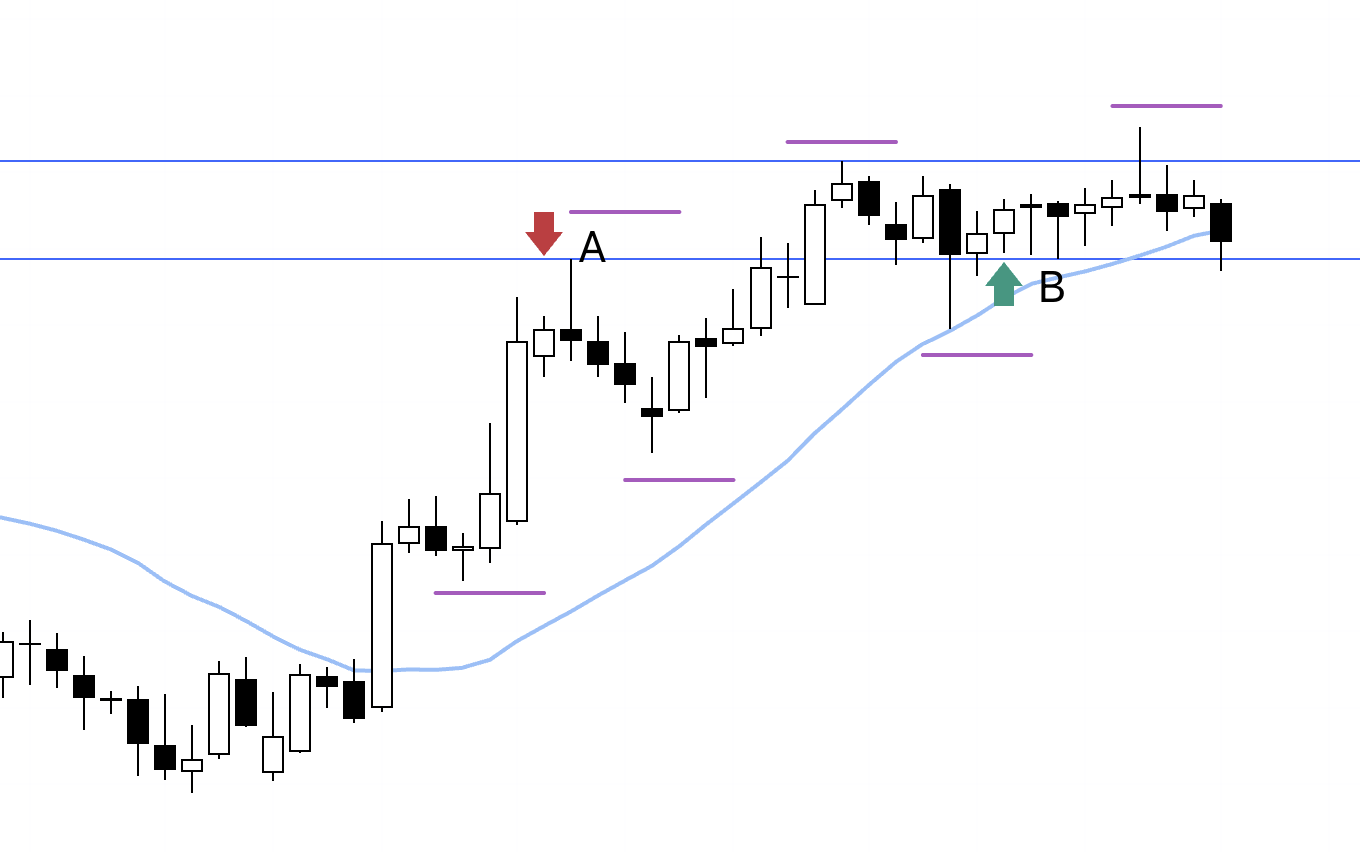
Starting with the weekly, price remains in an uptrend, printing higher lows and higher highs.
Last week it broke out of the long range and rallied as a weekly pullback buy, but has since retraced to the High A line, which marked the origin of the prior downtrend of lower highs and lower lows.
That line was also respected recently as the High B, and how price behaves around it will shape the trades I build.
Price is also boxed in between the rising trendline that connects the current higher-low points in the uptrend (lower green line) and the descending trendline of lower highs that is visible even on the monthly (upper green line).
I will incorporate these lines into scenario construction.
Now to the daily chart.
Daily
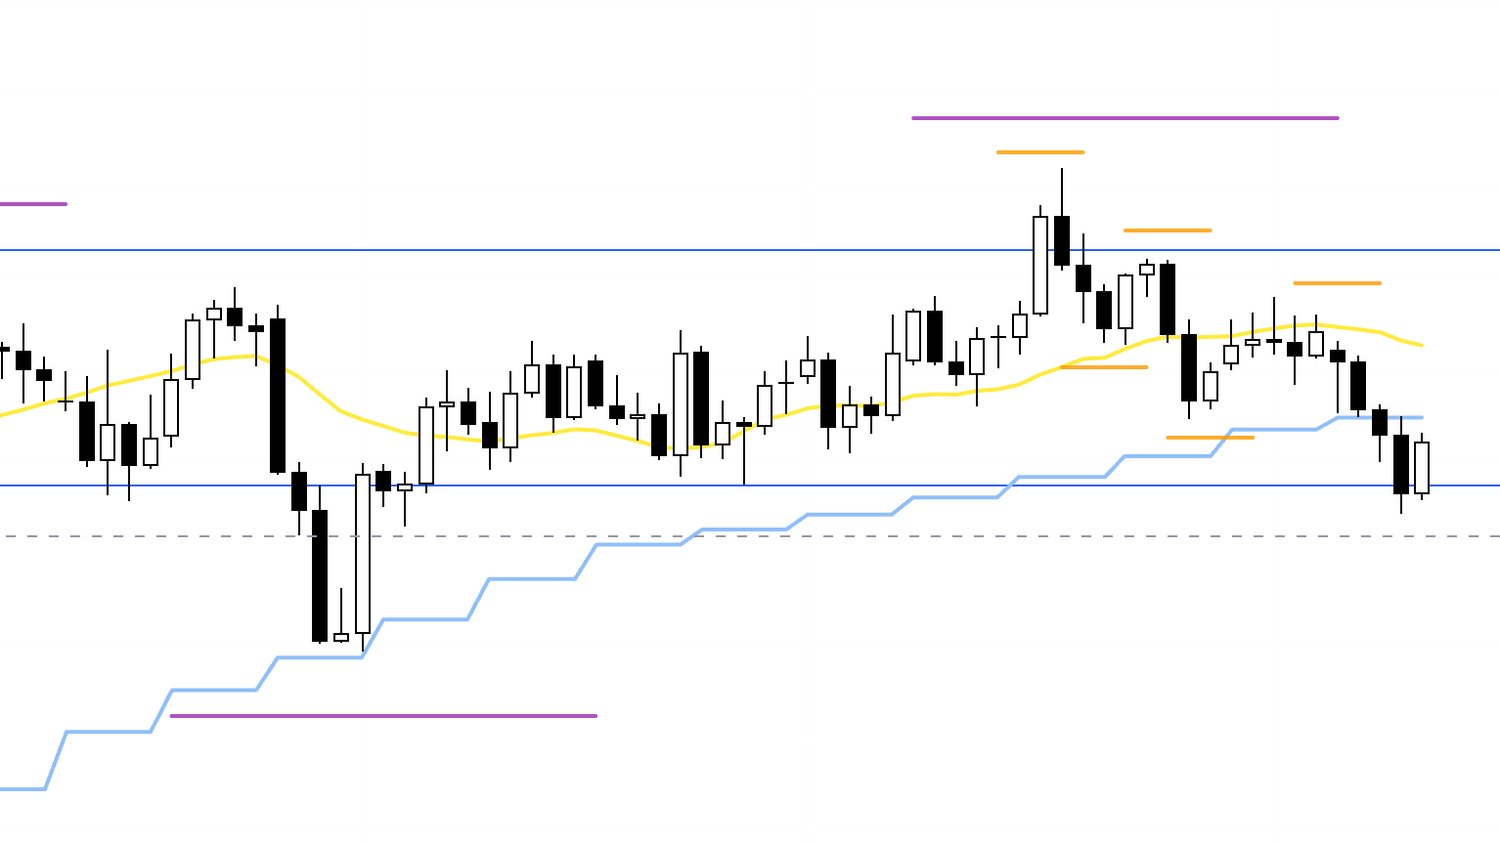
On the daily, after higher lows and higher highs, I am now waiting to buy a pullback.
I will watch how price behaves around the blue line we examined on the weekly, and will consider longs if a clear edge emerges.
For shorts, the area boxed in purple—between the rising trendline below (green) and the orange line—is a battleground where buyers and sellers collide, with a real risk of choppy price action, so I do not want to be aggressive there.
If I am already short, I plan to secure partial profits around that zone.
With that in mind, here is the 4h chart.
4h

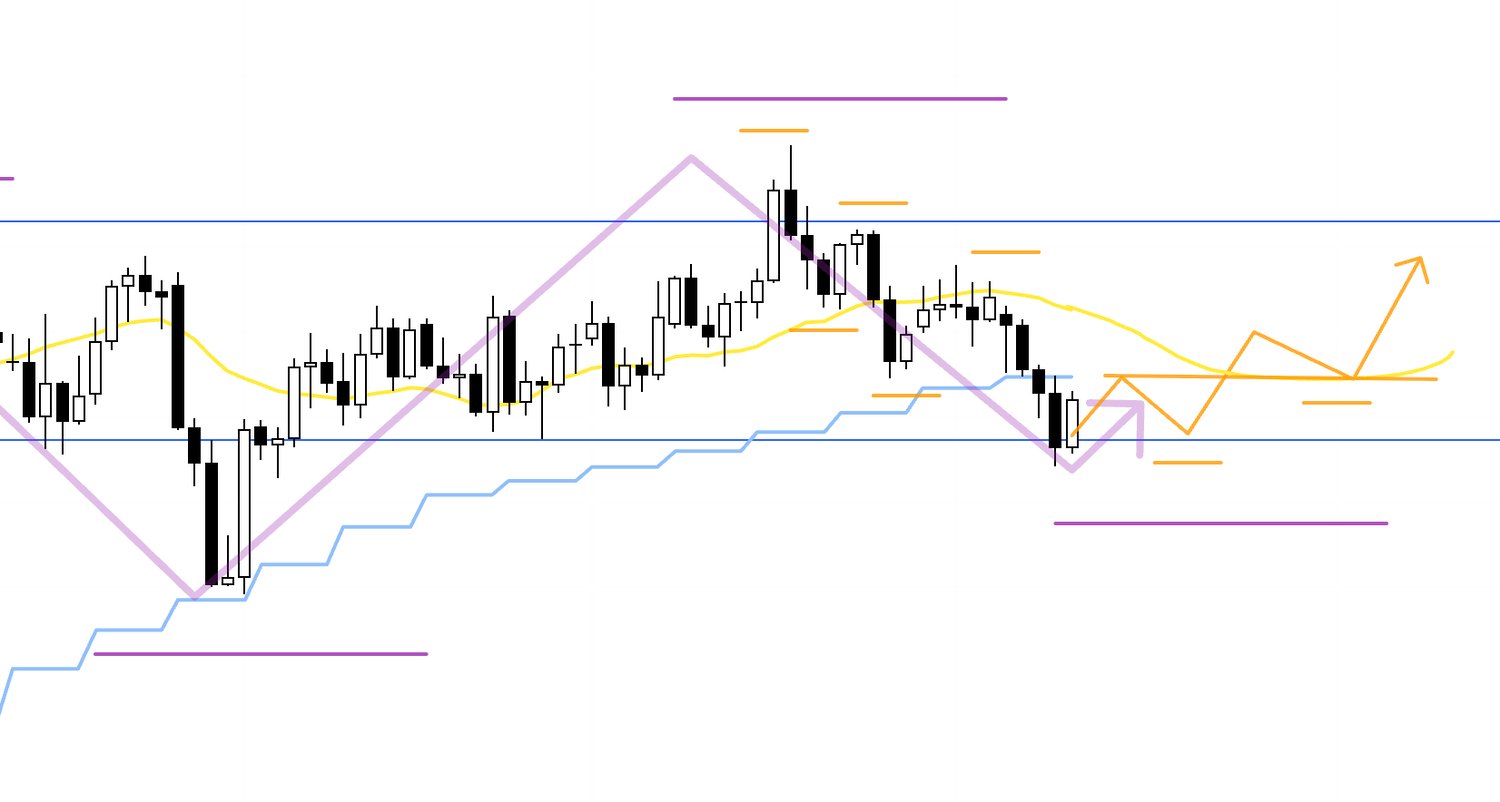
At present, price has broken below the 4h moving averages (red), thereby damaging the uptrend, so I cannot buy immediately.
I will look for price to print a fresh higher low, reclaim the moving averages, and have them start to act as support from below, then consider buying at lower-timeframe higher-low and higher-high triggers (blue arrows).
4h

For shorts, lower timeframes such as 1h have already sold off sharply and price is stretched away from the moving averages, so I will not chase it lower right now.
I want the lower-timeframe downtrend to end once, then if a renewed downtrend produces an initial lower-low break, I will consider shorts.
I would target the origin of the lower-timeframe downtrend that forms within the 4h lower-high structure.
That setup will take time to appear, and by then the daily moving average (yellow) may be rising underneath price, with the purple boxed area below being a do-not-prefer zone, so the key will be whether the entry offers acceptable risk-reward.
4h
Conversely, on the long side, if price forms a higher-low pivot supported by this zone and these lines, and the moving averages also align, I will consider buying as a daily pullback entry.
In that case, the blue line overhead will likely be watched by many traders, so again the question is whether the risk-reward is adequate.
Now let’s turn to EURUSD.
〜・〜・〜・〜・〜・〜・〜・〜・〜・〜・〜・〜・〜・〜・
EURUSD
Weekly
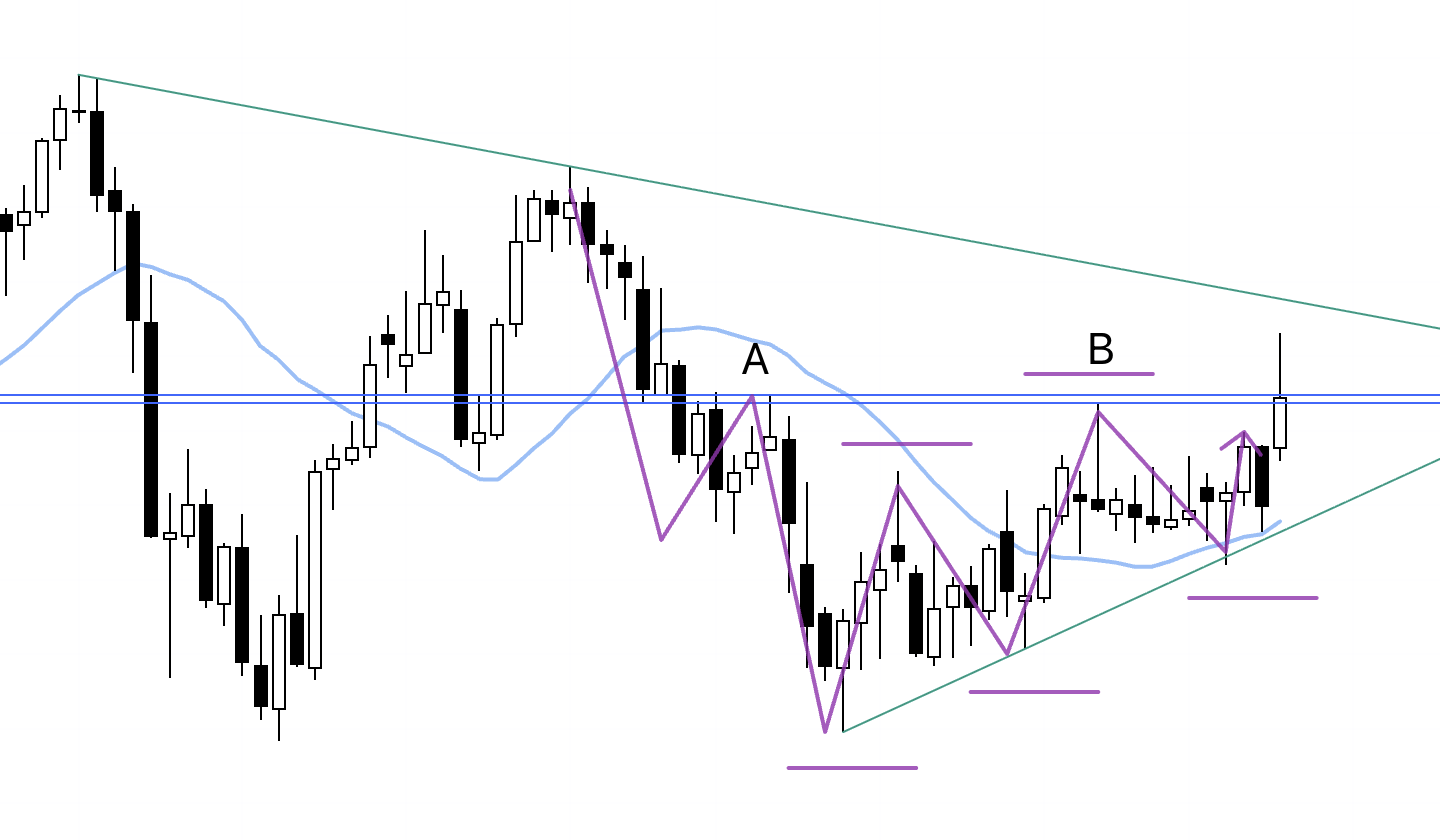
On the weekly, price is in an uptrend of higher lows and higher highs, but the magnitude of each new high is diminishing, and price has slipped slightly below the weekly moving average (light blue), signaling waning momentum.
The low at B is holding at the price of the high at A, a classic resistance-turned-support rotation.
This line should remain important, so I will watch how price trades around it.
Now to the daily.
Daily
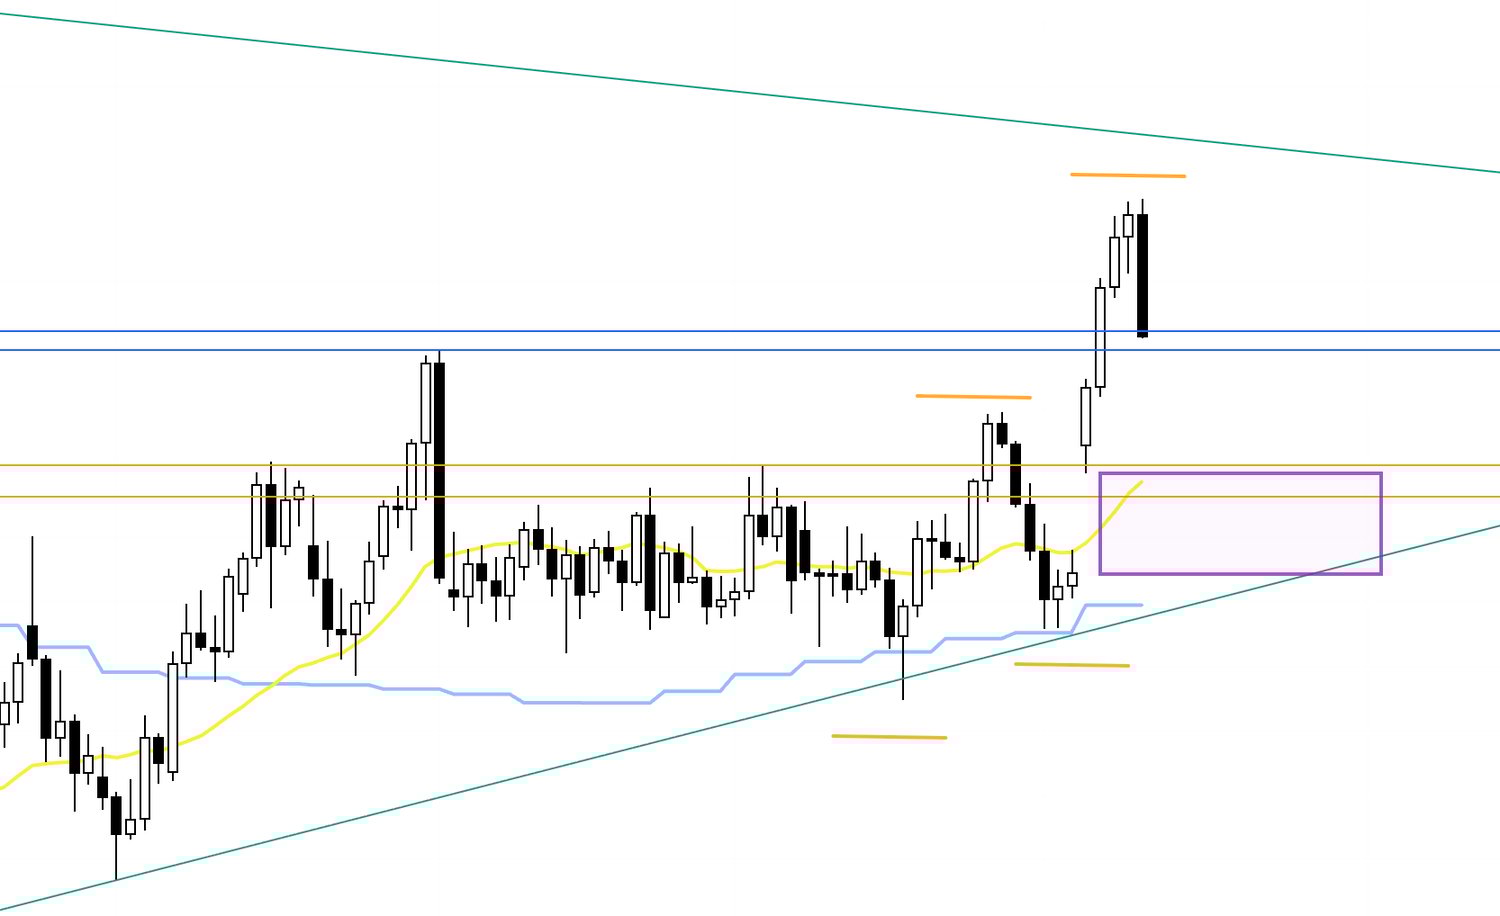
On the daily, price is trending down with a sequence of lower highs and lower lows.
I would normally look to sell the rally, but price rebounded at the blue line we just discussed, and since that line is clearly being respected and the weekly sits in a buy-the-dip area, caution is warranted on shorts.
Daily
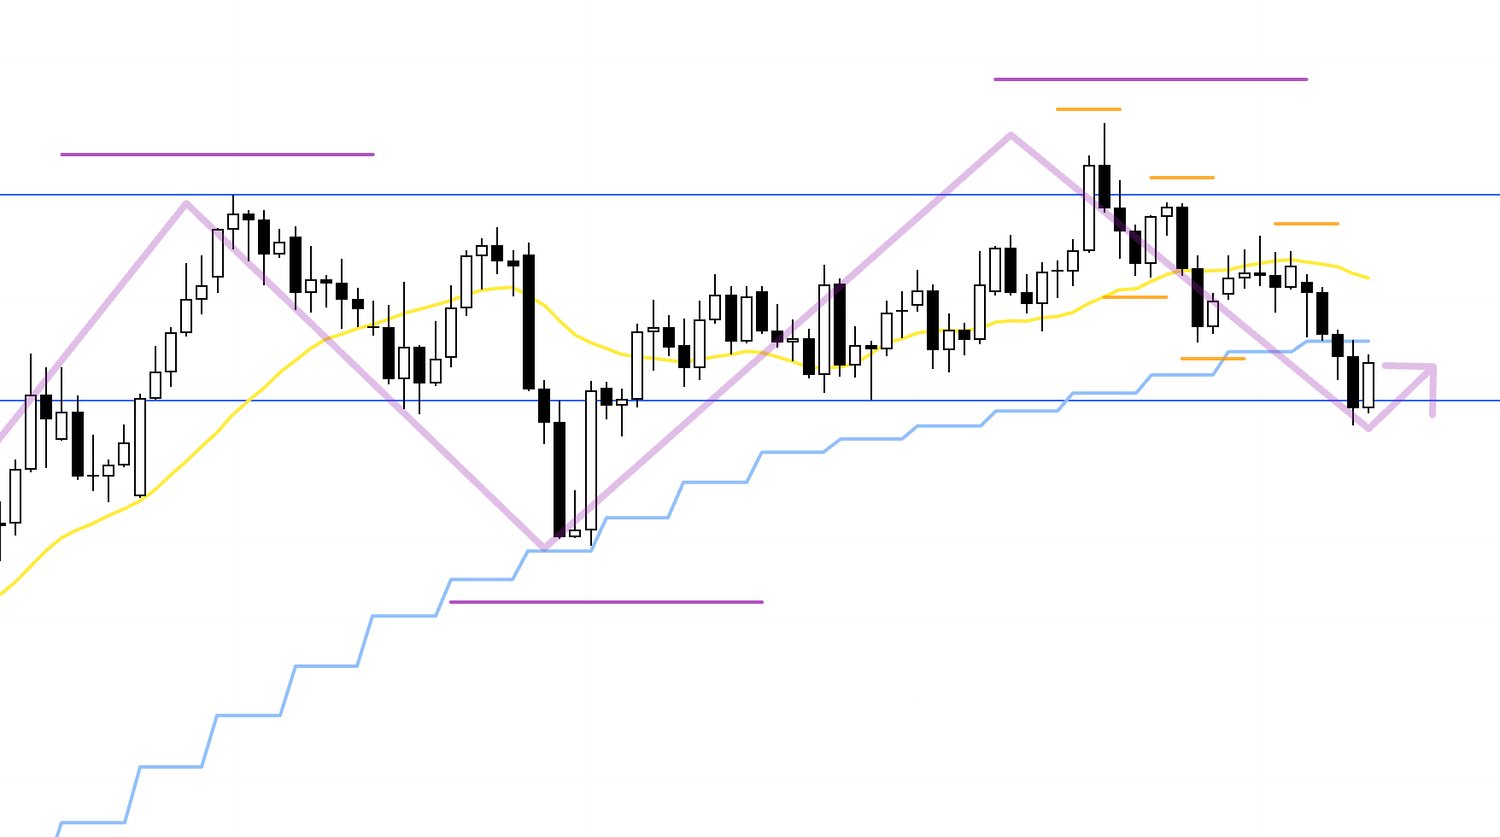
The purple strokes drawn on the daily depict the weekly structure.
The weekly is lifting with higher lows and higher highs, placing it in a pullback-buy area.
Daily

Accordingly, if the current daily downtrend—which is functioning as the weekly pullback—terminates and flips to an uptrend, and the direction aligns across timeframes at that turn, a powerful upside edge emerges as a weekly pullback buy.
With that context, here is the 4h.
4h
Right now price has not been able to break below the blue line, and it is rising, but if it ultimately breaks below and then gets capped by that line on a retest, we need to go with the downtrend.
If instead it retests the blue line and cannot break it, then we also need to consider longs.
See below.
4h

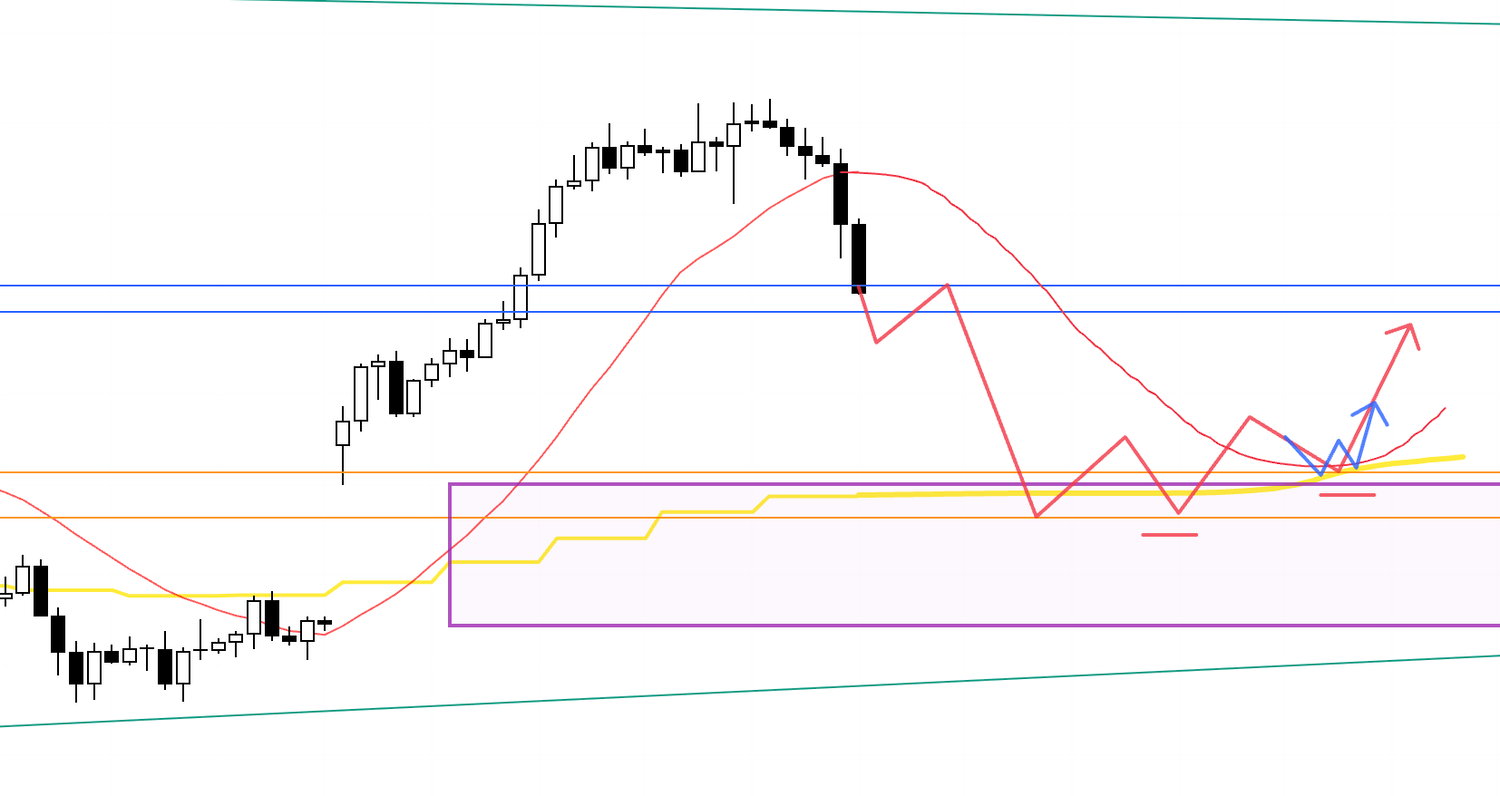
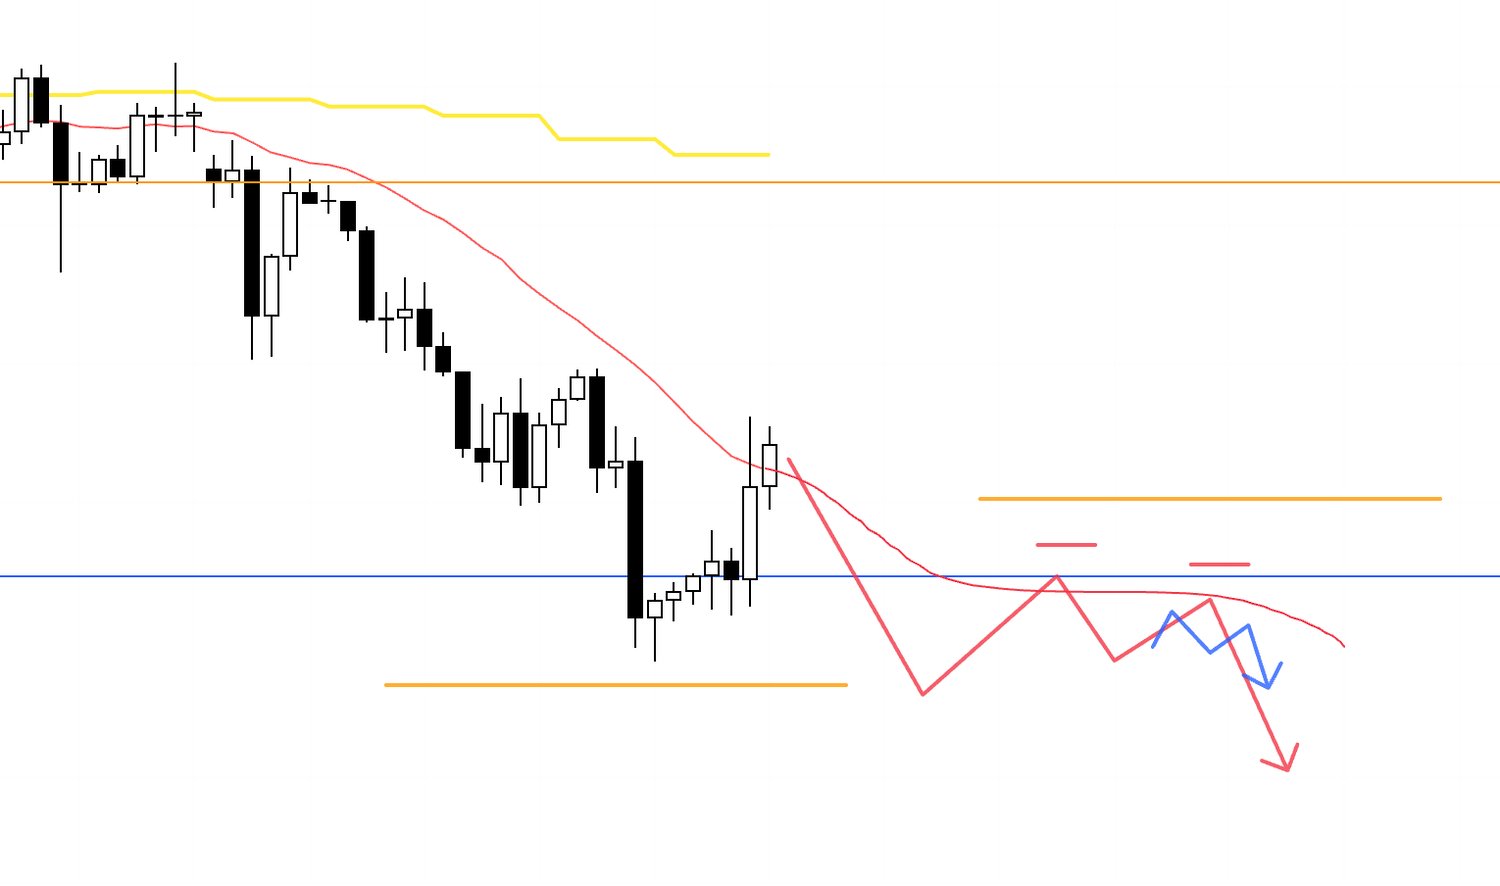
The daily is in a downtrend, but price is extended away from the daily moving average (yellow), so I am eyeing a lower-timeframe bounce that mean-reverts toward it.
If the blue line holds, a 4h higher low forms again, and moving averages (red) begin to support price from below, I will consider buying at lower-timeframe higher-low and higher-high triggers.
In that scenario, because the rise serves to build the daily lower high, the higher price climbs the more daily “sell-the-rally” flow will appear, so I will manage by taking partial profits around, for example, the orange line above.
4h

Conversely, if I switch to shorts from there, the point where the 4h rolls from uptrend to downtrend will be the daily “sell-the-rally” trigger, and I will consider selling.
However, as noted at the outset, the weekly is in a buy-the-dip area.
If price cannot break below the lower blue line and instead rises, the daily may start printing higher lows and begin an advance.
So I must account for that and identify the specific lows and lines that matter at that time.
See below.
4h

This is where a daily “sell-the-rally” setup can morph into a full trend reversal.
It is the daily buy scenario, viewed through the 4h lens.
If that feels abstract, let’s look again at the earlier daily chart.
Daily

As shown, the weekly is in a buy-the-dip area, and the current daily decline is the weekly pullback.
If the decline flips into an uptrend, that produces a weekly pullback buy and the initial leg of a daily uptrend, which creates a long edge.
By continuously tracking how order flow biases across multiple timeframes, I can structure even a daily “sell-the-rally” with a clear view of what risks come next.
〜・〜・〜・〜・〜・〜・〜・〜・〜・〜・〜・〜・〜・〜・
That’s all for now.
These are scenarios as of today, and I will update or rebuild them during the week as price action unfolds.
In scenario work, I always think one step ahead: “If this happens next, then I will do that.”
Because I am always one step ahead, I am not rushed in live trading, and I simply follow the pre-defined plan.
Knowing in advance where the long edge would appear and where the short edge would appear allows me to wait, and to do nothing if those conditions do not materialize.
When I draw arrows on charts, some may assume I am predicting the chart’s future, but these are not predictions, they are plans.
I am not sketching the chart’s future, but my own future actions.
What matters is not knowing where the chart will go, but knowing, “If the chart does X, what will I do?”
By mapping where and what the risks are beforehand and setting scenarios in advance, I can execute without hesitation.
If my consistent planning and execution helps you trade more consistently, I’m glad.
These trade scenarios are my personal plans.
If you have not yet settled on a trading approach, feel free to use them as reference points for your own strategy construction, but if your trading is already well defined, please do not let my plan distract you from your rules.
Thank you for reading.