


Hello.
I’ll lay out trade scenarios for the week ahead.
This “Trade Scenarios” blog is published every Sunday.
And every Saturday I post a “Weekly Trade Report” that shows exactly how I thought through and executed trades during the week.
Read alongside the scenario blog, you can see—at a practical, operational level—how I think in advance, what I wait for, and how I execute once conditions are met.
I think it will help you model a consistent process.
For the underlying strategy, please see my posts on Dow Theory and multi‑timeframe analysis.
A scenario is not a forecast.
It’s not a prediction, but my personal “if this, then I’ll do that” plan.
I do not predict markets, and this is not an attempt to do so, so please keep that in mind.
Nor is this a directive to buy or sell, or a signal service.
It does not guarantee future profits, and is provided strictly for educational purposes to illustrate how I execute a consistent process.
I cannot accept responsibility for any outcome of your trades, so please trade at your own risk.
Let’s start with USDJPY.
(On my charts, orange denotes the Daily, red is 4h, blue is 1h, and green is 15m, each color reflecting the movement on that timeframe.)
〜・〜・〜・〜・〜・〜・〜・〜・〜・〜・〜・〜・〜・〜・
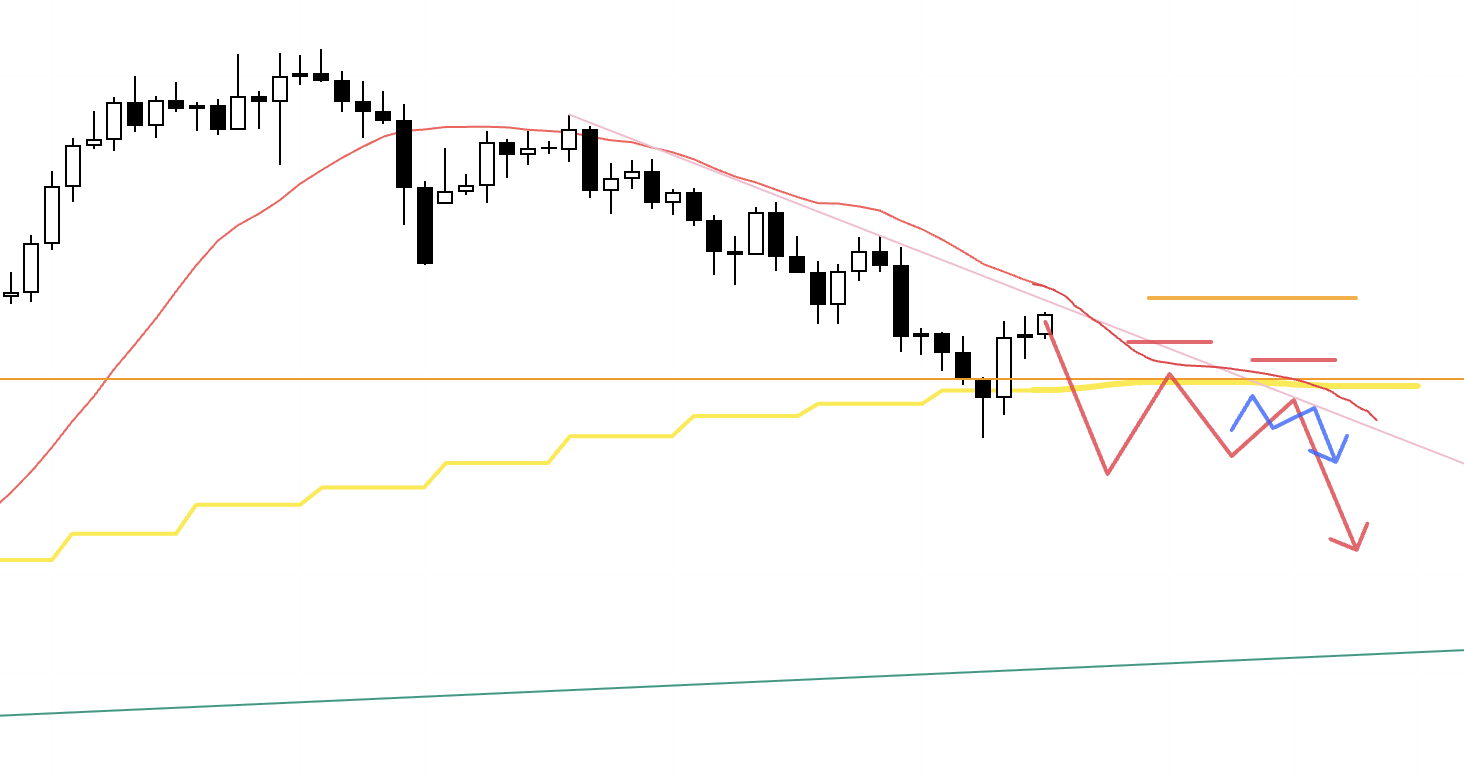
USDJPY
Weekly
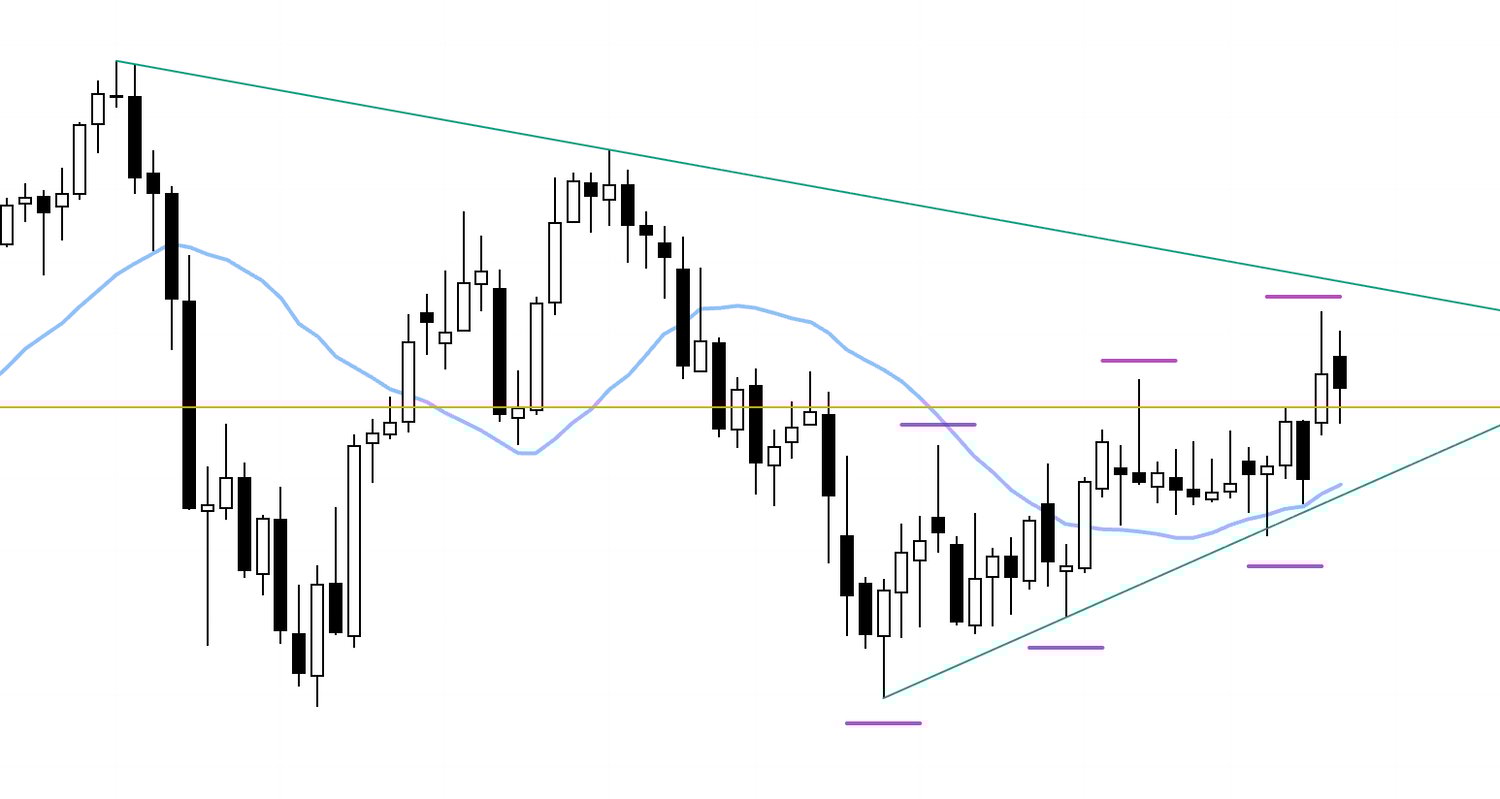
On the weekly chart the pair has continued its uptrend, repeatedly printing higher lows and higher highs and finding support from the moving averages.
At the moment it is pulling back on the weekly, so once lower timeframes flip back to an uptrend, dips are likely to find buyers.
Zooming out, however, there is a descending line of lower highs that is visible even on the monthly (the green trendline above), and if I buy I want to be mindful of those lines.
With that in mind, let’s look at the daily chart.
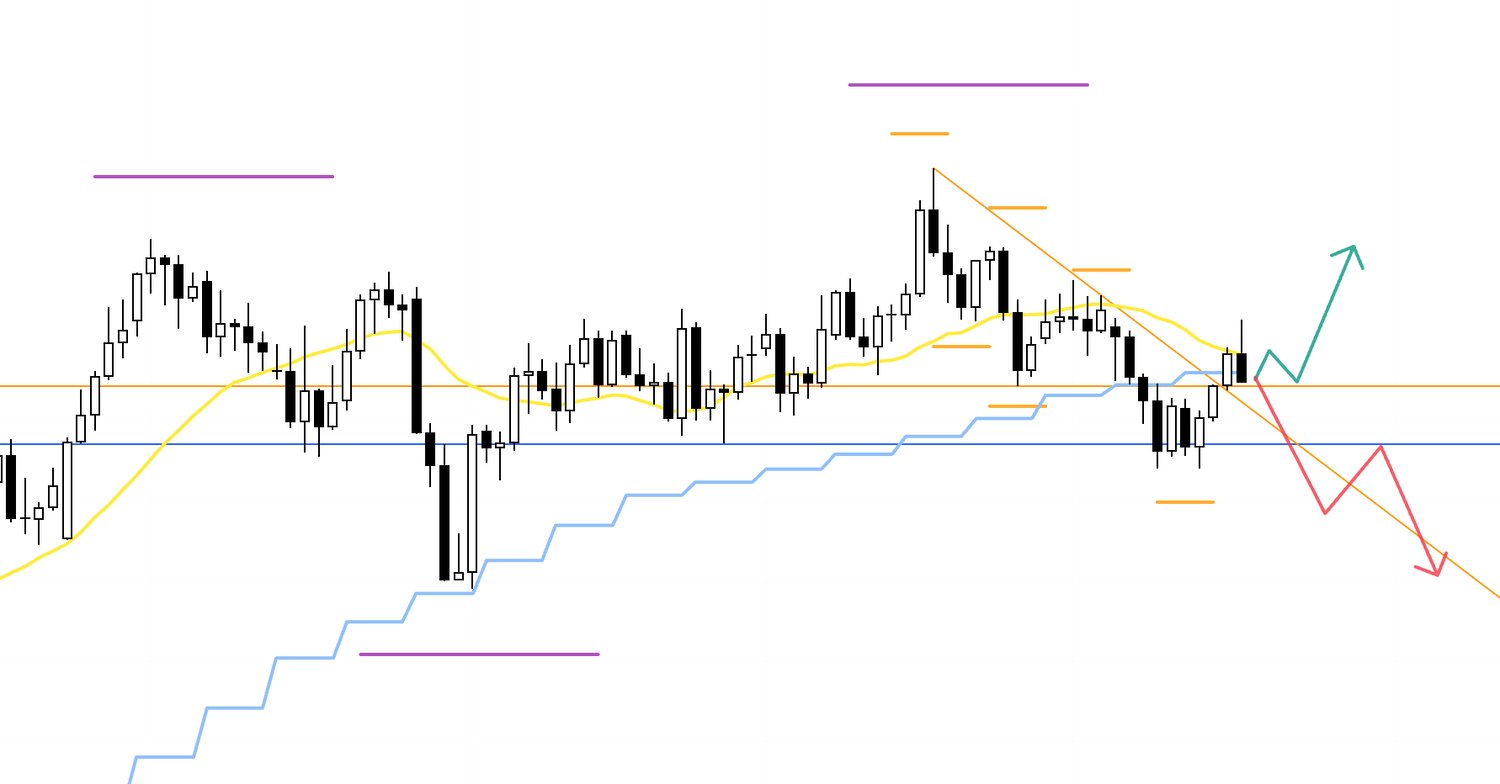
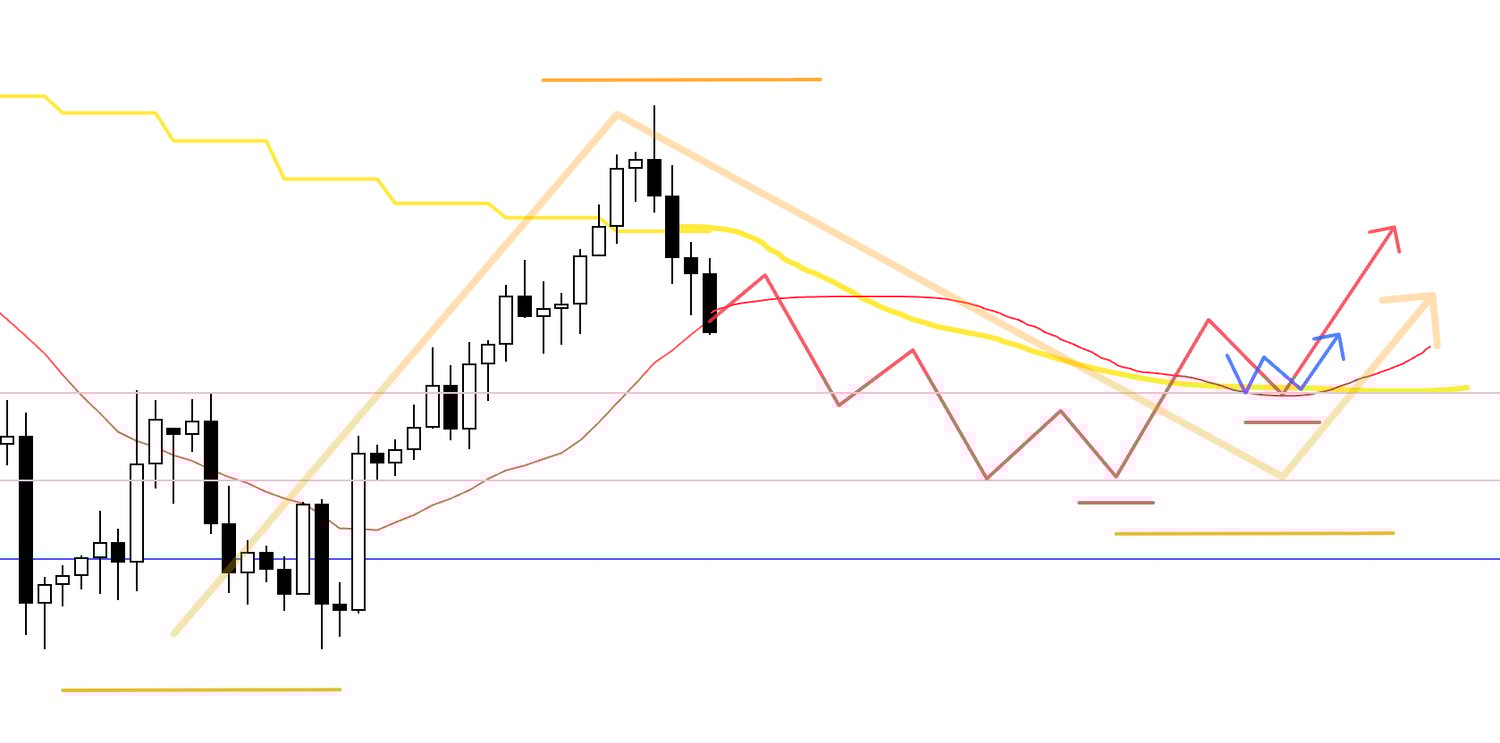
Daily
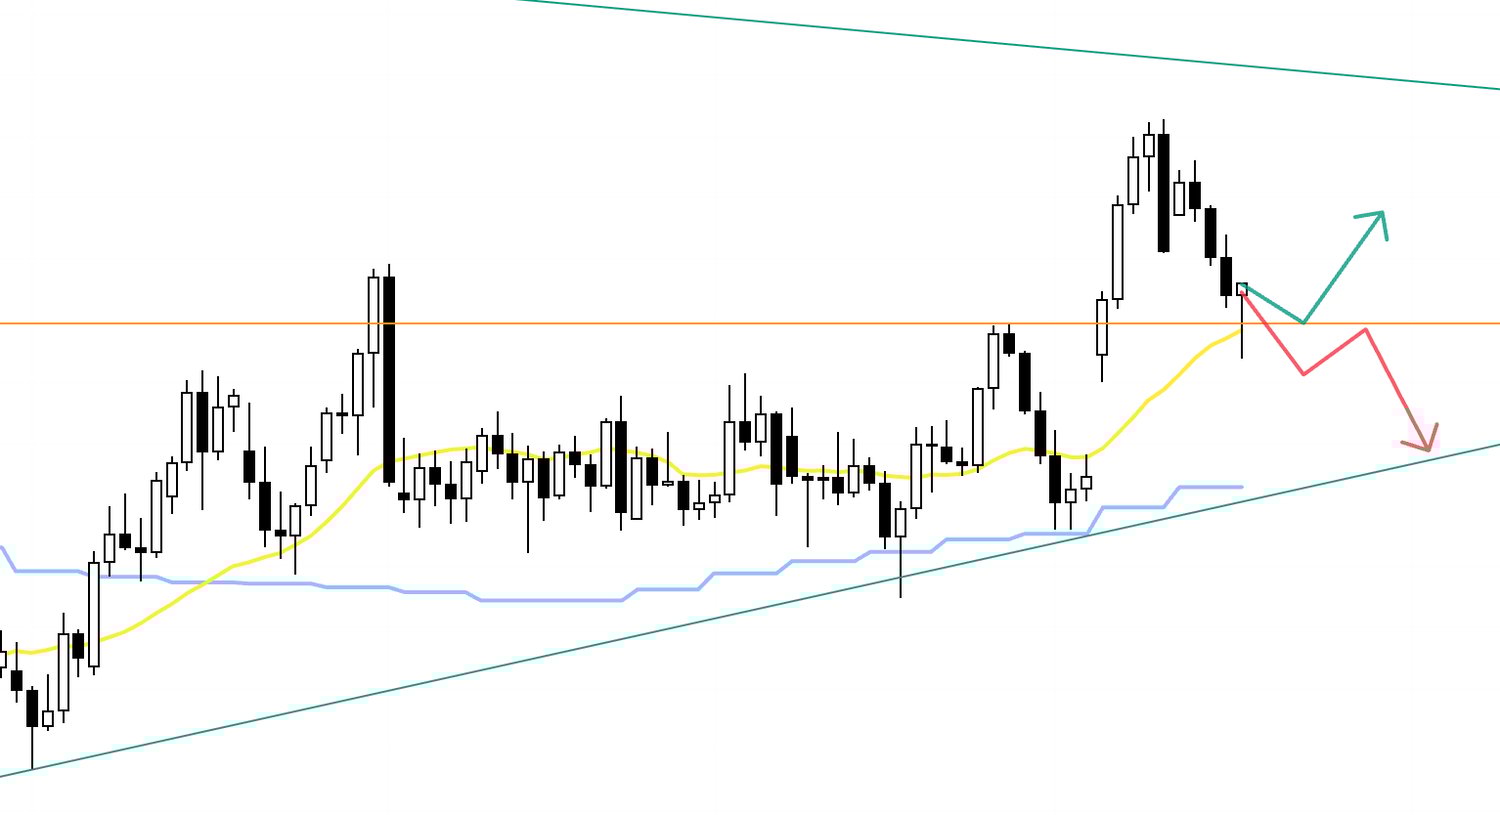
On the daily we’re in an uptrend and currently in a pullback, with price not yet having decisively broken below the prior high (orange).
If lower timeframes turn up from that line, I will consider buying it as a daily pullback entry. (green arrows)
Weekly, daily, and lower timeframes would all be aligned, which creates an edge on the long side.
Alternatively, if price is capped by this orange line and starts to roll over into lower highs, I will follow the decline as part of the weekly pullback. (red arrows)
In that case, the lower it falls the greater the risk that weekly dip‑buyers step in, so I need to be careful around the green trendline below.
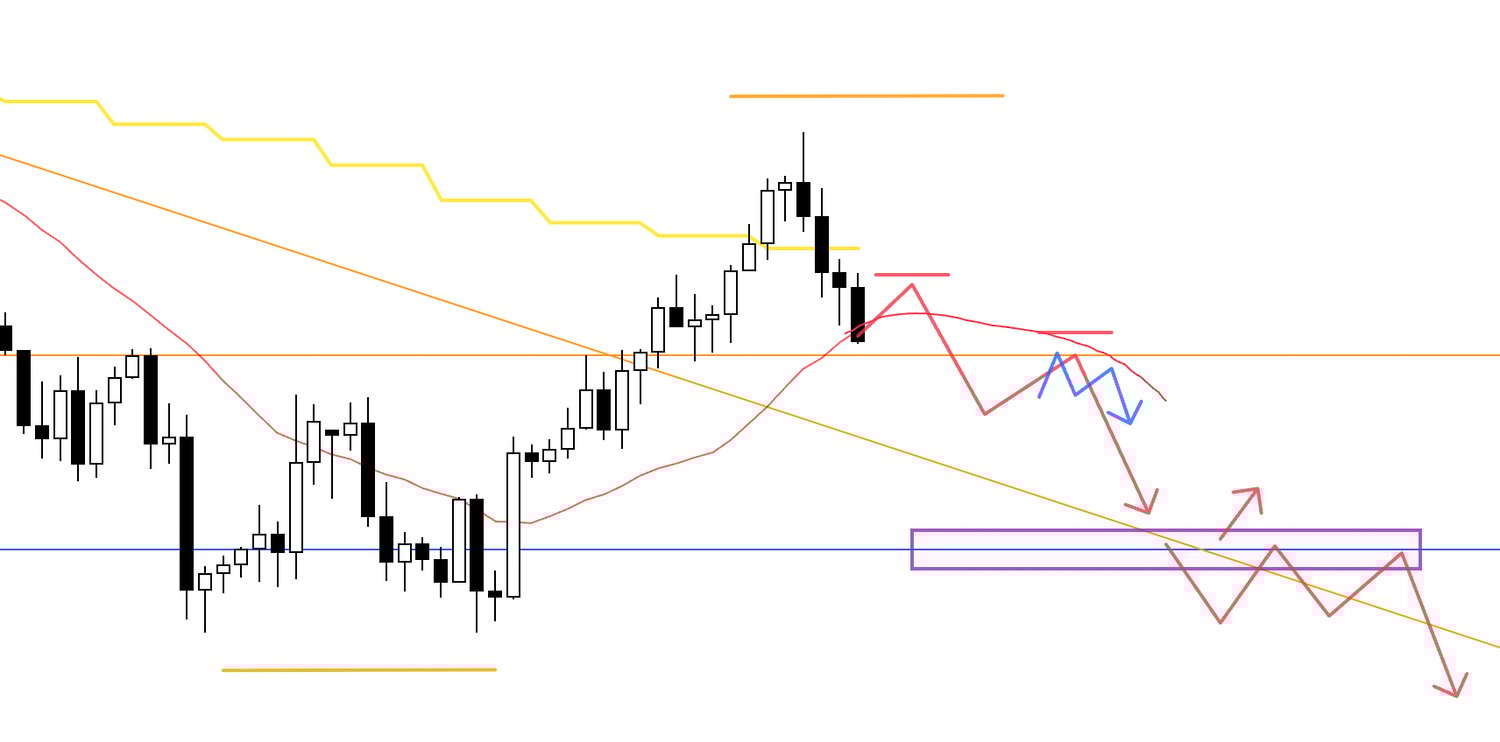
Let’s zoom in to the 4h.
4h
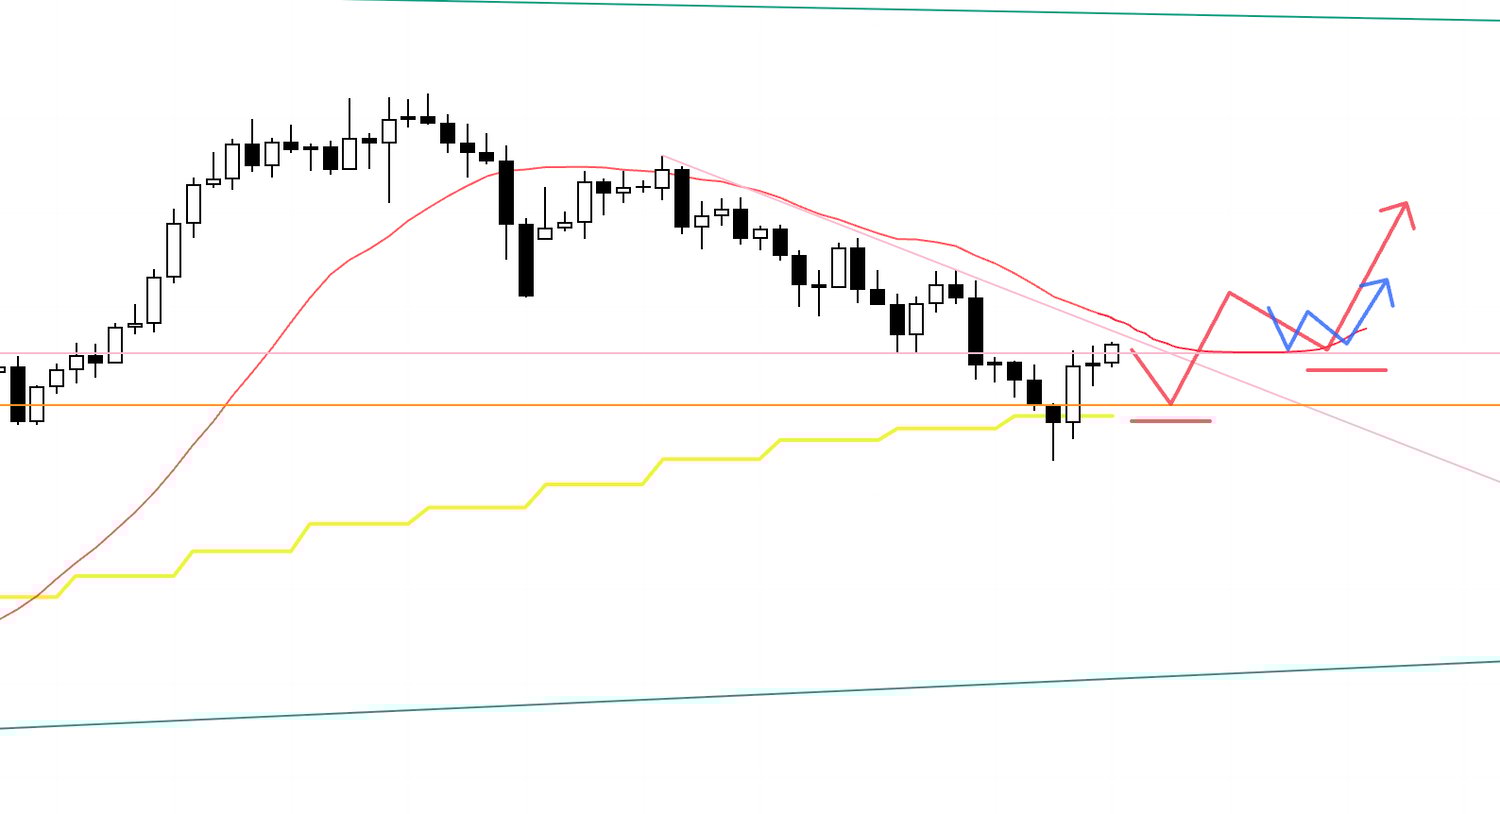
For example, if price cannot break below the lower orange line and starts to put in higher lows as if supported, I will look to buy on the lower timeframes.
4h
I don’t know exactly what shape that higher‑low pattern will take in real time, but the decision logic is the same.
4h
For shorts, if price is capped by the orange line and the daily moving average (yellow), forming a daily lower‑high, and if 4h also sets a lower‑high, then I will look to sell at the lower‑timeframe lower‑high / lower‑low break.
However, the further it falls the higher the risk that weekly dip‑buyers step in, so around the green trendline below I plan to secure partial profits—e.g., take half off.
Next, EURUSD.
〜・〜・〜・〜・〜・〜・〜・〜・〜・〜・〜・〜・〜・〜・
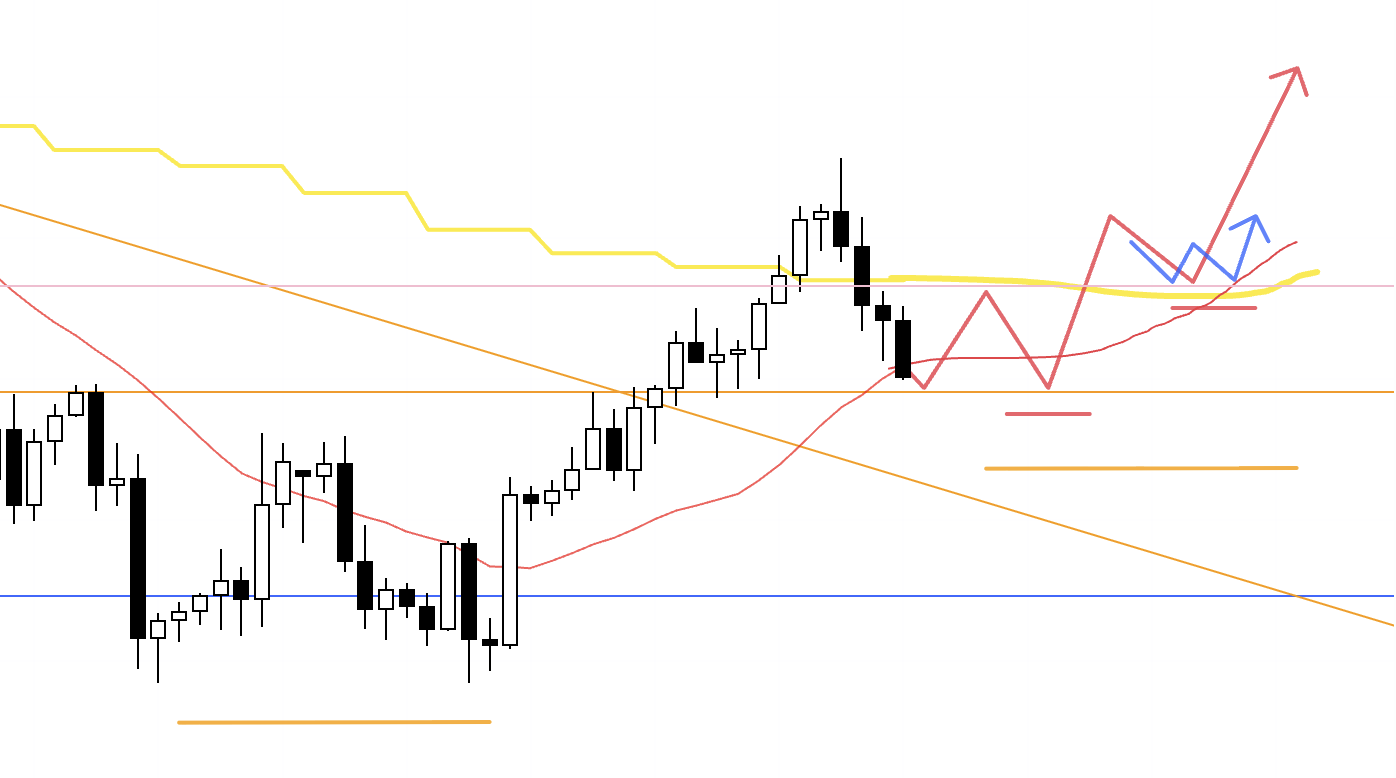
EURUSD
Weekly
On the weekly the pair remains in an uptrend with higher lows and higher highs, but new highs have been narrower and topside has grown heavy.
This blue line is likely to be widely watched, so I want to observe how price behaves around it.
Let’s check the daily.
Daily
On the daily we’re trending lower with a sequence of lower highs and lower lows, but this downtrend is the pullback that forms the weekly higher‑low.
If price cannot break below the blue line and then turns back up into an uptrend, that would be the initial leg of a weekly pullback buy, where the long side tends to have an edge. (green arrows)
That said, the daily moving average (yellow) is still sloping down and capping price from above, so at a minimum I want it to flatten and start to act as support from below, or see price reclaim a flattened average.
On the other hand, for shorts, if price breaks below the lower blue line and then is capped by that same blue line on a retest, forming a lower‑high, I will consider selling.
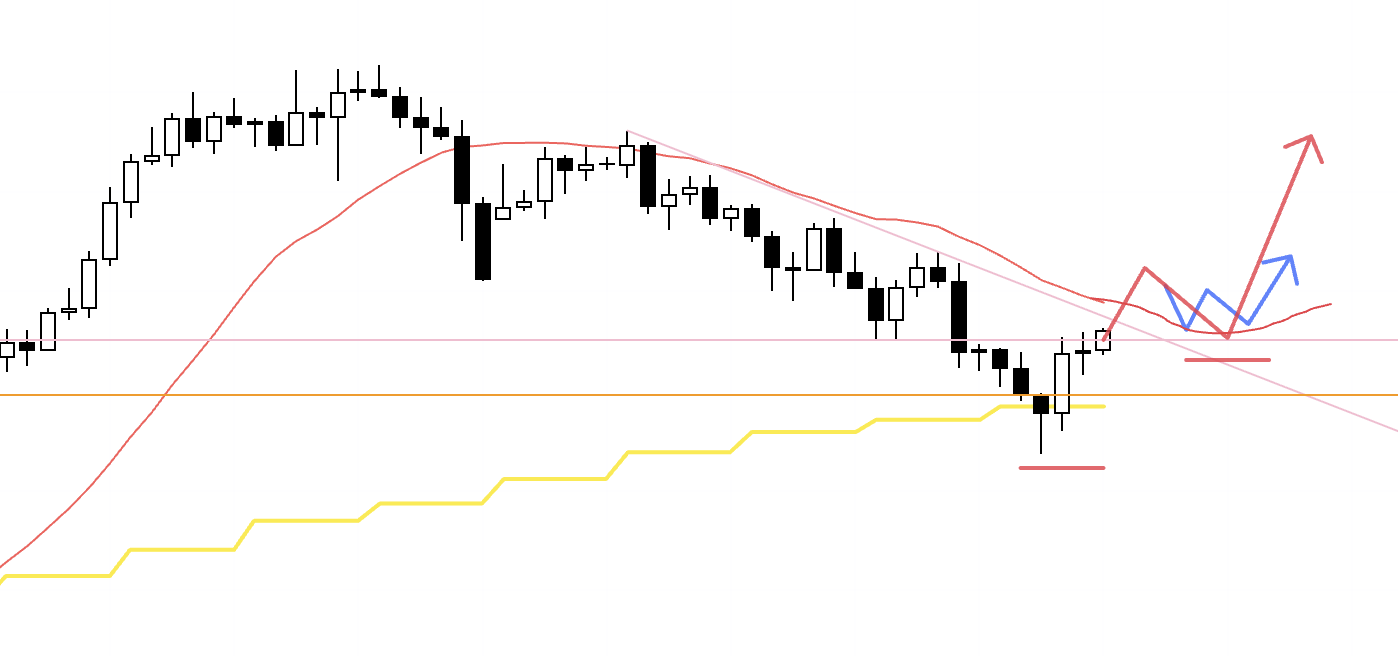
Let’s also look at the 4h.
4h
If, within the daily higher‑low area, the 4h also starts to print higher lows, I will consider longs on the lower timeframes.
As noted on the daily, I will judge it in the context of how price relates to the moving averages.
4h
For now the daily downtrend has not been invalidated, so if price is capped by the orange line and forms a 4h lower‑high, I can still consider shorts, but buyers are likely to grow around the lower blue line.
The key is whether the risk‑reward from the entry down to that blue line is acceptable.
If a position is open, I expect to secure partial profits—e.g., take half off—near that line.
4h
If the downswing fails to even reach the lower blue line, instead sets a higher low and turns up, I need to follow the advance as the weekly dip‑buy that emerges from a daily higher‑low.
I don’t know exactly how price will evolve, but I will assess in the moment with reference to the moving averages and broader context.
〜・〜・〜・〜・〜・〜・〜・〜・〜・〜・〜・〜・〜・〜・
That’s all for now.
These are scenarios as of today, and as the week unfolds I will update and build them in real time as price action develops.
Up‑front scenario work is critical, and the bulk of my job ends with building these scenarios.
Because the scenarios are pre‑defined, what I should wait for is clear, and I can simply wait.
When it’s time to execute, the only thing left is to click, and because the plan is in place there’s no hesitation at the point of execution and no regret afterward.
Post‑entry, rules for when to move the stop and when to take profit are defined in advance, so there’s no second‑guessing after entry.
What derails our trading is “thinking” rooted in subjectivity.
Thoughts that arise mid‑trade often look like plausible logic, but they are mostly emotional reactions.
By setting scenarios ahead of time and reducing the live task to waiting and executing, we prevent this kind of thinking from interfering and keep the focus on process execution.
If my consistent planning and execution helps you trade more consistently, all the better.
These trade scenarios are my own plan.
If your approach is not yet fully formed, feel free to use them as reference points for building your own strategy, but if your style is already firm, don’t be swayed by my plan—stick to your rules.
Thanks for reading to the end.