

Hello.
I’m laying out trade scenarios for the week ahead.
This “Trade Scenarios” blog is posted every Sunday.
And every Saturday, I publish a “Weekly Trade Report” that details how I actually thought through and executed trades during the week.
Read together with the scenario post, you’ll be able to see how I plan in advance, what I wait for, and how I execute, providing a consistent, practitioner‑level process you can reference.
For my strategy framework, please see my posts on Dow Theory and multi‑timeframe analysis.
A scenario is not a prediction.
It is not a forecast, but my personal plan of action defined as “if X happens, I will do Y.”
I do not predict markets, and this is not that, so please understand that upfront.
This is not an instruction to buy or sell, nor is it a signal service.
It does not guarantee future profits.
It is offered strictly for educational purposes to show how I execute a consistent process.
I cannot take responsibility for any outcomes of your trades, so please trade at your own risk.
Let’s start with USDJPY.
(On my charts, line colors denote timeframes: orange = daily, red = 4h, blue = 1h, green = 15m.)
〜・〜・〜・〜・〜・〜・〜・〜・〜・〜・〜・〜・〜・〜・
USDJPY
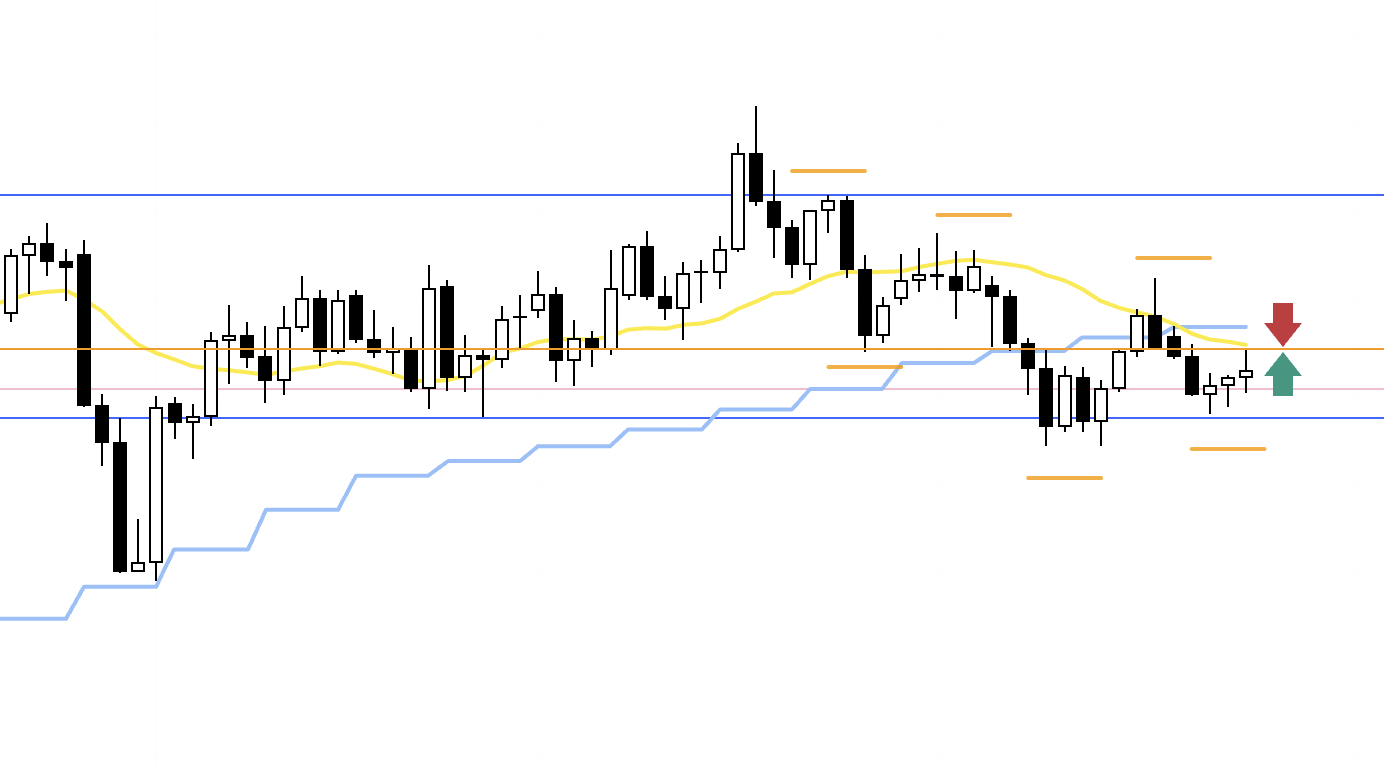
Weekly

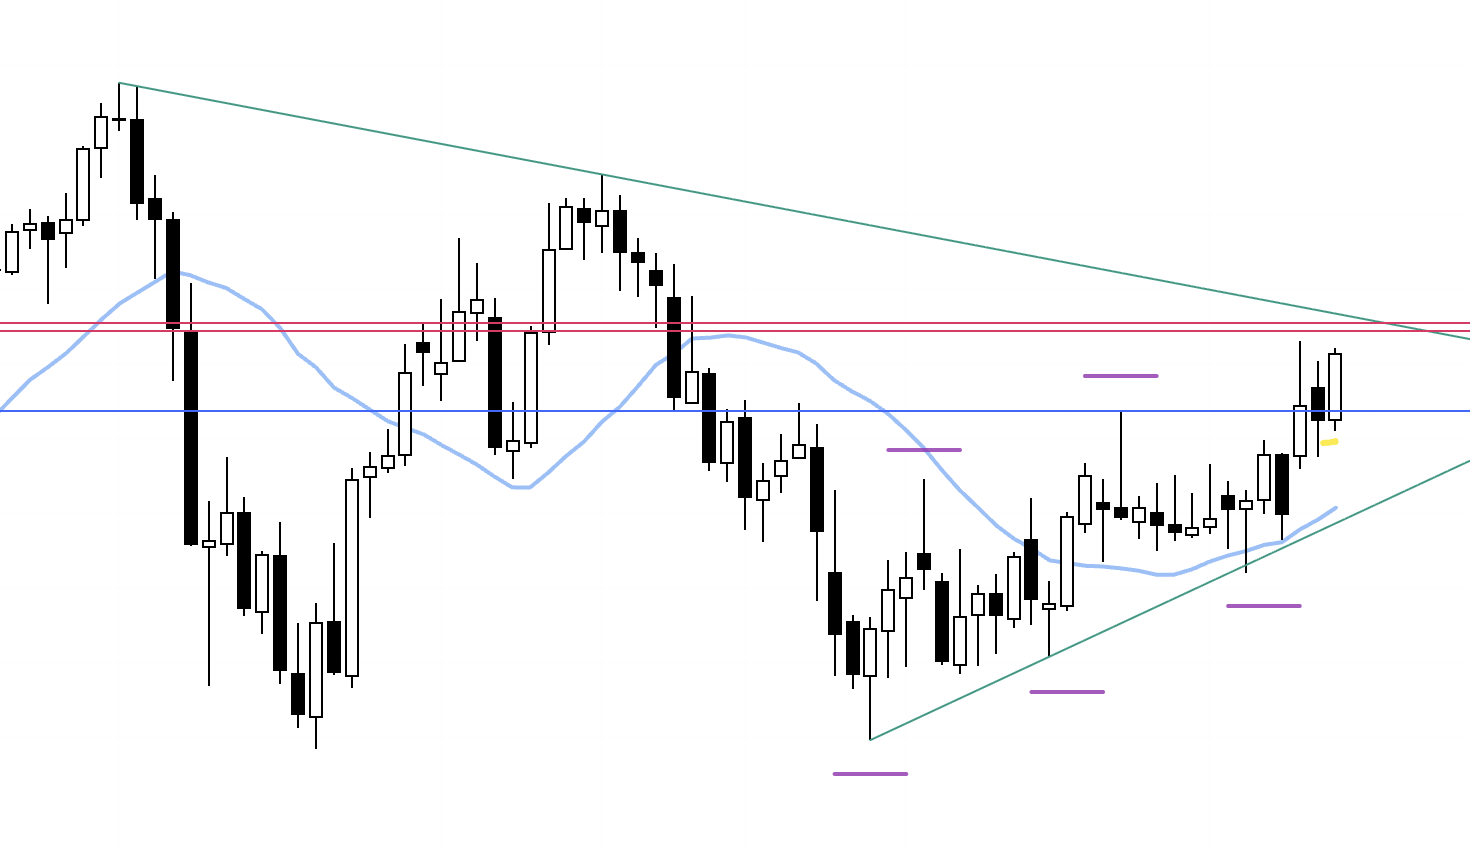
The weekly chart has been printing higher lows and taking out highs, i.e., an uptrend.
However, price is approaching a descending trendline (green) that can be drawn off the series of lower highs on the monthly.
It’s less obvious on the weekly, but on the daily there are two red lines that mark levels likely to draw attention, and where these red lines overlap with the green trendline, selling pressure may increase.
Keep that in mind when building long scenarios.
Daily
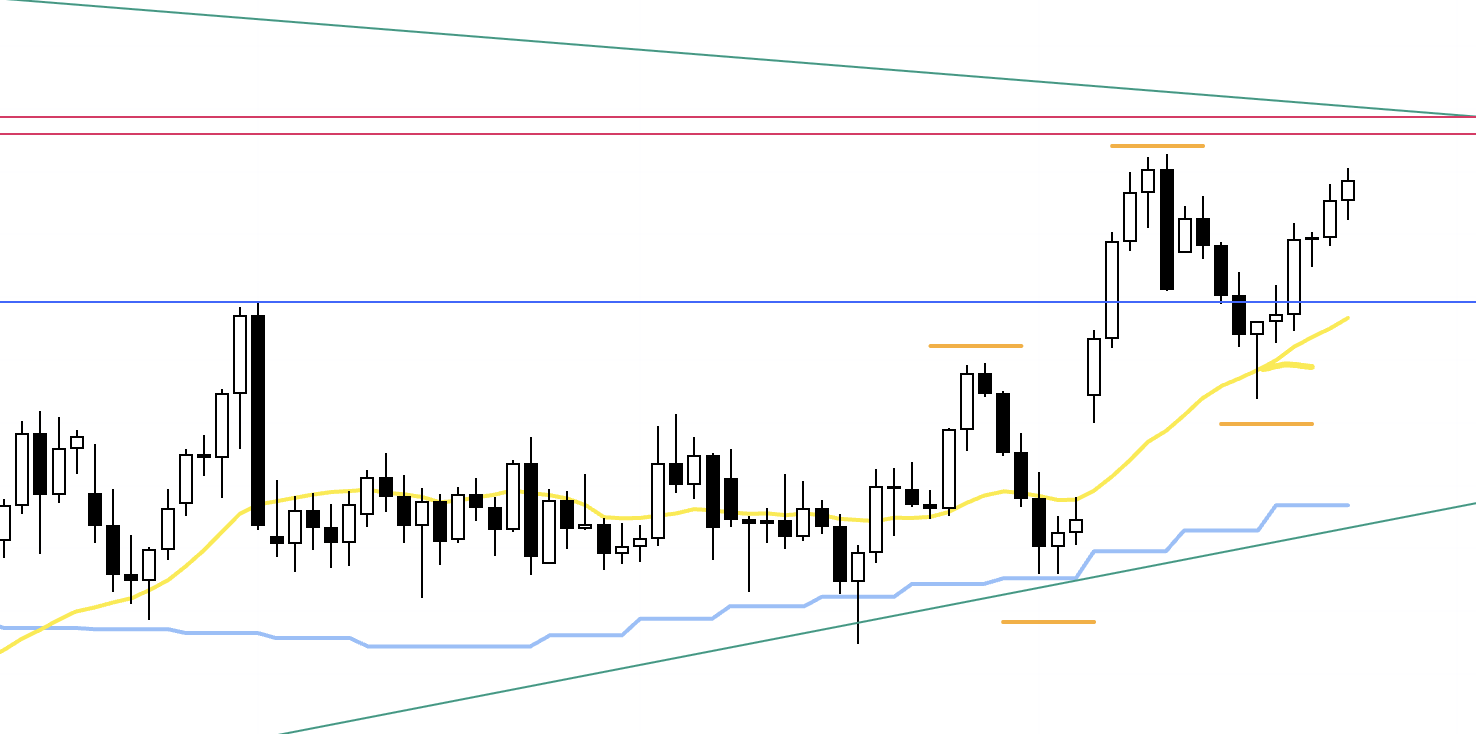
Here is the daily chart.
Last week, the pair continued higher as the 4h upheld the daily dip‑buy structure.
We’re already in a high‑price zone, so if buying, I’d like to see a clean reversal off a well‑defined support.
Conversely, if selling, it would be with full awareness of the daily dip‑buying forces.
With that in mind, let’s look at the 4h.
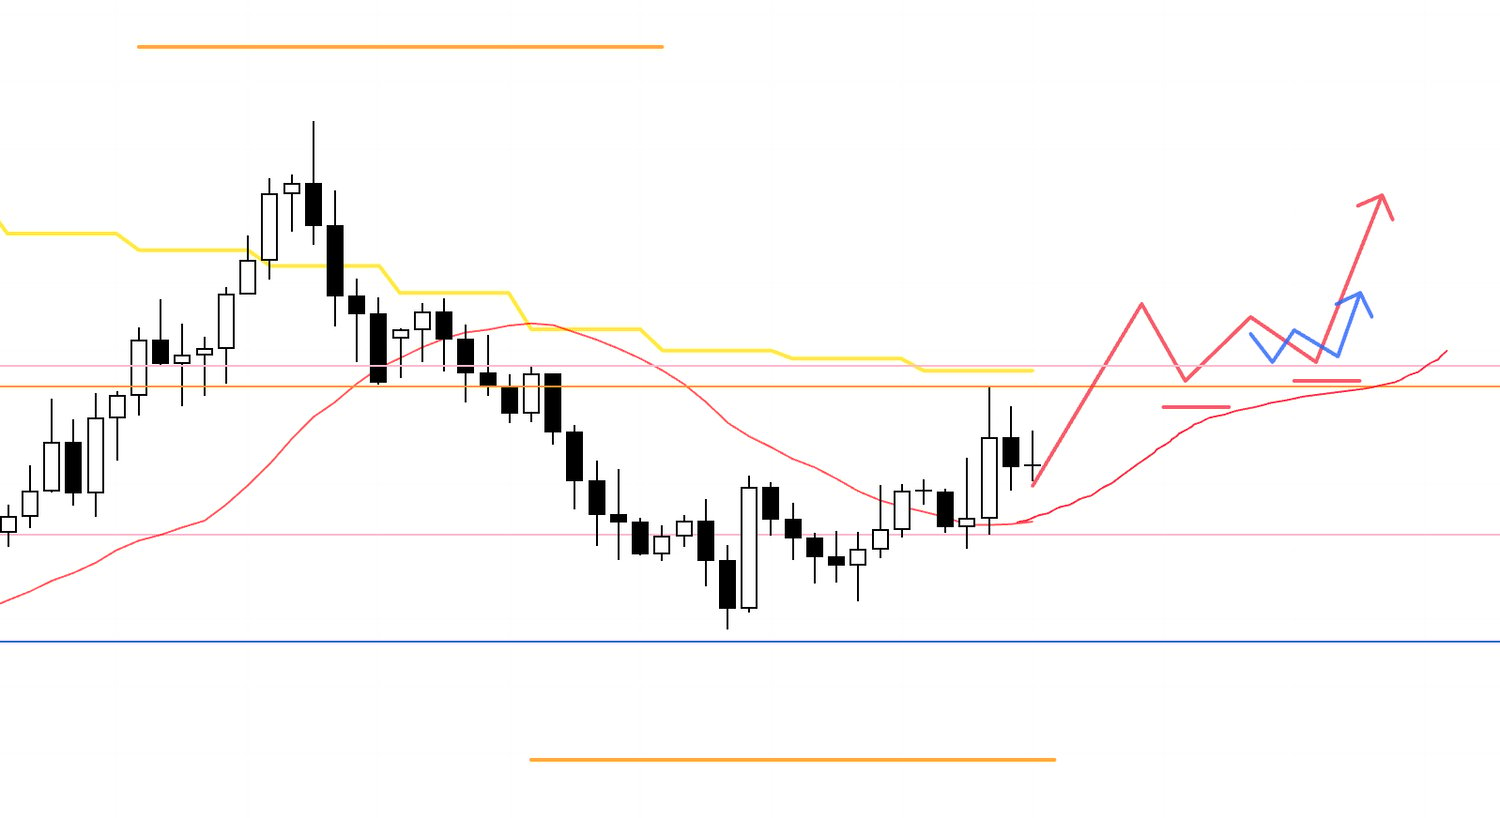
4h
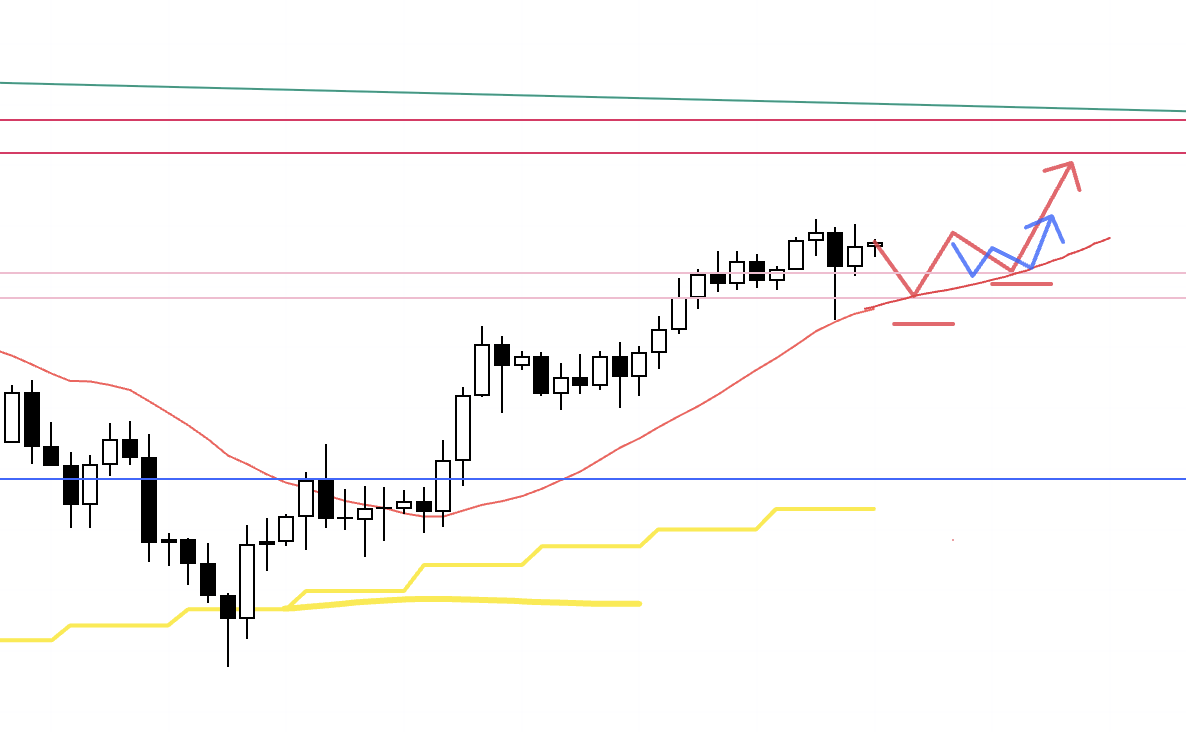
If price carves out a fresh higher‑low pivot, I will look for long setups on the lower timeframes within that structure.
That said, overhead we have the trendline and the red bands of resistance, so the key is whether the entry offers a favorable risk‑reward at initiation.
If I do take a position, I will look to secure partial profits—say, half—into those overhead areas.
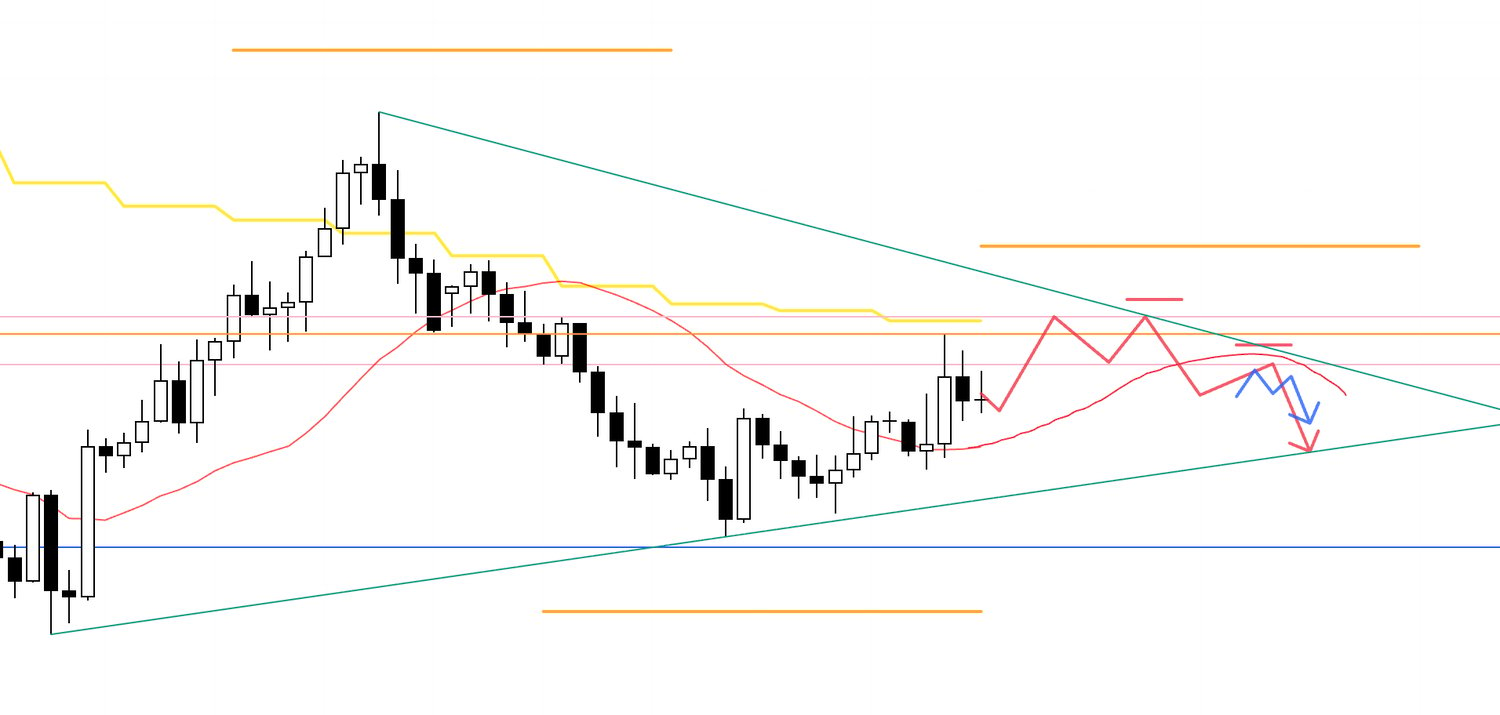
4h
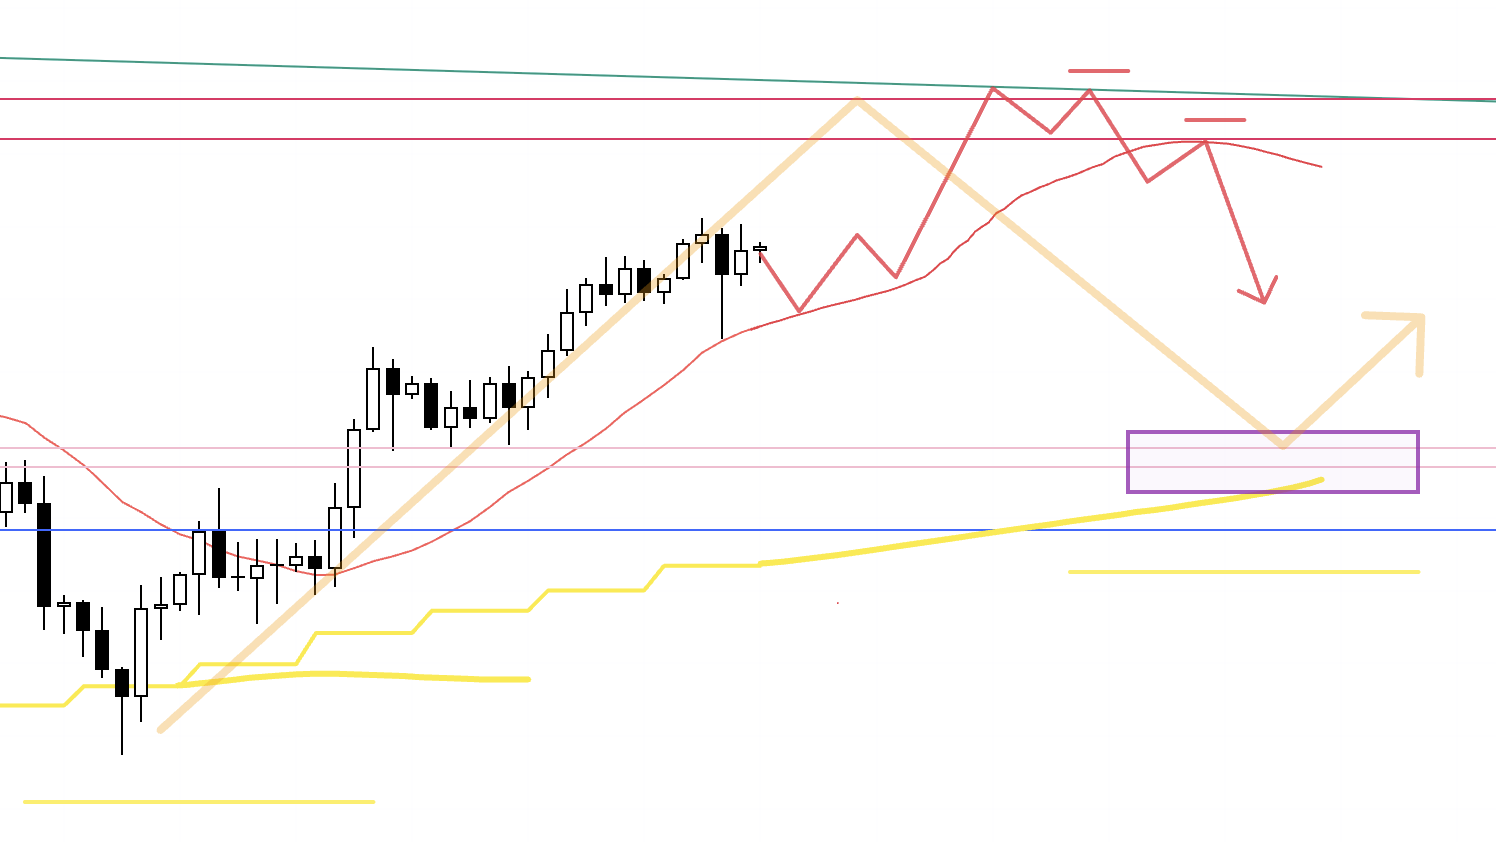
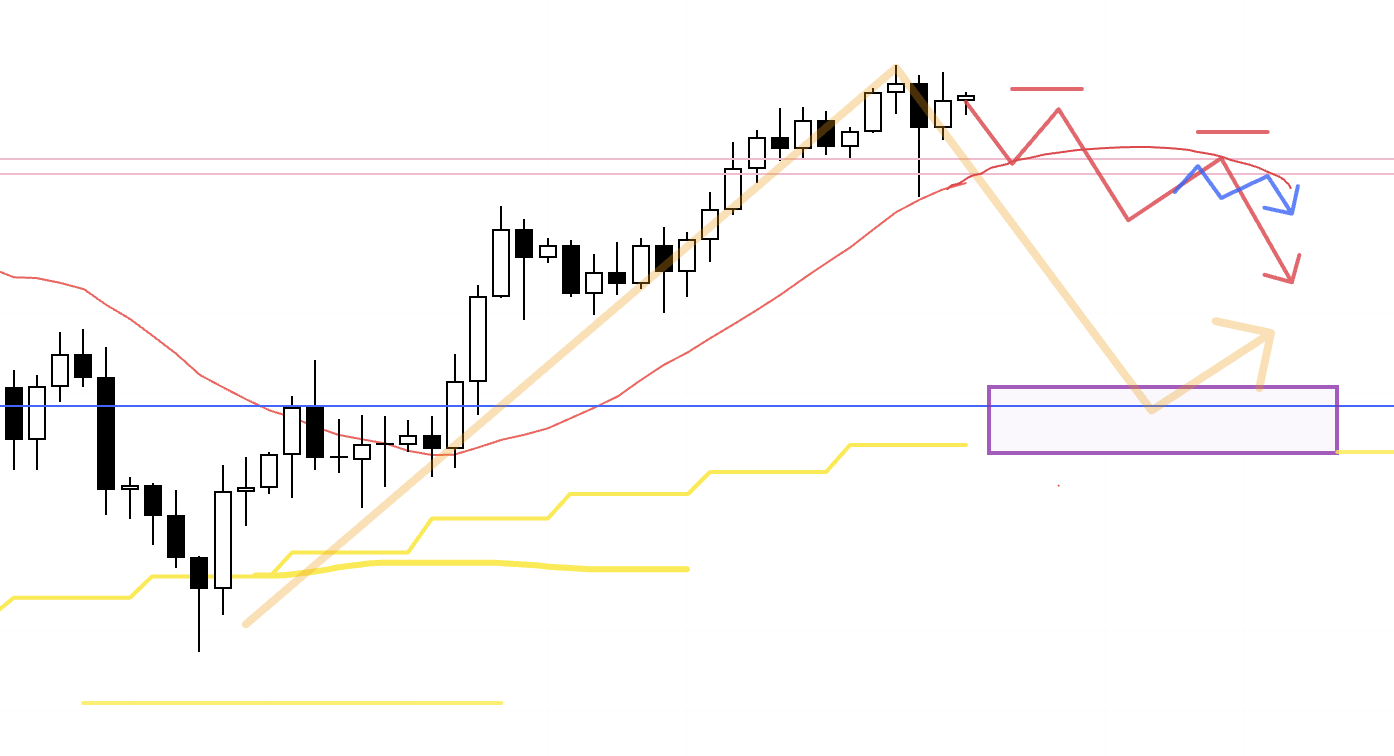
After an advance, if price gets capped by the trendline or marked levels and the 4h starts to roll into lower highs, and if it is also held down by the moving averages, I will look to participate in the decline as part of a daily pullback formation.
The deeper it falls, the stronger the daily dip‑buying interest becomes.
So I’ll prioritize entries as high as possible where the risk‑reward is favorable, and once in, I’ll manage by taking half off into key inflection levels.
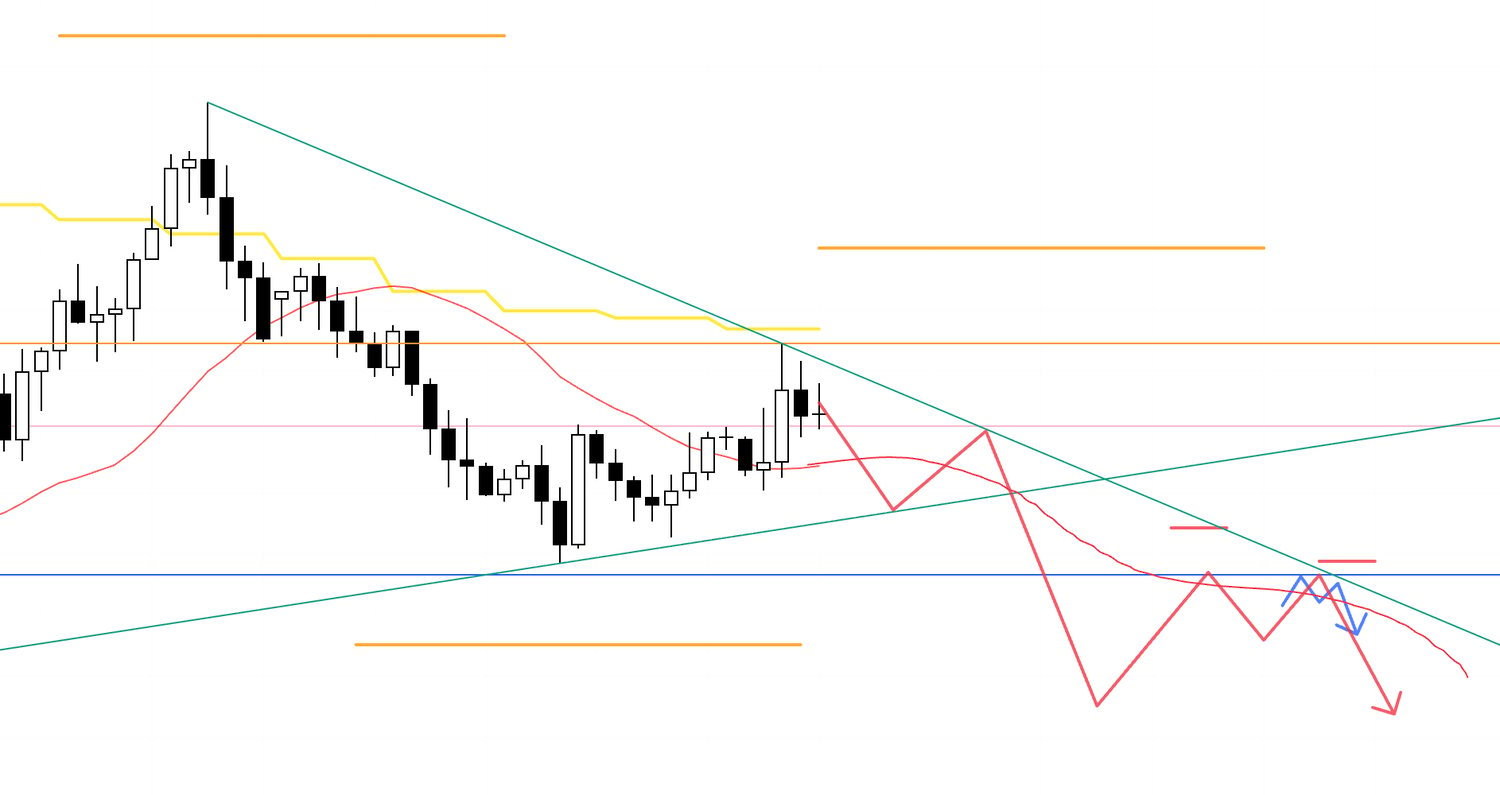
4h
On the 4h, we’ve broken the most recent swing low but have not yet formed lower highs, and the moving averages are still offering support from below.
Selling right here is difficult.
For shorts, I want to see price break below the moving averages, then form a lower‑high pivot while getting pressed down from above by those same averages or other structures.
That would open up short opportunities on the lower timeframes.
Again, as price moves lower, daily dip‑buying interest intensifies.
So the question is whether I can initiate from as high a level as possible with attractive risk‑reward, and if in a position, I’ll secure partial profits—half—at key levels.
4h
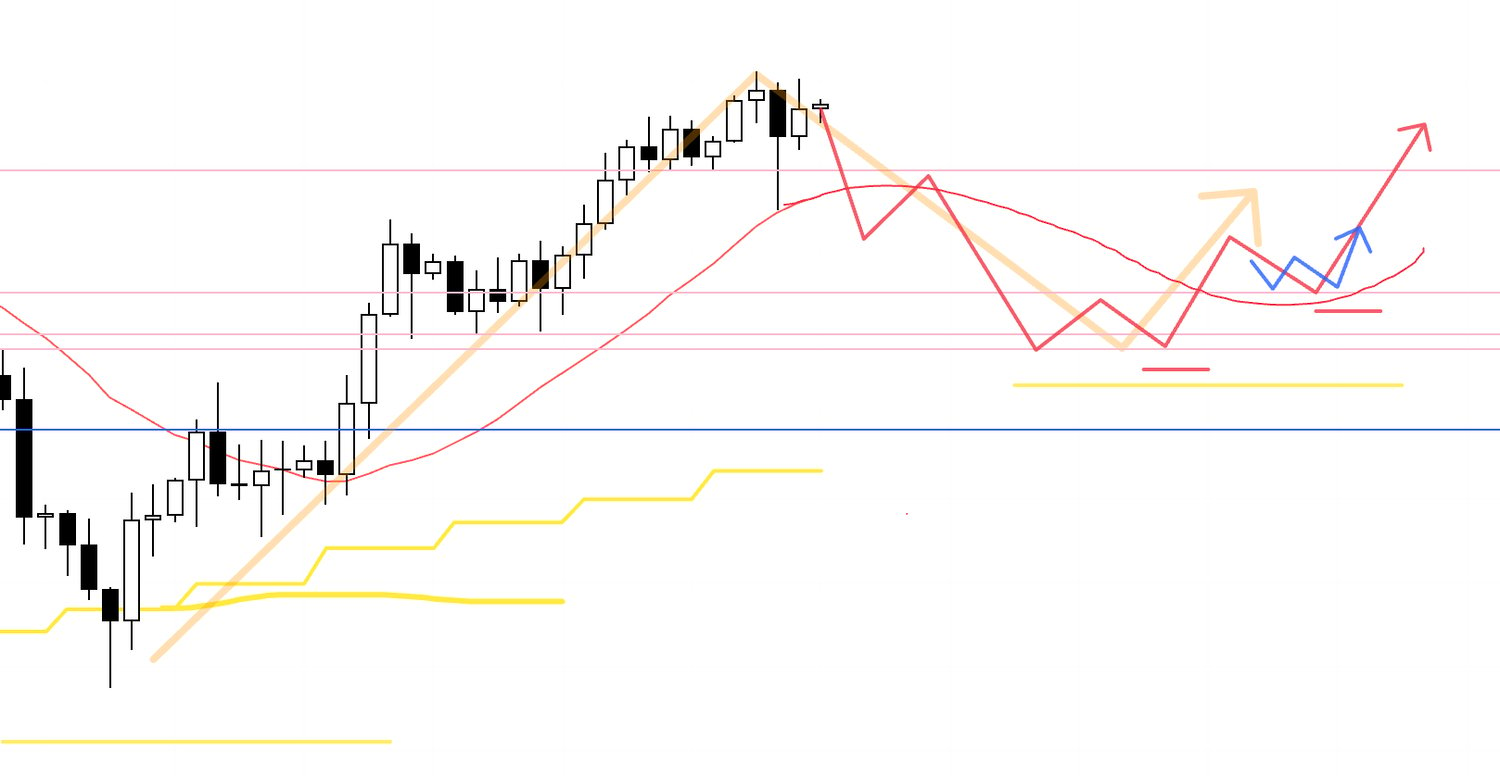
After a decline, if the 4h ends its down phase and transitions back into an uptrend, that inflection becomes a daily dip‑buy entry with edge.
I will consider longs there.
Now let’s look at EURUSD.
〜・〜・〜・〜・〜・〜・〜・〜・〜・〜・〜・〜・〜・〜・
EURUSD
Weekly
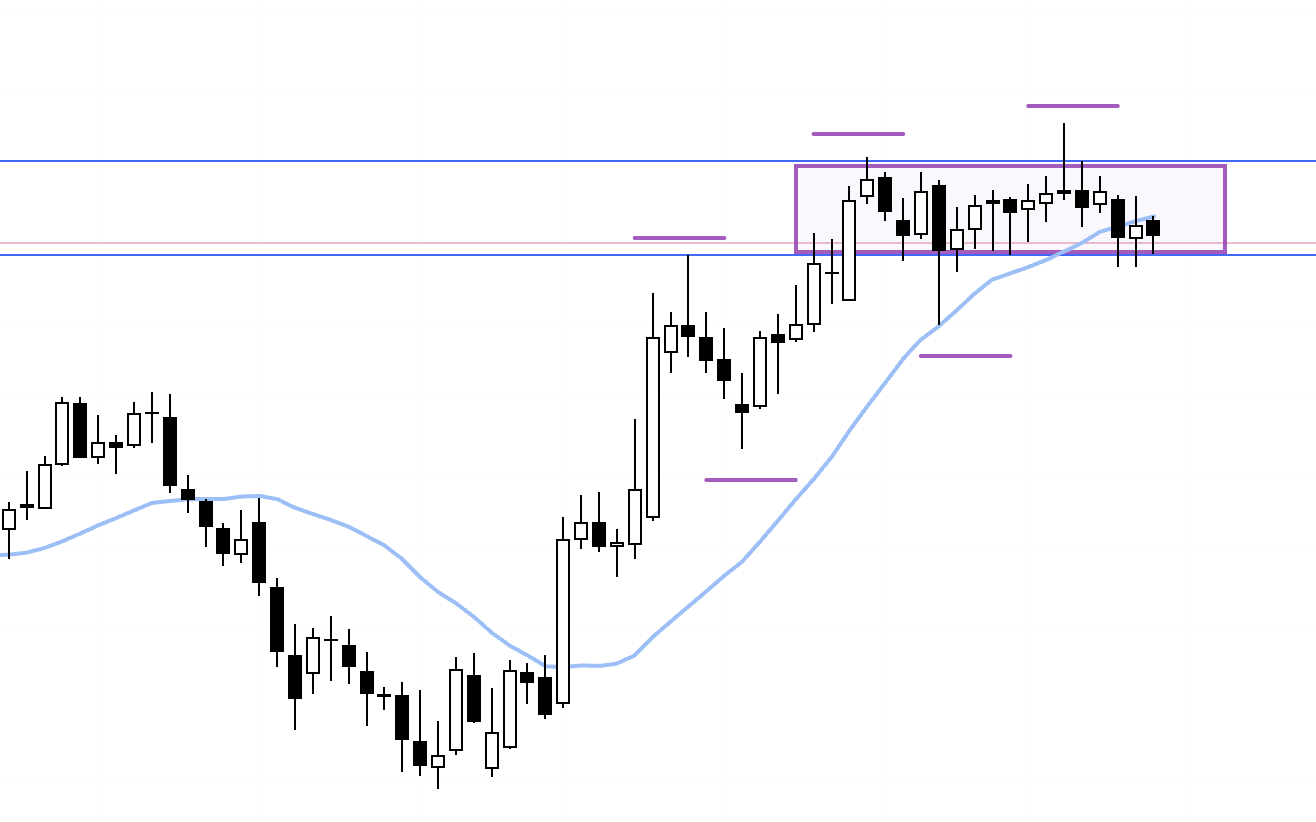
EURUSD is in an uptrend on the weekly, but price has been ranging within the boxed area bounded by the blue lines.
The question is whether we set another higher low and break the highs, or roll into lower highs and break the lows.
Within this range, both boundaries need to be respected.
Daily
On the daily, price has been making lower highs and lower lows—i.e., a downtrend—but most recently it looks to be forming a higher‑low pivot off the blue line.
Should the daily start printing higher lows, that would connect into a weekly dip‑buy advance.
Even so, I cannot buy immediately from here.
Please see below.
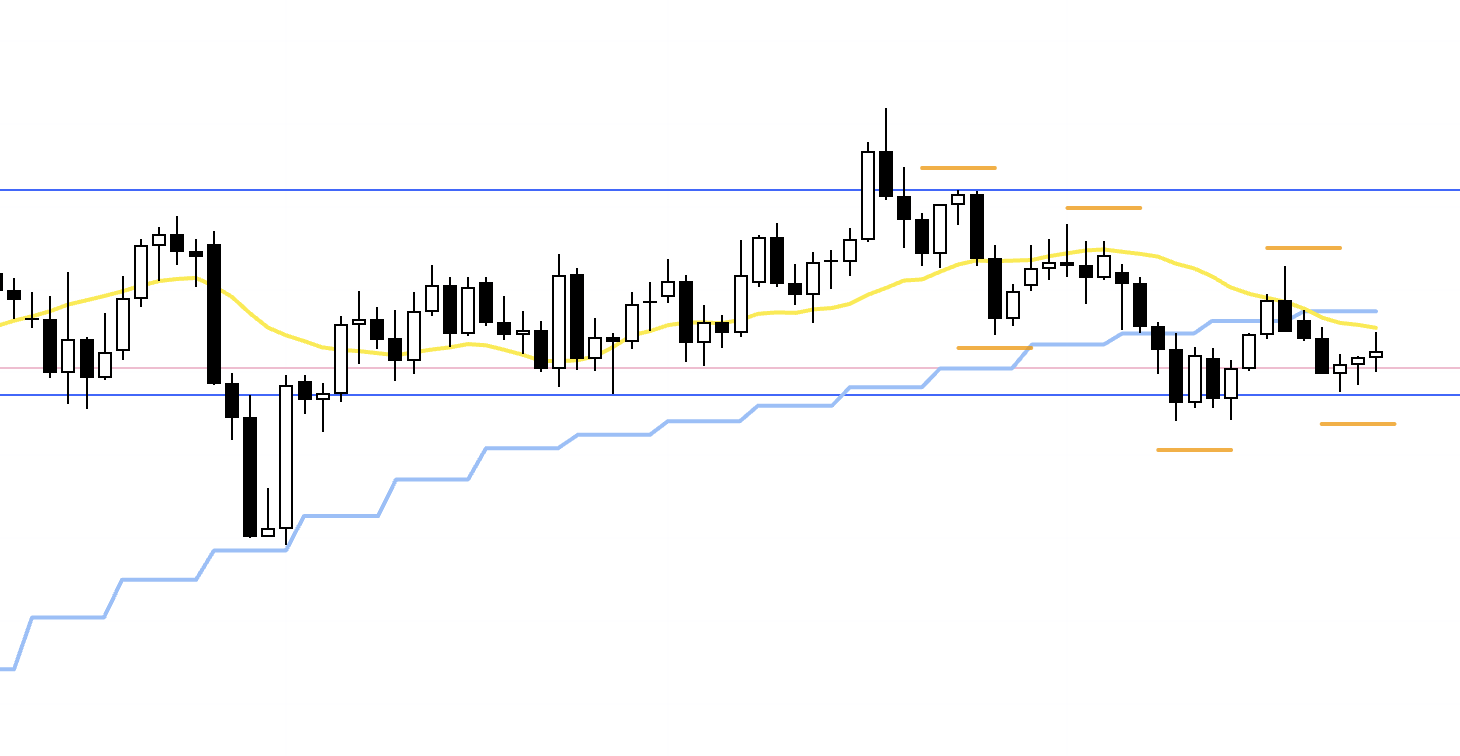
Daily
The orange line is drawn off prior lows and, for now, it effectively demarcates sell and buy zones.
If buying, I’d like to see a break above that line and then buy a pullback.
If selling, I’d first want to confirm that price is being capped by that line.
However, there is also a blue line just below, so I’d prefer not to get involved in the chop between the orange and the blue.
Ideally, I would only consider shorts after a clean break below the lower blue line.
With that in mind, let’s check the 4h.
4h
If price first breaks above the orange line and then builds a 4h higher‑low pivot while holding that line from above, I’ll consider longs on the lower timeframes.
4h
Conversely, if price fails to break above the orange line and also gets pressed down by the daily moving averages, forming a fresh lower‑high pivot on the daily, I could consider shorts depending on the 4h structure.
That said, the daily also appears to be forming higher lows, which draws an ascending trendline that will support from below.
In that case, I would be reluctant to short.
4h
Therefore, for shorts I’d much rather see a decisive break below the lower blue line first.
Then, if price retests and is capped by that blue line, a trendline, or the moving averages while forming a lower‑high pivot, I will look to sell.
〜・〜・〜・〜・〜・〜・〜・〜・〜・〜・〜・〜・〜・〜・
That’s all for now.
These are my scenarios as of today, and as the week gets underway I will update or rebuild them in real time as price action unfolds.
I always plan first and act second, which keeps me a step ahead of the chart and prevents knee‑jerk decisions.
I map where the risks might lie, what conditions create edge for longs, and what conditions create edge for shorts, then I translate that into an action plan—the scenario.
From there, I wait, and if the conditions are met, I simply click.
This way, whatever the outcome of any given trade, I’ve merely collected one necessary sample, with no regrets, and without panic or hesitation in front of the screen.
As I always say, a scenario is not a prediction.
I am not predicting the chart’s future.
I am describing the future of my actions.
“Not being able to wait” means “not having a clear object to wait for,” which in turn means “not doing the trader’s job.”
Many traders think that holding a position is the job.
For me, scenario construction is one of the most important parts of the job, and it is no exaggeration to say that once the scenario is built, most of the trader’s work is done.
I hope my consistent planning and execution helps you build consistency in your own trading.
These scenarios are my personal plan.
If you’re still developing your approach, treat them as a reference for building your own strategy.
If you already have a defined method, don’t let my plan distract you—stick to your rules.
Thanks for reading.