

I’m going to review the key points from this week’s trading, centered on the trades I actually took.
This Weekly Trade Report is published every Saturday.
If you read it together with Trade Scenarios, which I post every Sunday, you’ll see how I think ahead of time and how I execute in real time against those pre‑defined scenarios.
This is not advice on “how you should trade,” nor am I claiming this is the right answer.
It’s not about showcasing individual wins and losses, nor is it a recommendation of any strategy based on those outcomes.
What I aim to show at a practical level is how I repeat a consistent process grounded in advance scenarios—process consistency you can use as a reference for building your own strategy and execution discipline.
Results are solely my own and do not guarantee your future profits.
With that in mind, please conduct your own testing and preparation, and trade at your own risk and responsibility.
My approach is buying pullbacks and selling rallies on the 4h timeframe.
For the details of my pullback‑buy and rally‑sell framework, please read my past blog posts on Dow Theory and multi‑timeframe analysis.
Let’s look at the charts.
USDJPY 4h

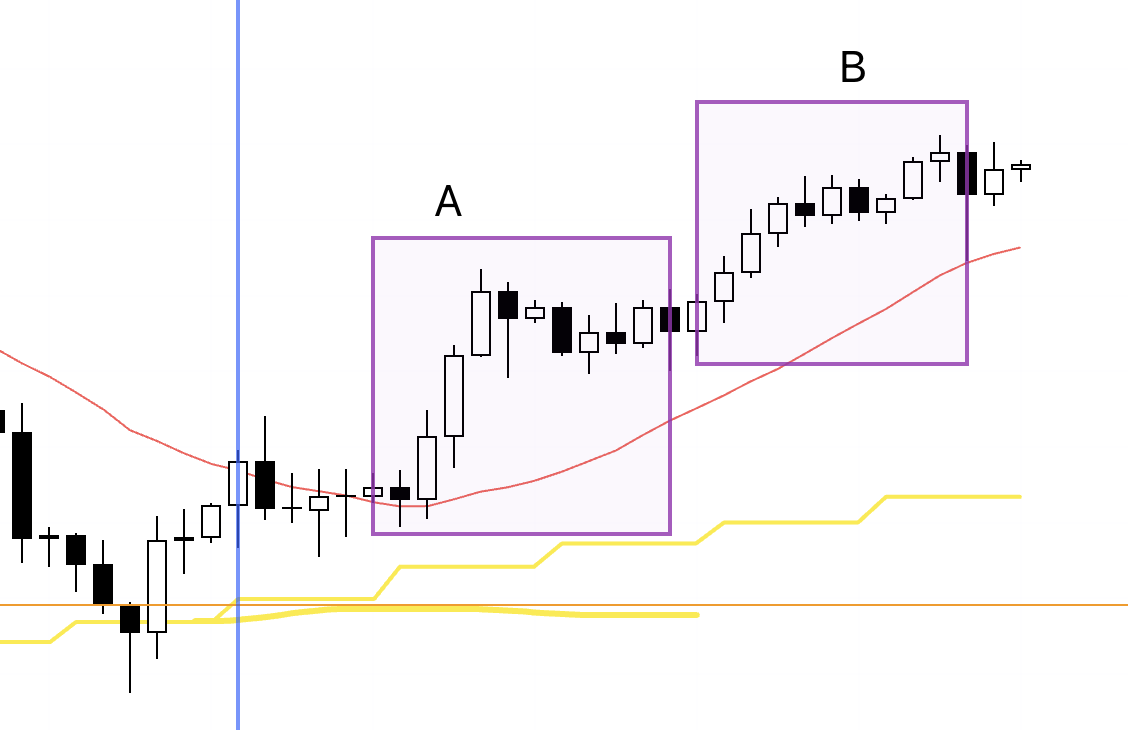
This is the 4h chart of USDJPY.
This week’s action is shown from the blue vertical line onward on the chart.
As outlined in last Sunday’s Scenario post, USDJPY was a daily pullback buy, flipped into an uptrend, and continued to push higher on 4h without breaking trend structure.
I traded the two 4h pullbacks labeled A and B by drilling down to lower timeframes.
I took screenshots during both trades, and I’ll walk through them in a moment.
Next, please see the EURUSD chart below.
EURUSD 4h

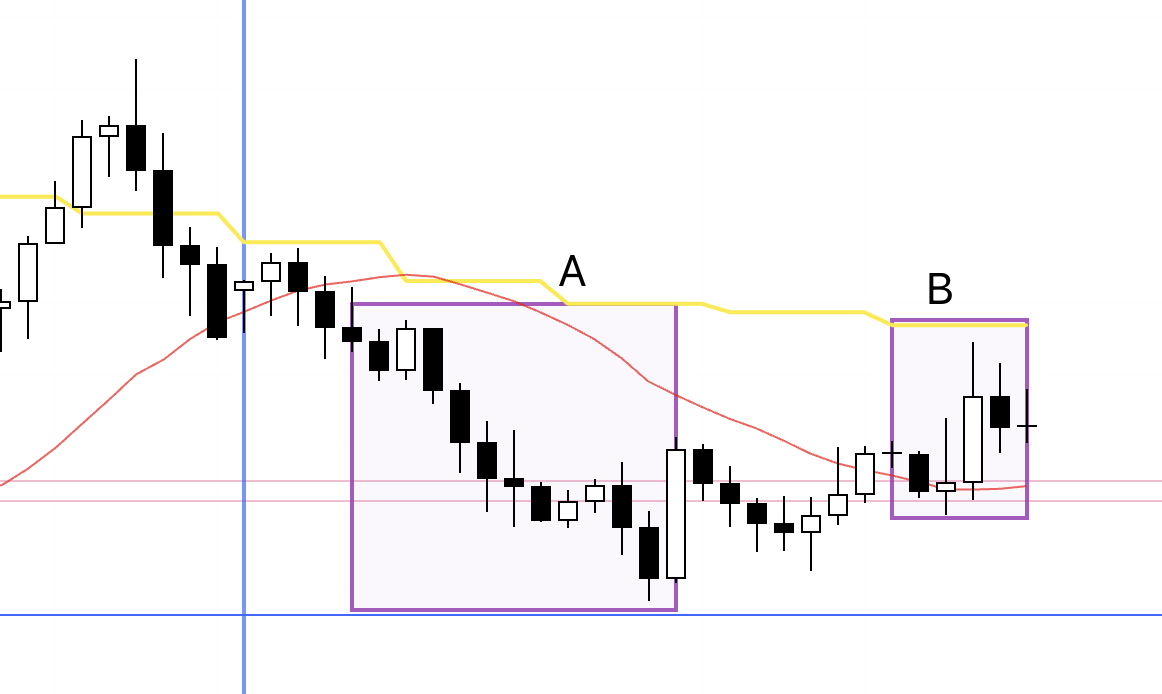
This is the 4h chart of EURUSD.
Both the sell scenario and buy scenario I outlined on Sunday for EURUSD materialized beautifully.
In practice I only traded A, and I skipped B because it overlapped with economic data releases, but the technicals were clean and matched the scenario I had mapped out in advance, so I’ll also explain B later.
First, I’ll start with the trades I actually executed.
〜・〜・〜・〜・〜・〜・〜・〜・〜・〜・〜・〜・〜・〜・
October 21 (Tue)
EURUSD
4h chart from the Sunday Scenario post
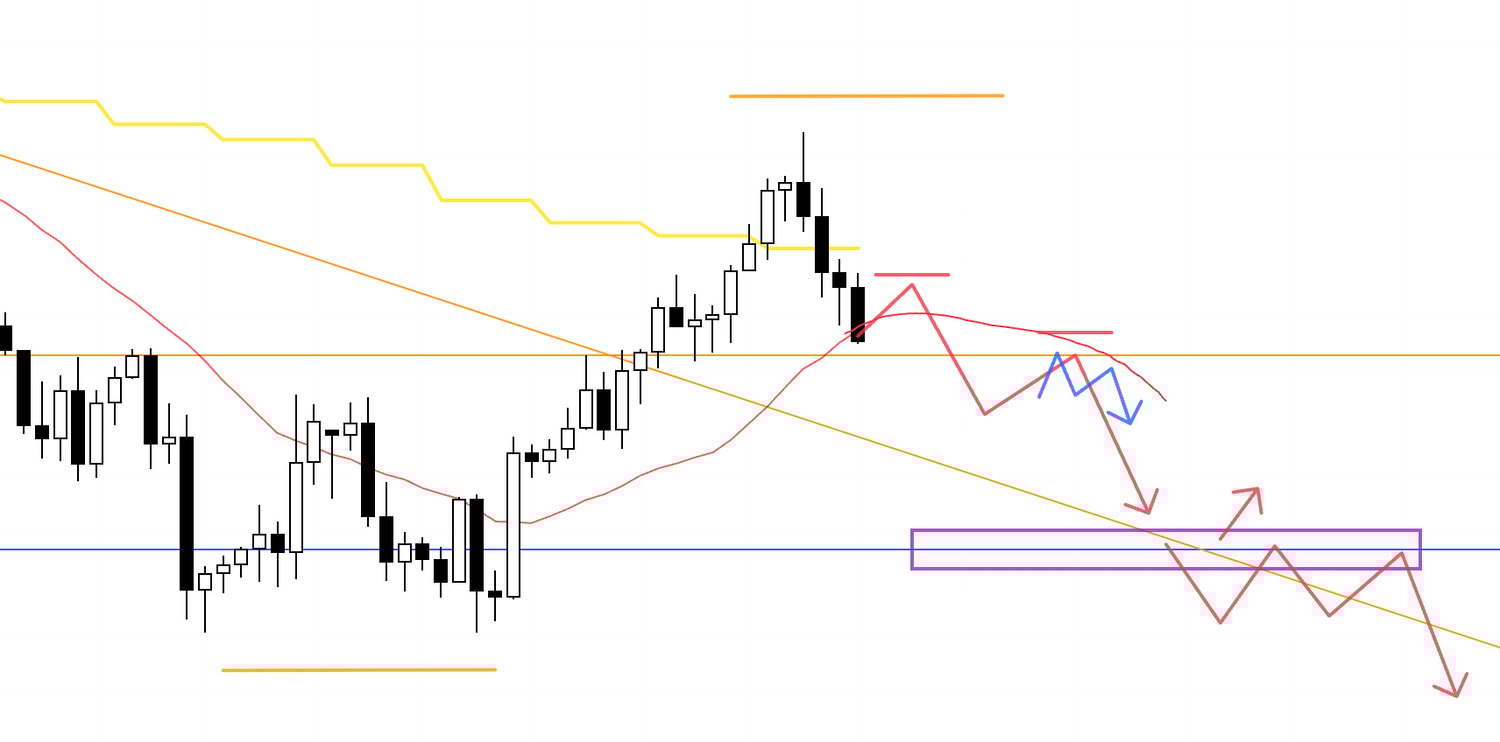
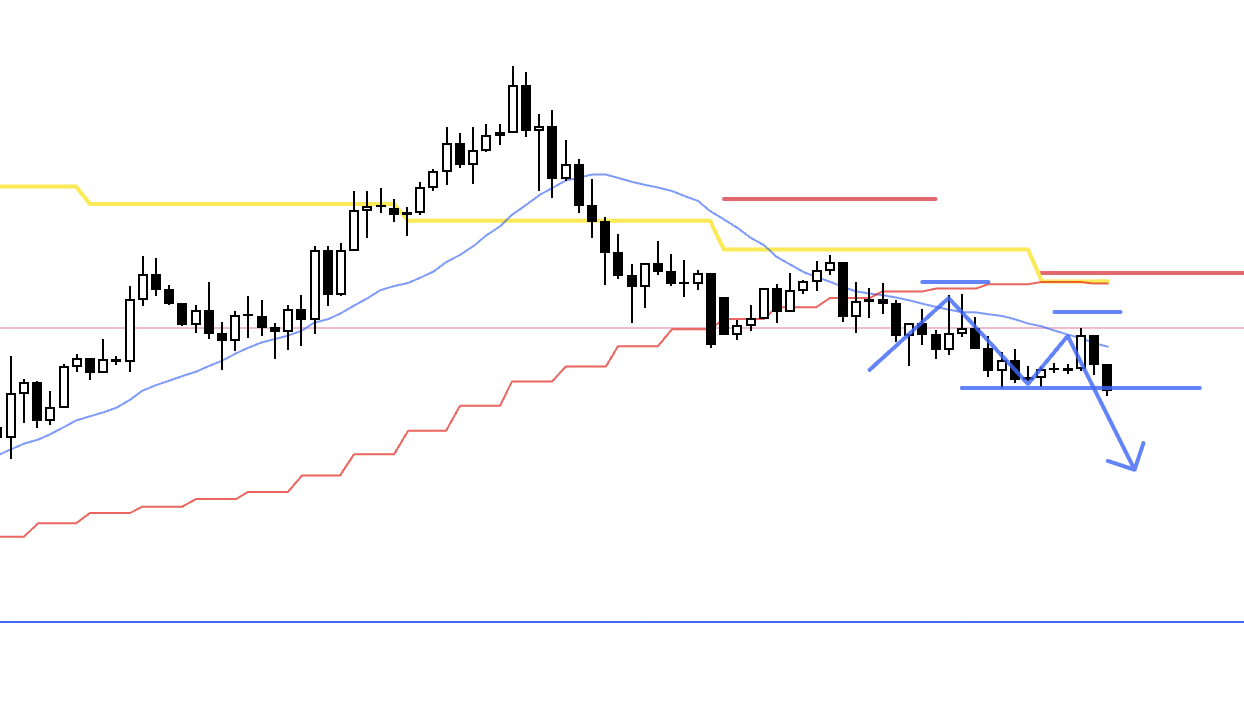
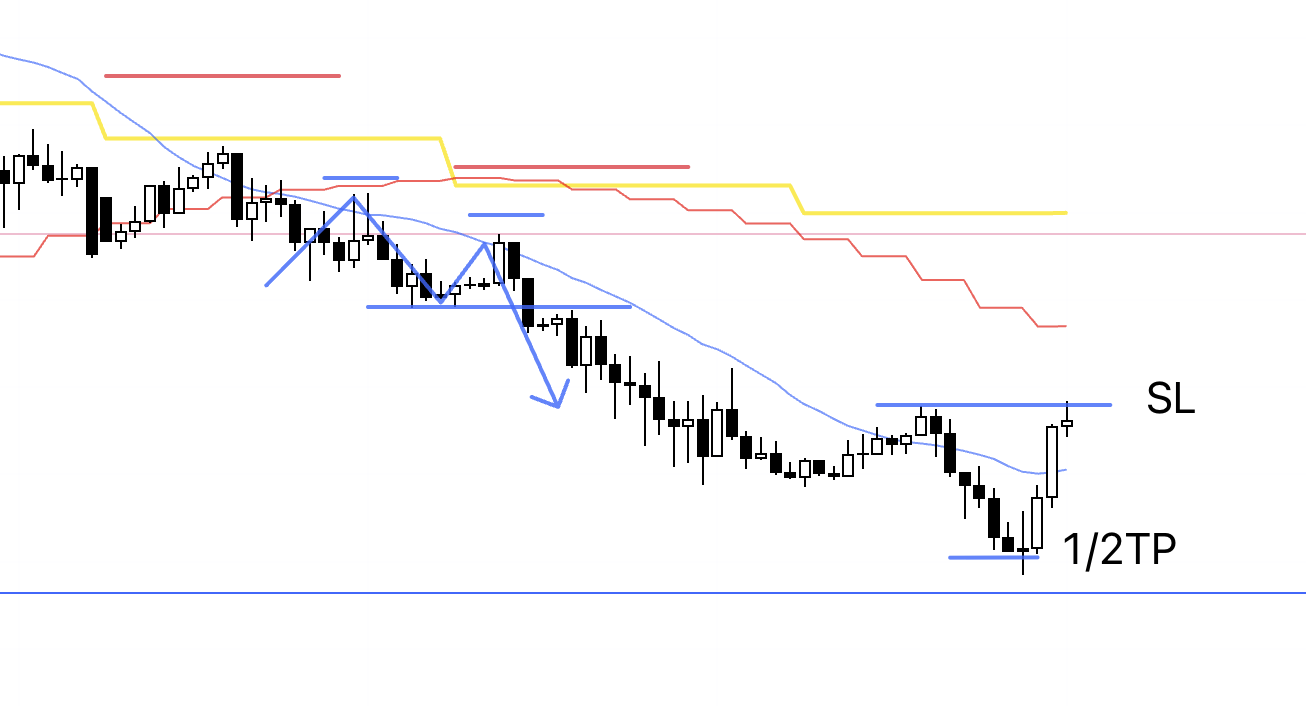
This is the short scenario I posted on Sunday.
I was looking for a lower‑high to form on 4h and, within that structure, to sell on a lower‑high and lower‑low trigger on the lower timeframes.
When that short scenario appeared, I placed a sell stop order.
Let’s look at the live charts.
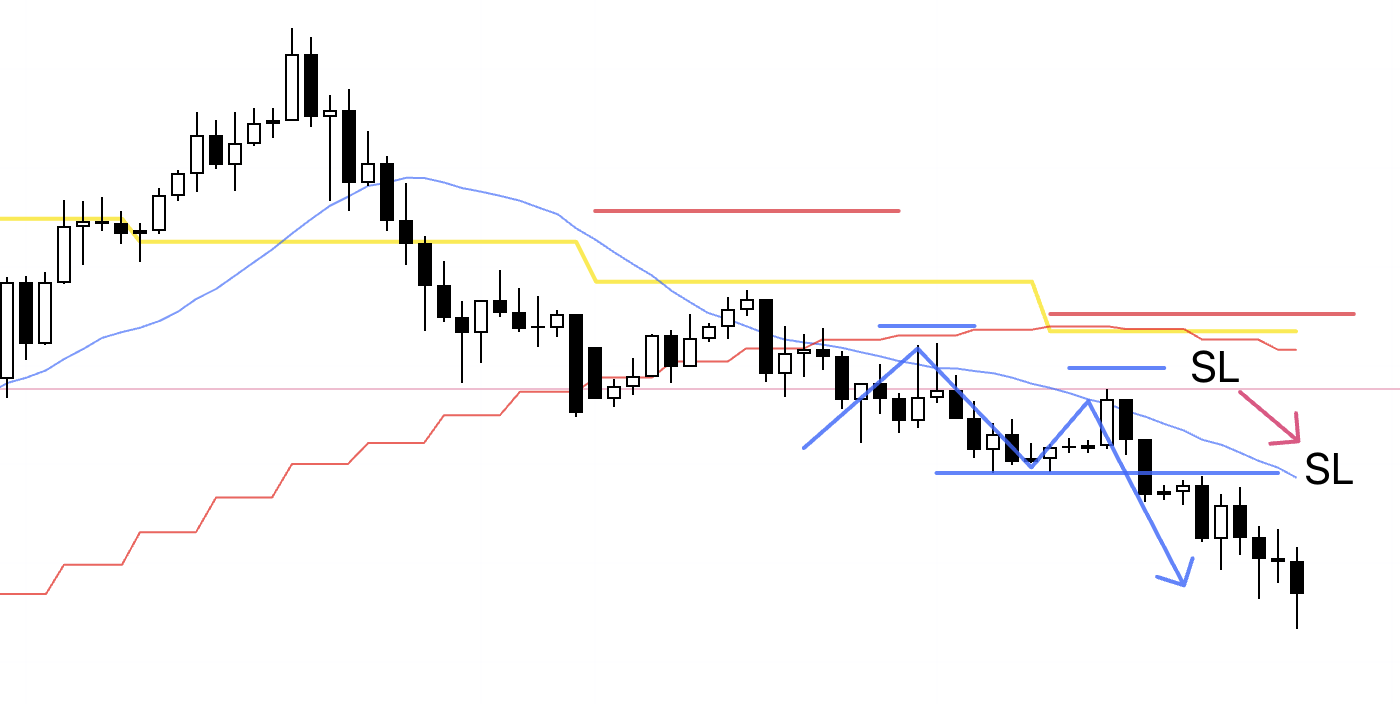
4h
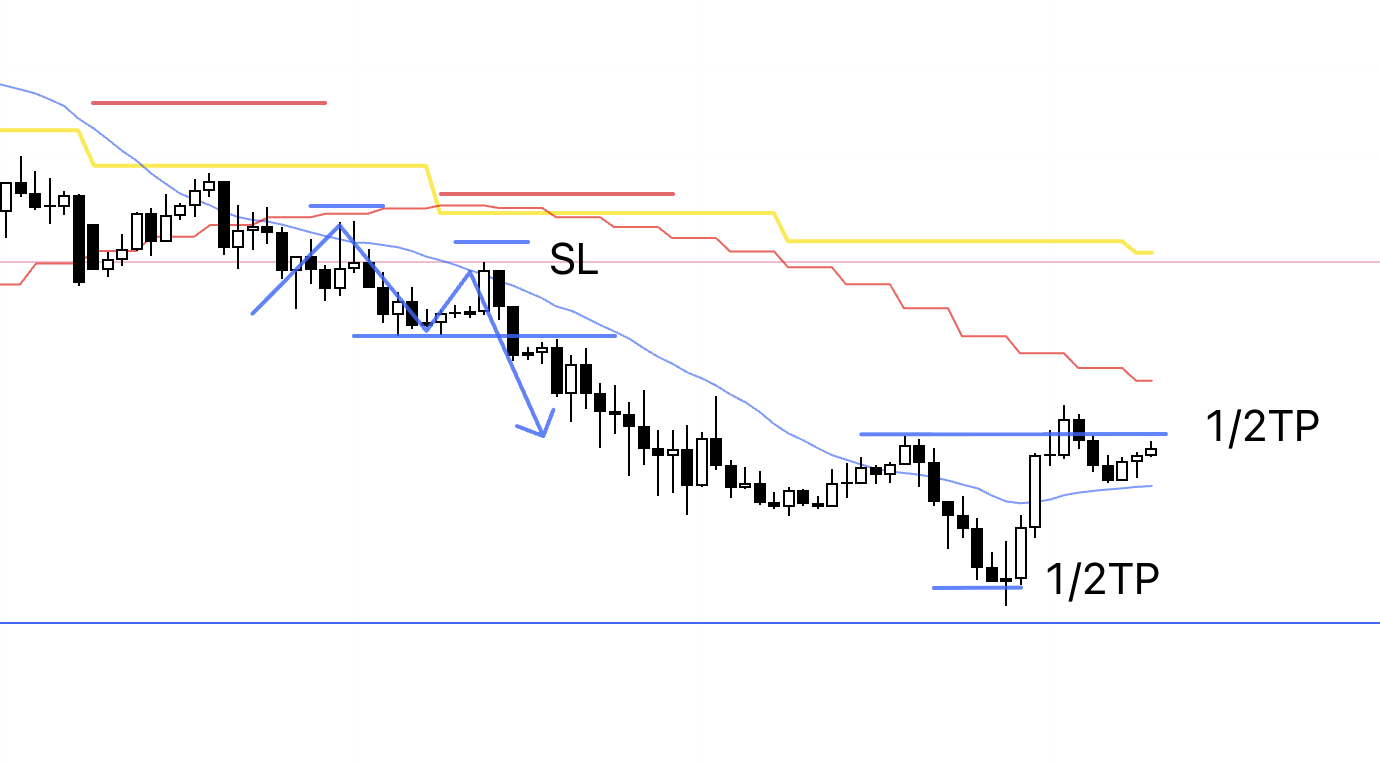
Here is the actual 4h chart.
Let’s also check the 1h.
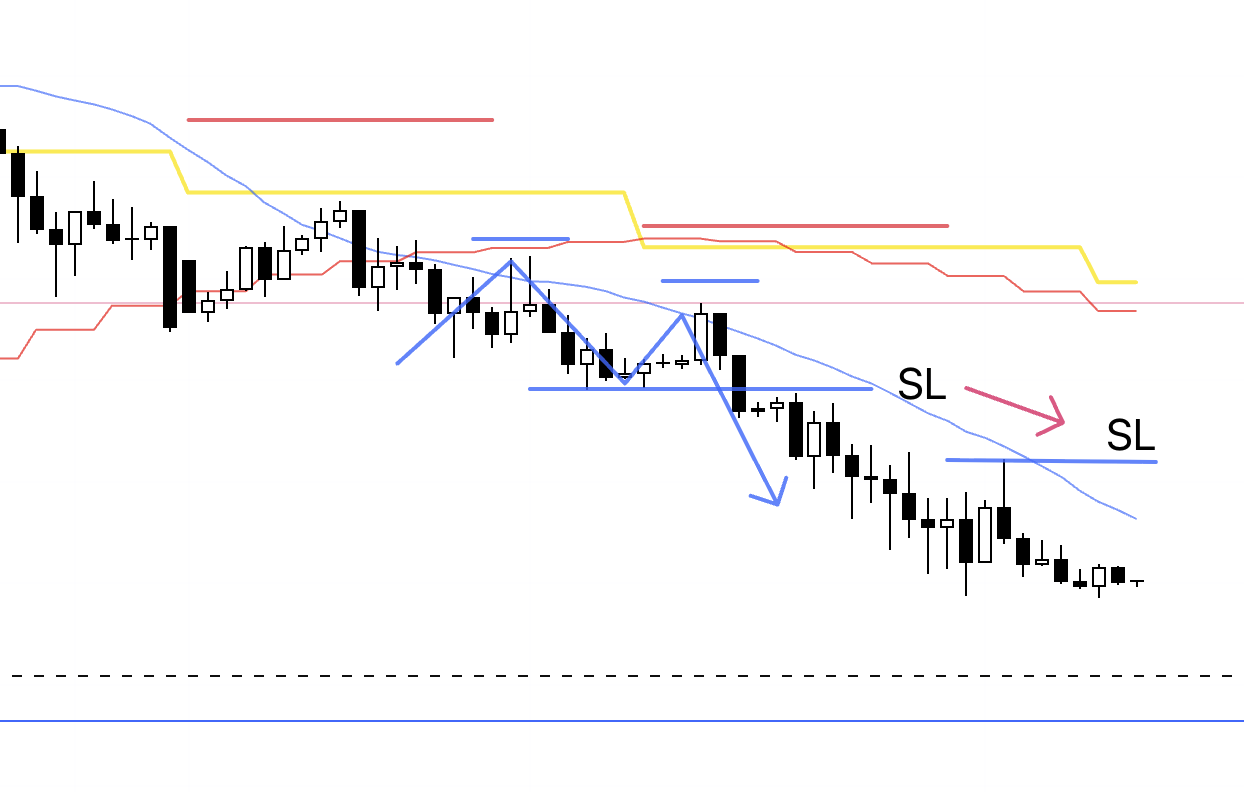
1h
The entry is on a 1h break of the prior low, which aligns with the same break on 4h.
A break here materially increases the downside edge.
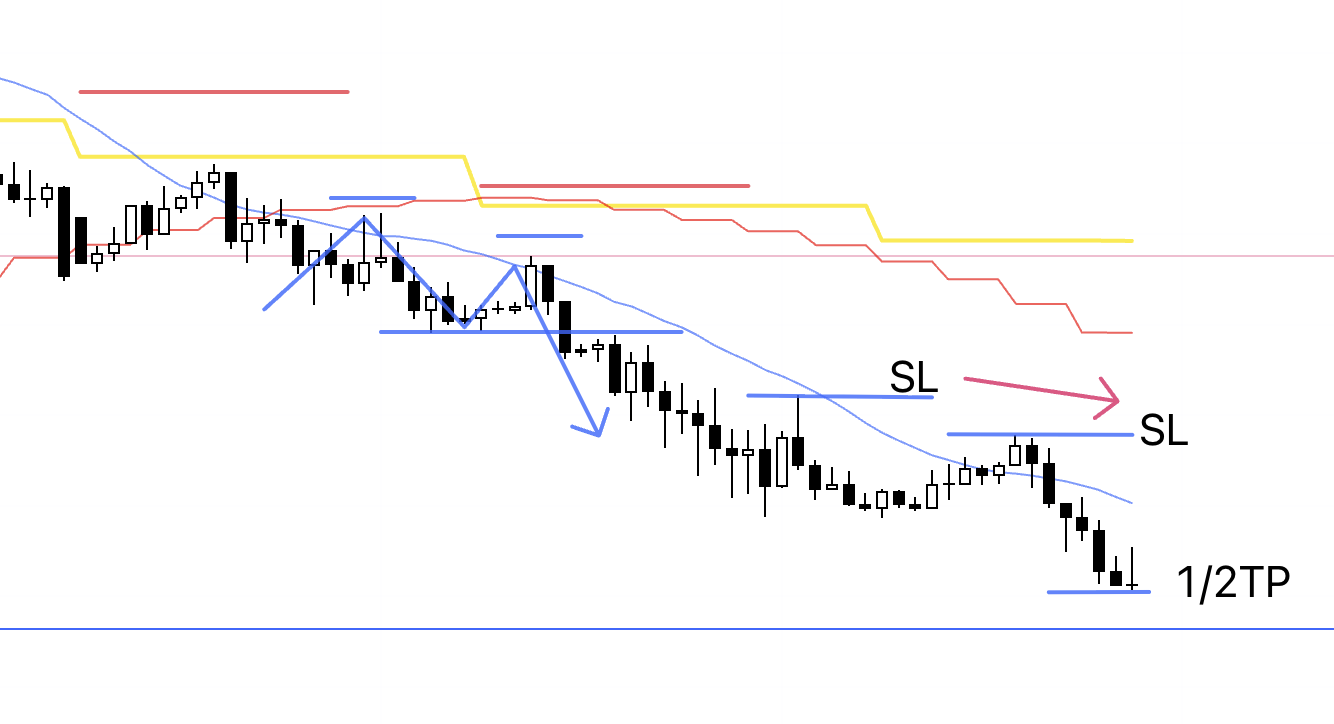
1h
The order got filled.
Because this is a 1h trade, I’ll hold until the 1h trend structure is broken, but as I mentioned in Sunday’s scenario, the blue line just below is a level likely to attract weekly pullback buying, so I plan to secure half near that zone.
1h
Moved the stop loss lower.
1h

The SL is unchanged, and I’m going to sleep.
If we reach the blue line area while I’m asleep, half the position will be taken off automatically.
1h
After waking up, I moved the SL lower.
1h

Moved the SL lower.
1h
Price approached the blue line, so I took half off.
1h
It looks like the SL may get hit, but it hasn’t yet.
I’m going to sleep.
If it gets hit overnight, that will close the trade.
1h
In the morning, the trailing stop had been hit, and the trade was closed.
〜・〜・〜・〜・〜・〜・〜・〜・〜・〜・〜・〜・〜・〜・
October 21 (Tue)
USDJPY
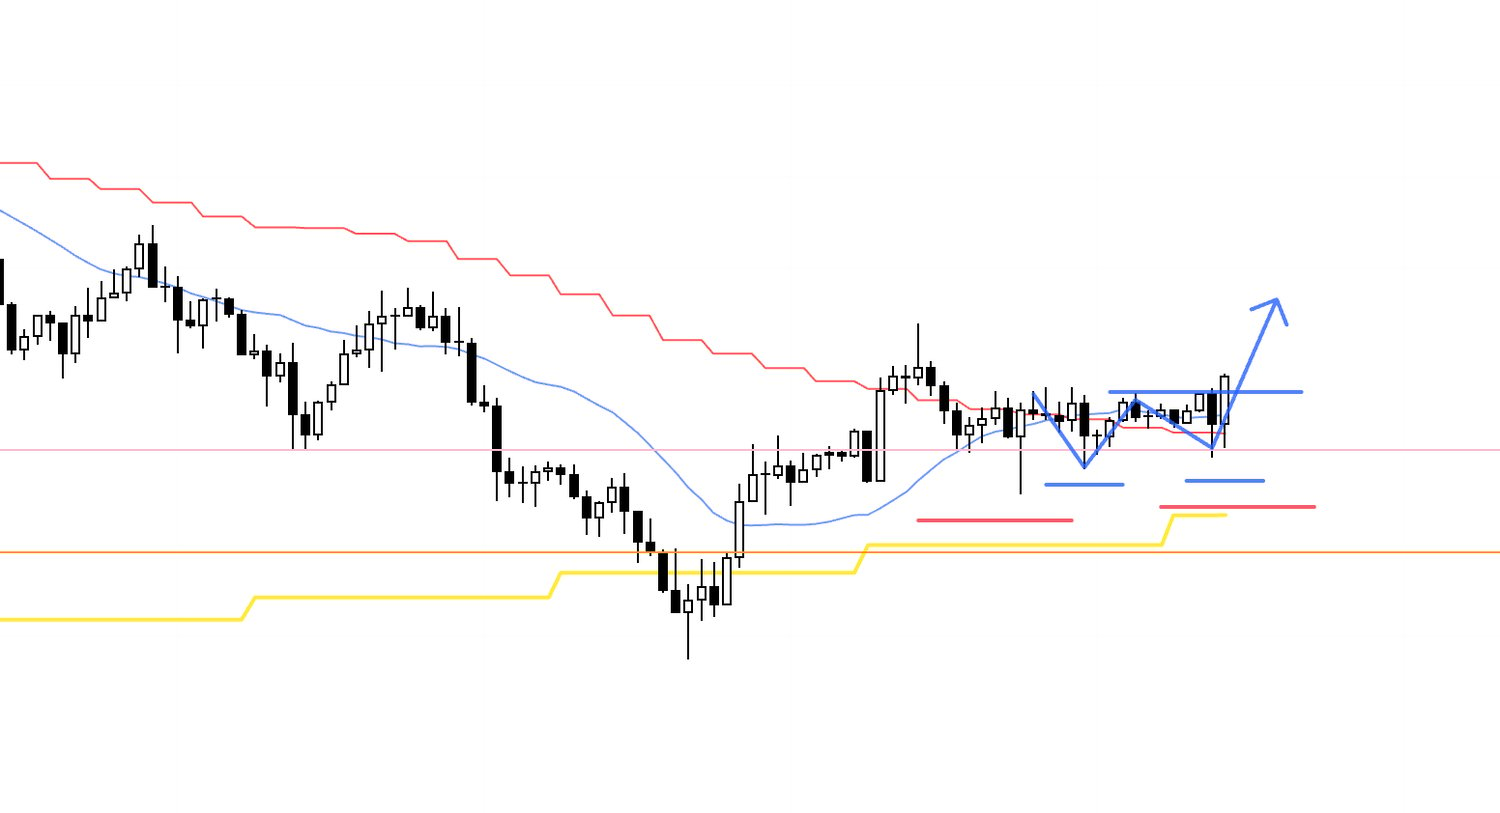
4h chart from the Sunday Scenario post
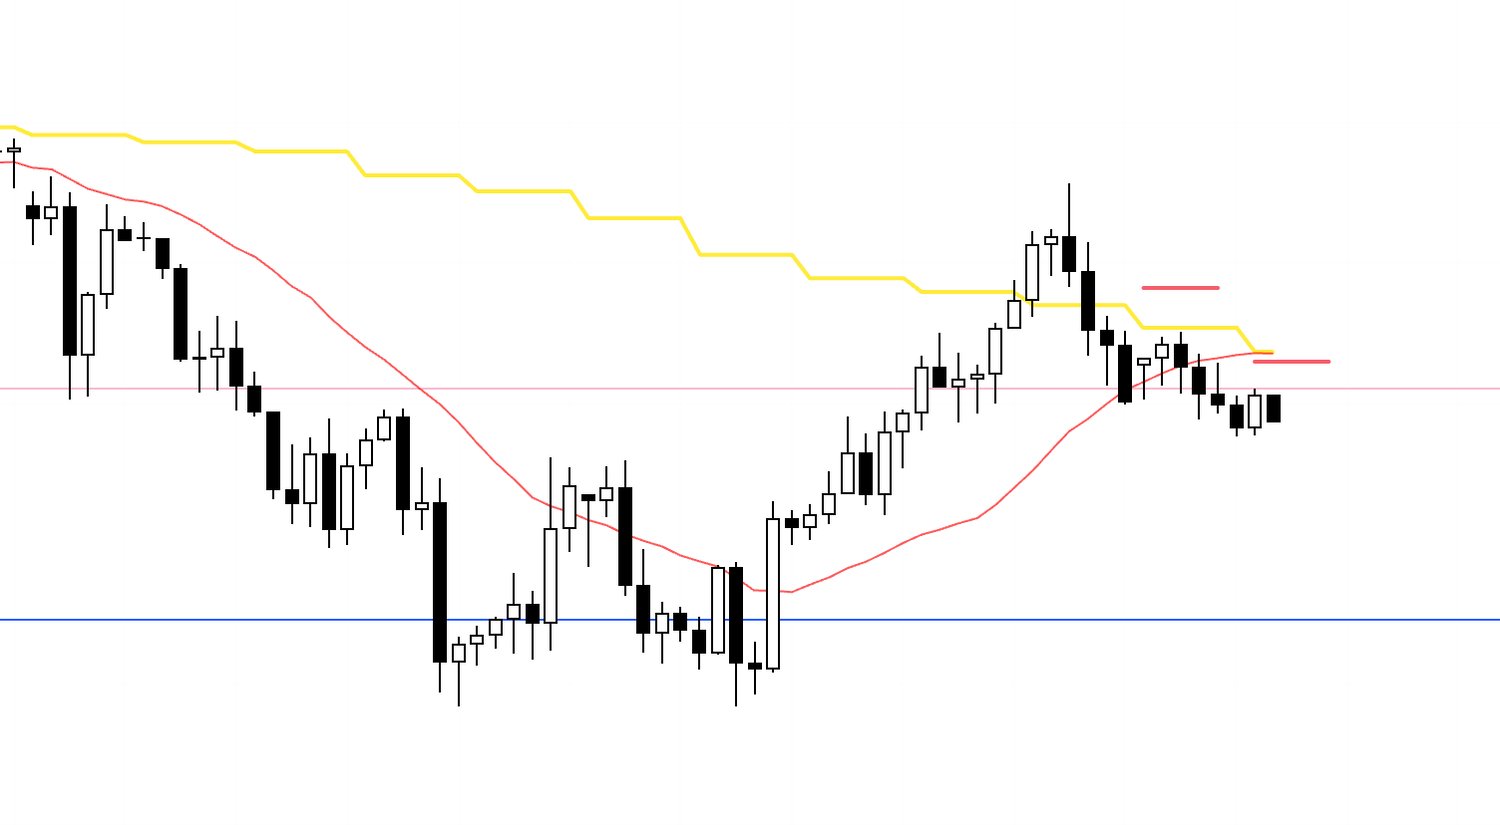
This is the chart from Sunday’s Scenario post.
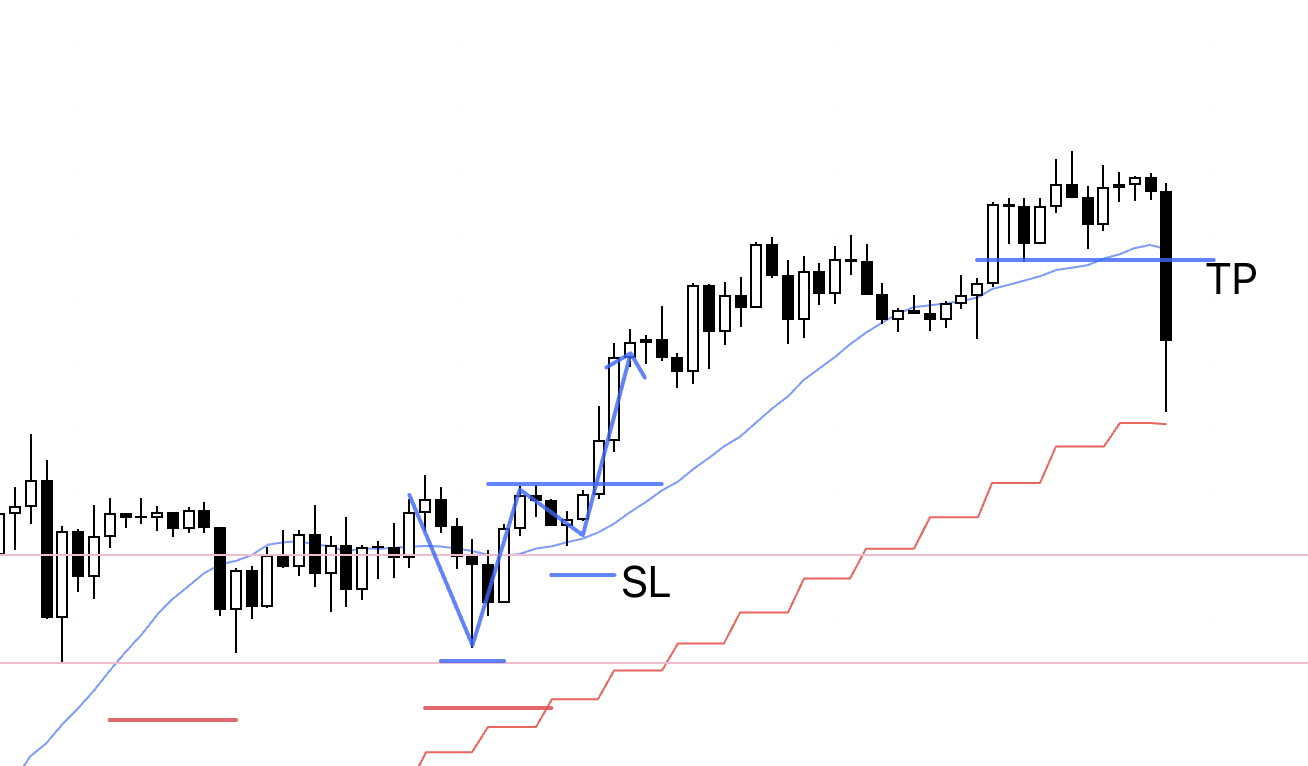
In that scenario, I mapped out a buy if the 4h printed a higher low at the pink line.
That setup materialized, so I entered.
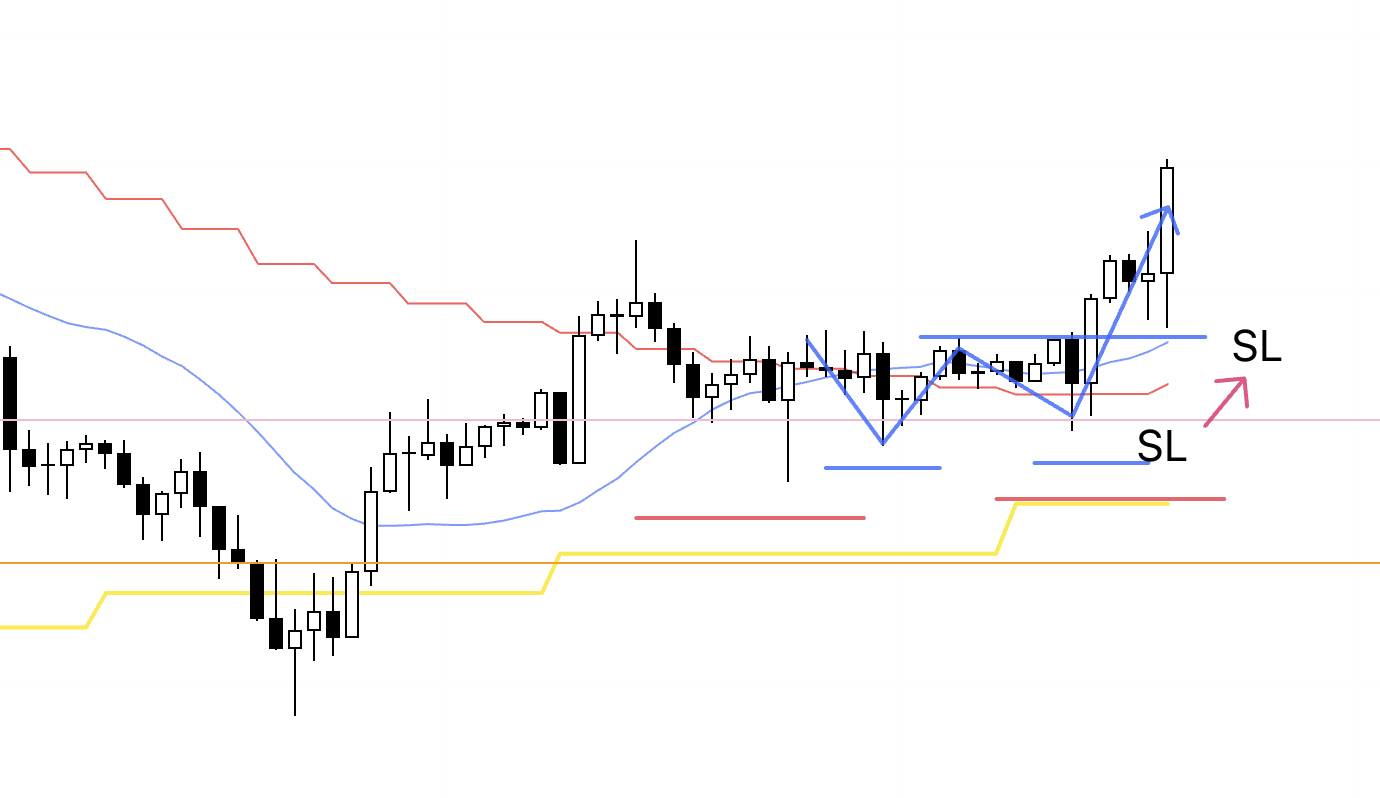
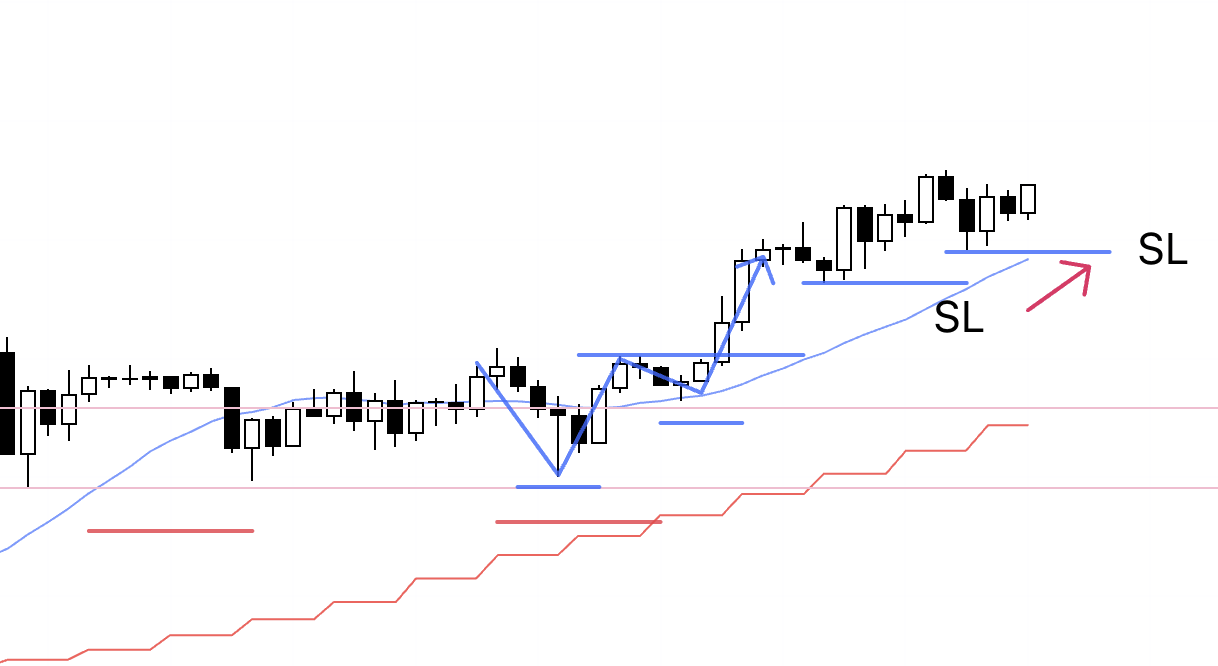
4h
Here is the actual 4h chart.
We got the 4h higher‑low I was watching for in Sunday’s scenario, so I placed a buy order.
It arrived at the same time as the EURUSD setup, and since I was setting orders and writing this post, I couldn’t capture a pre‑entry screenshot—this image is right after the entry.
1h
This is the 1h, and it’s the same playbook as always.
At a daily pullback buy location, I aim to catch the initial 4h reversal leg on the 1h, which makes this a high‑edge spot I never want to miss.
This time the 15m did not form a higher low before breaking to a higher high, so there was no 15m entry and I’m trading it on the 1h.
I plan to hold until the 1h trend breaks.
1h
Moved the SL up.
1h
Moved the SL up.
1h
The SL is unchanged, and I’m going to sleep.
1h
After waking up, I moved the SL up.
1h
Moved the SL up.
1h
Nudged the SL higher.
I’m going to sleep.
If the SL is hit overnight, that will close the trade.
1h
In the morning, the trailing stop had been hit, and the trade was closed.
〜・〜・〜・〜・〜・〜・〜・〜・〜・〜・〜・〜・〜・〜・
October 23 (Thu)
USDJPY
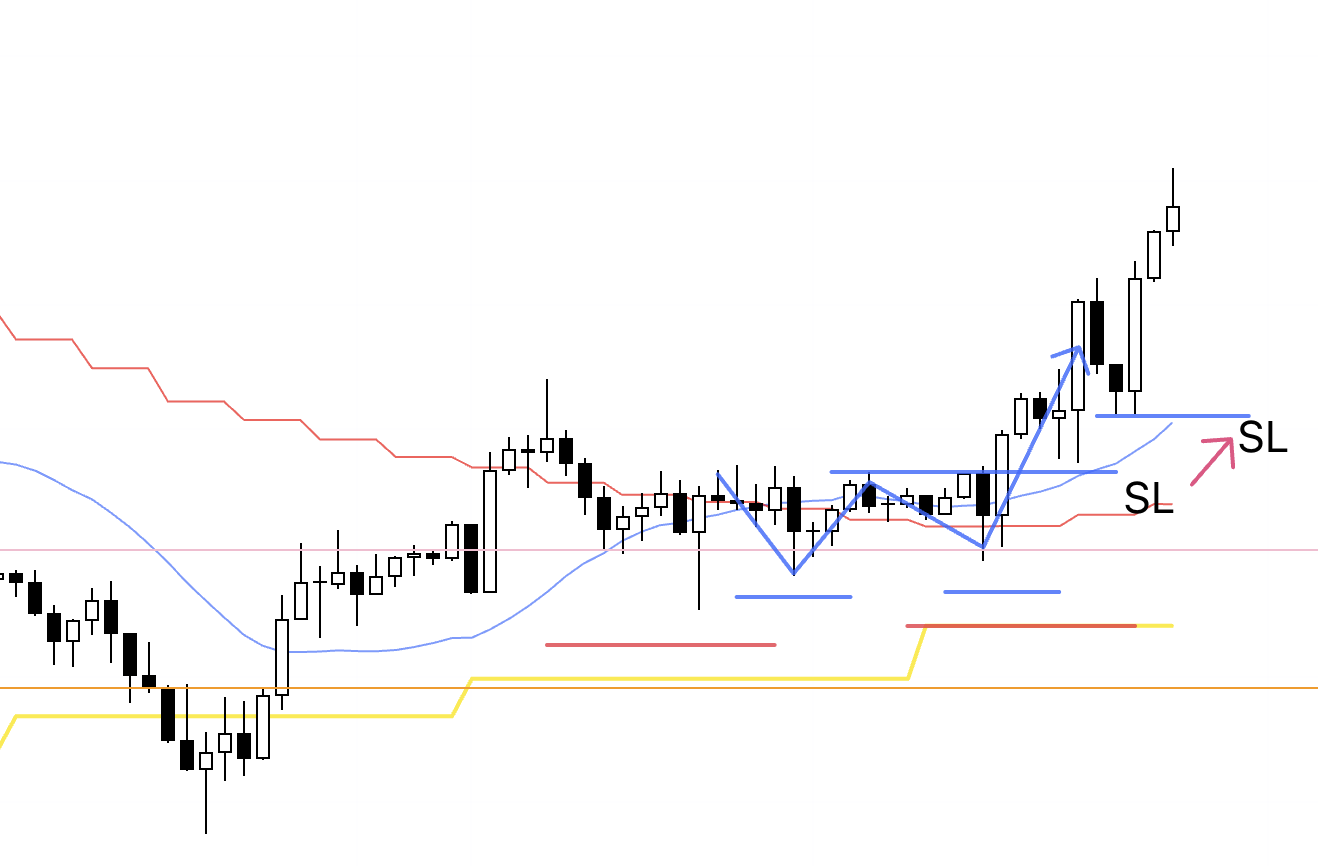
4h
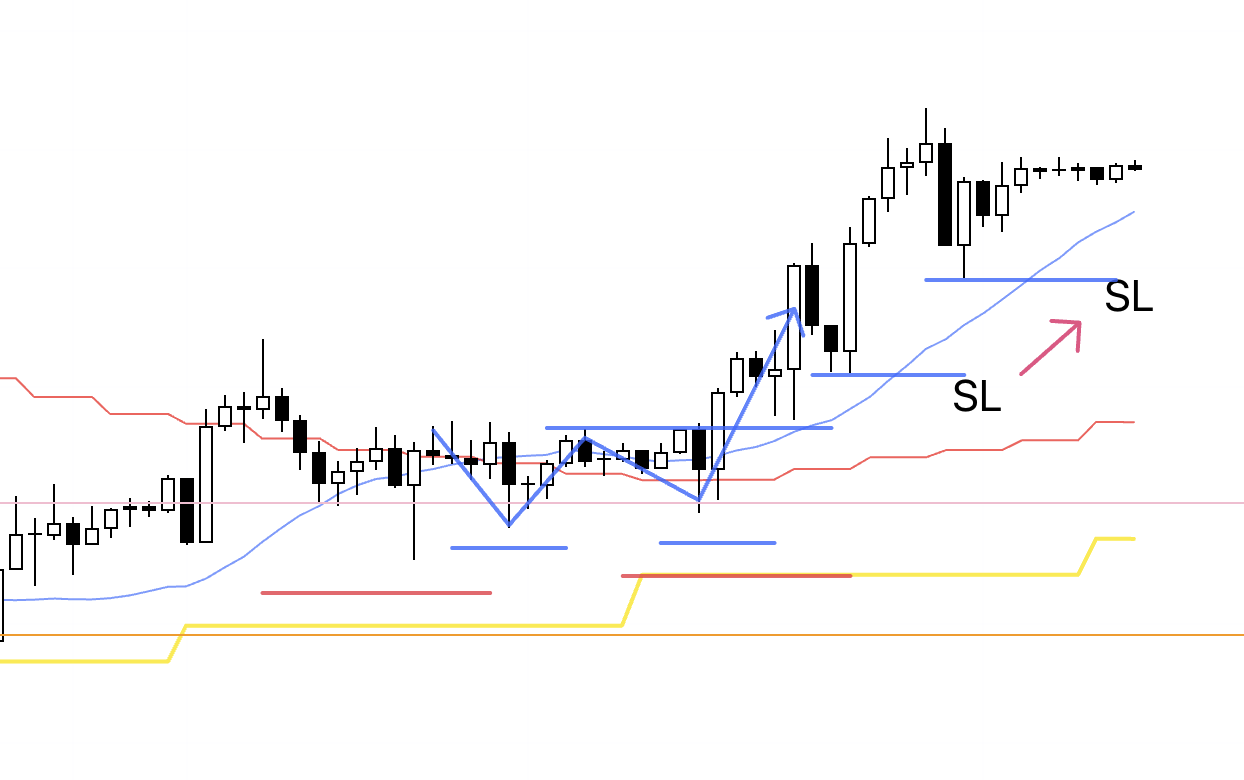
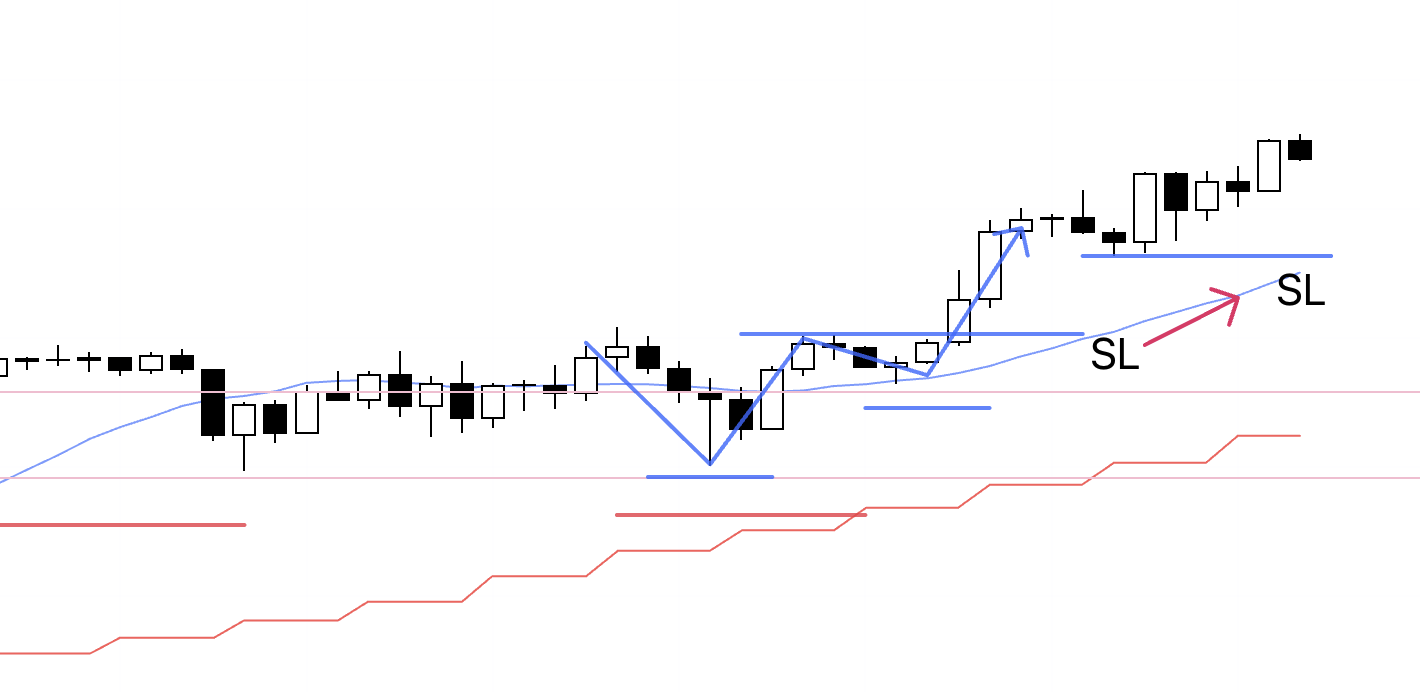
I woke up to find the trailing stop had closed the prior trade, and immediately after that the 1h printed a new higher‑low that served as the pullback buy for a fresh 4h leg, so I placed a buy stop order.
We had taken out the last lower high of the prior 4h downtrend, and this pullback to that line (pink) sets up the start of a full‑fledged 4h uptrend, which creates strong buy‑side edge.
1h
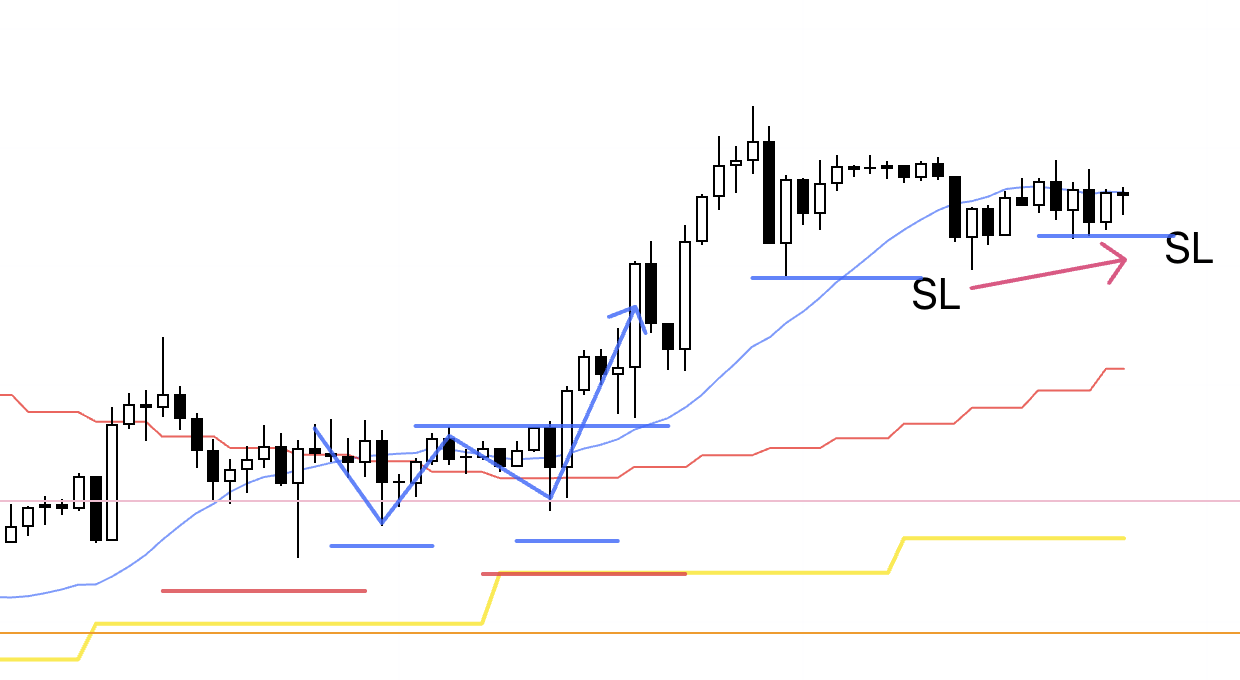
On the 1h, we briefly lost trend, which ended my previous trade, then formed a new higher‑low and attempted to start a fresh uptrend.
If 1h breaks the high, a new 1h uptrend starts, and I plan to go with it.
15m
On 15m, if we were to print another higher‑low next, I could enter earlier than the 1h high (blue).
If we rally without forming that higher‑low, I’ll enter on the 1h break of the high and treat it as a 1h trade.
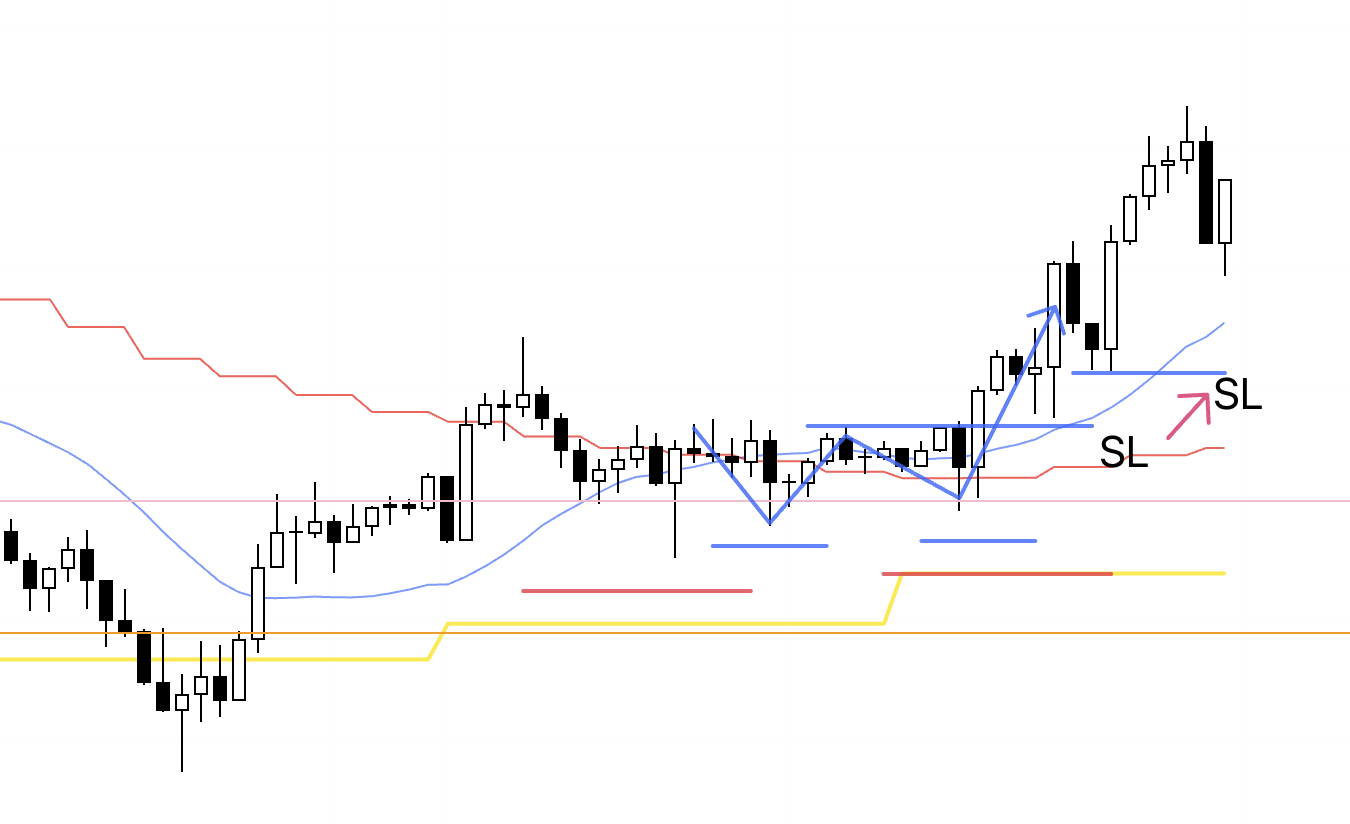
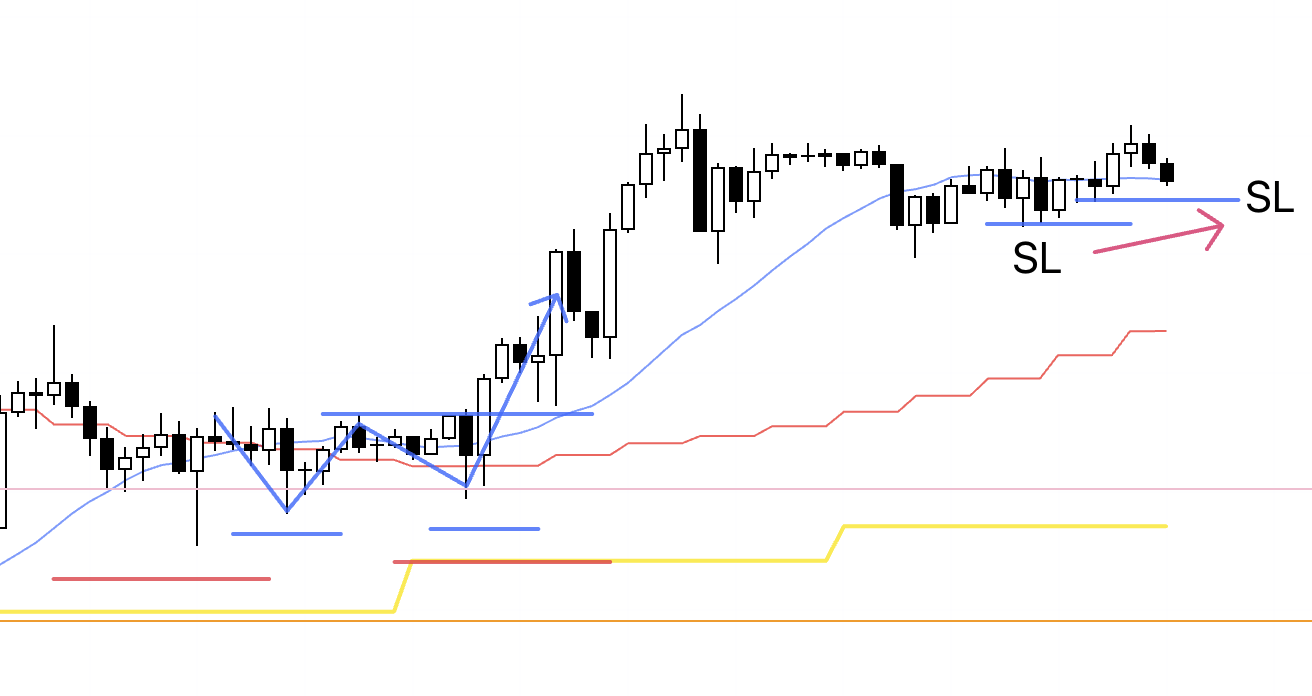
1h
The entry triggered.
In the end, 15m did not form a higher‑low and price broke the high directly, so I entered on the 1h and will hold until the 1h trend breaks.
1h

Moved the SL up.
1h
Moved the SL up.
1h
Moved the SL up.
I’m going to sleep.
1h
After waking up, I nudged the SL up slightly.
1h
Moved the SL up.
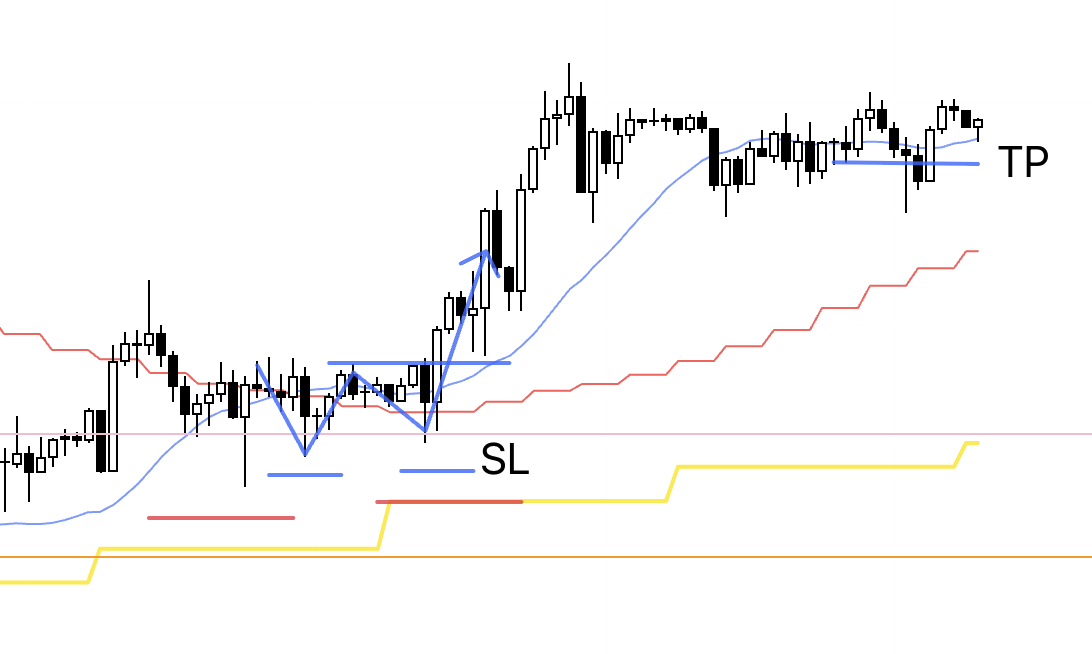
1h
The trend broke, the trailing stop I had raised was hit, and the trade was closed.
〜・〜・〜・〜・〜・〜・〜・〜・〜・〜・〜・〜・〜・〜・
Those were the trades I actually took, and now I’ll cover EURUSD point B.
See below.
EURUSD 4h
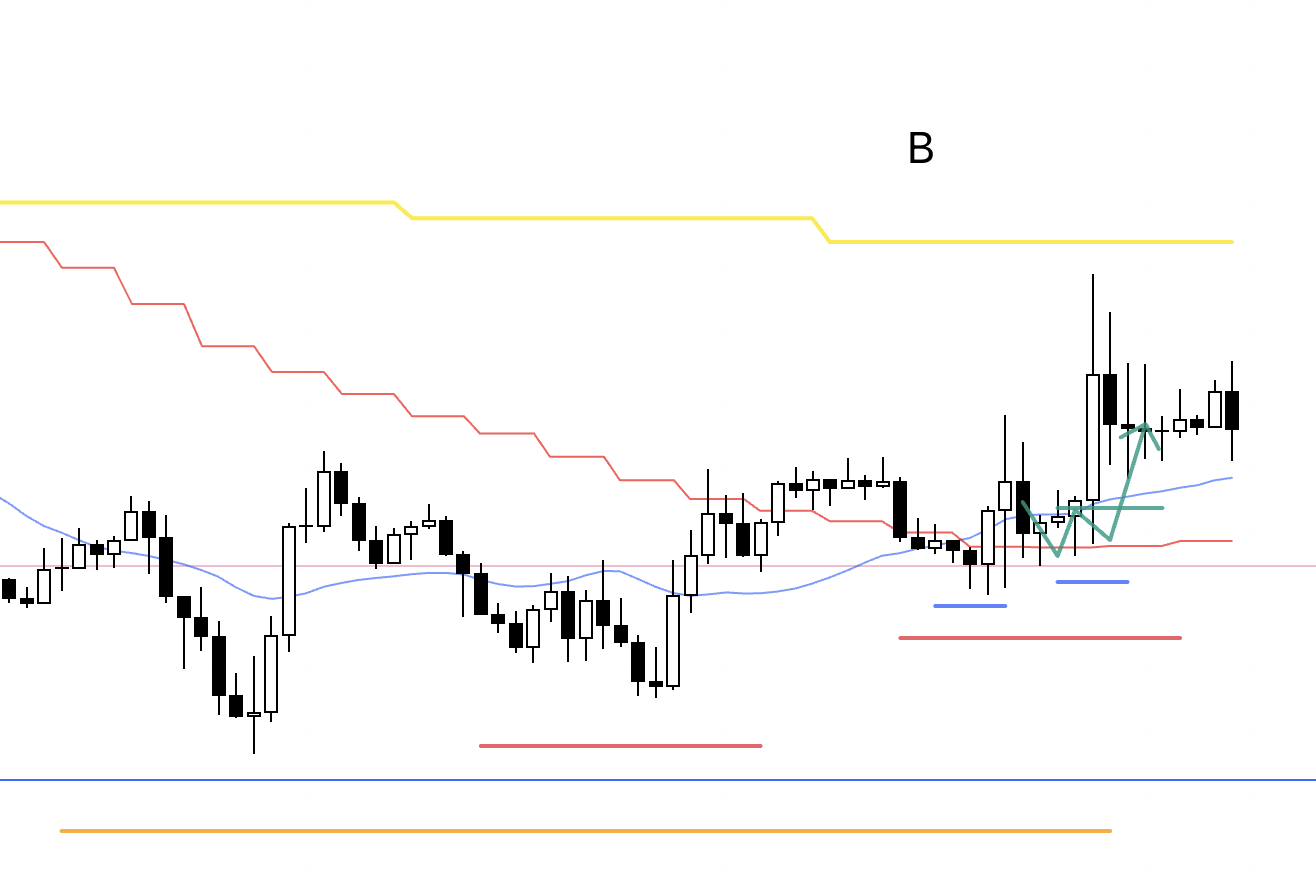
At B, I didn’t trade because it coincided with economic data releases, but this is a structure I’d want to take if it appears.
It’s a high‑edge, buy‑favorable configuration, so let me explain.
Below is the Scenario post from last week.
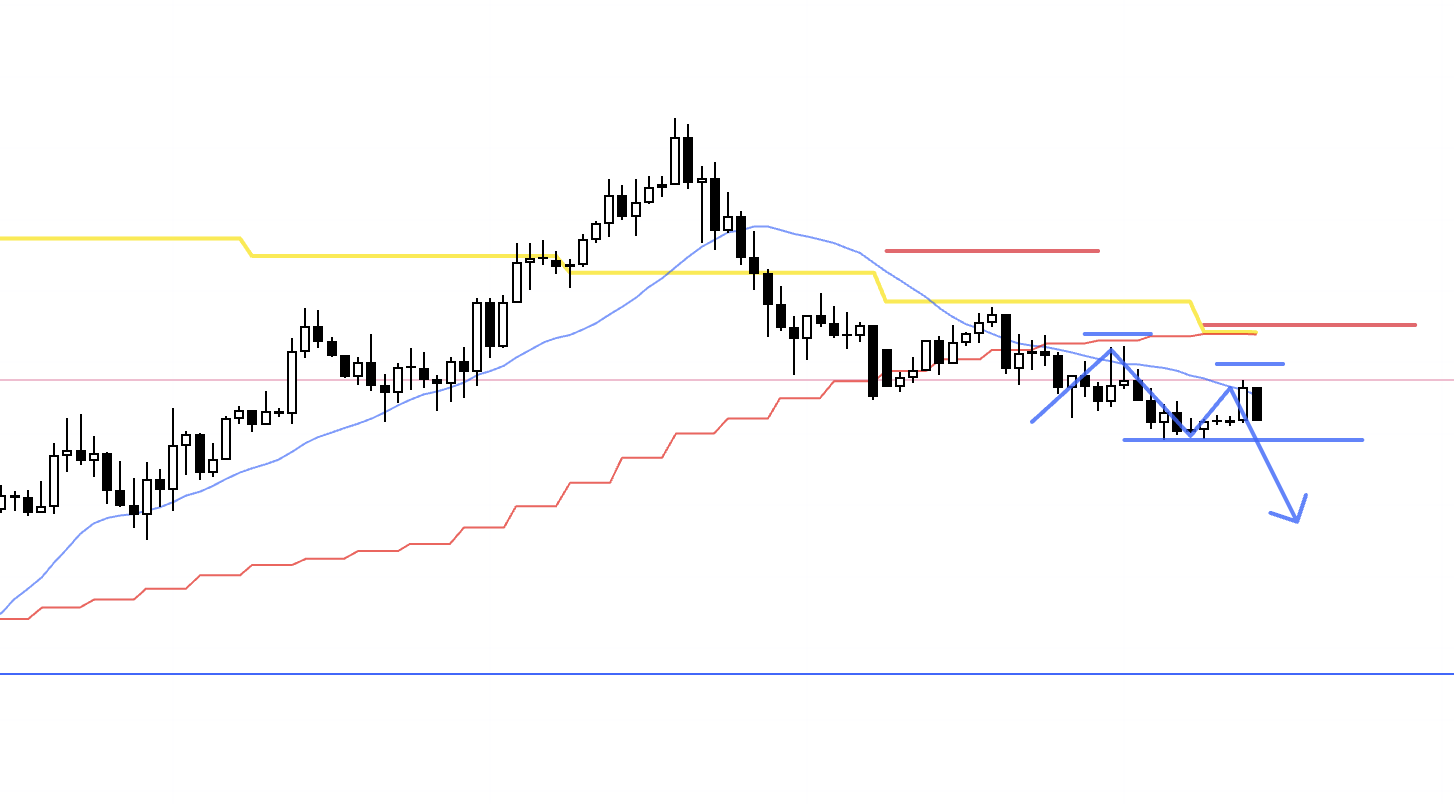
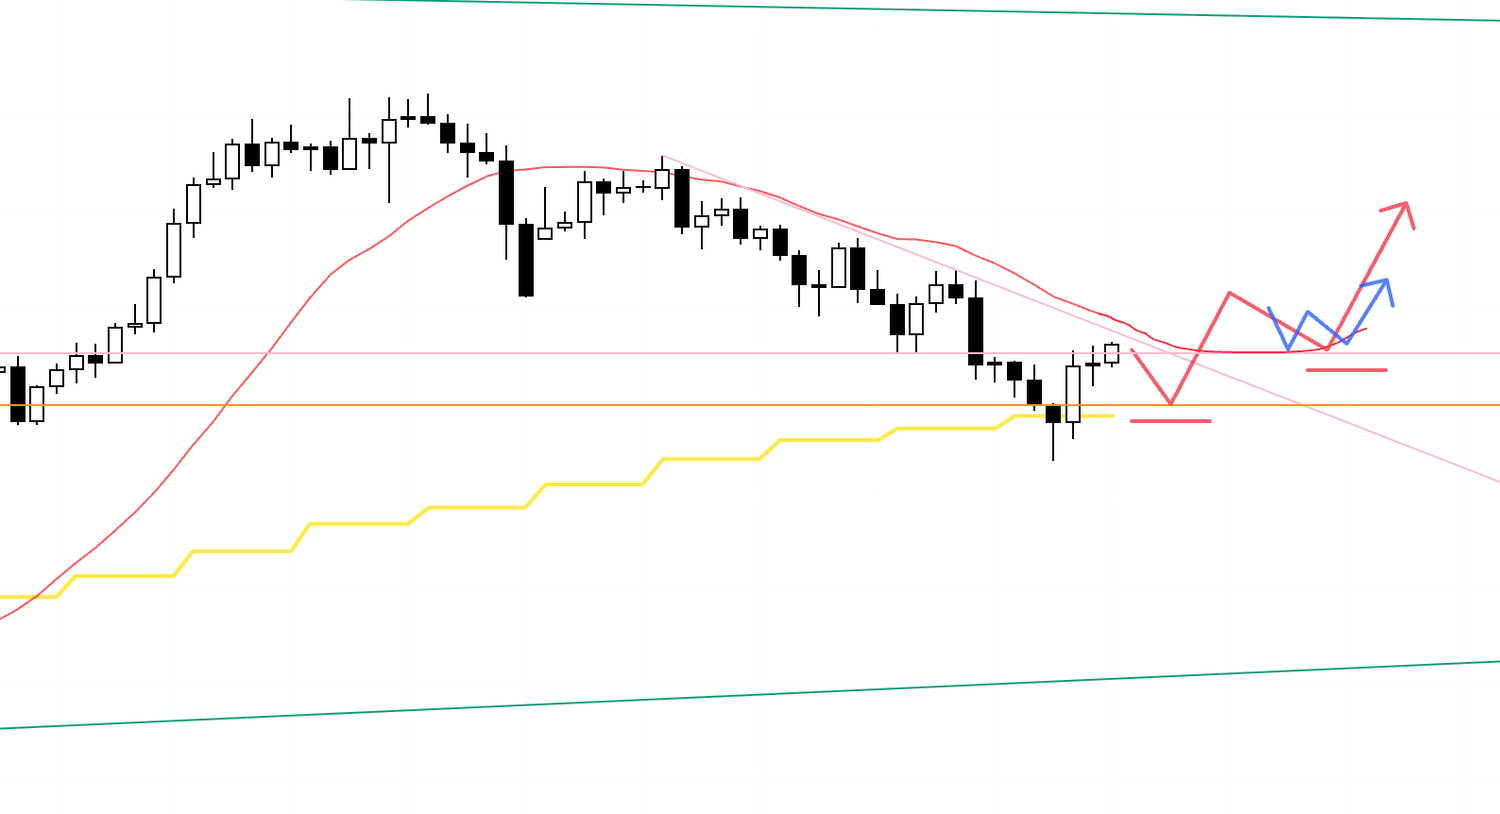
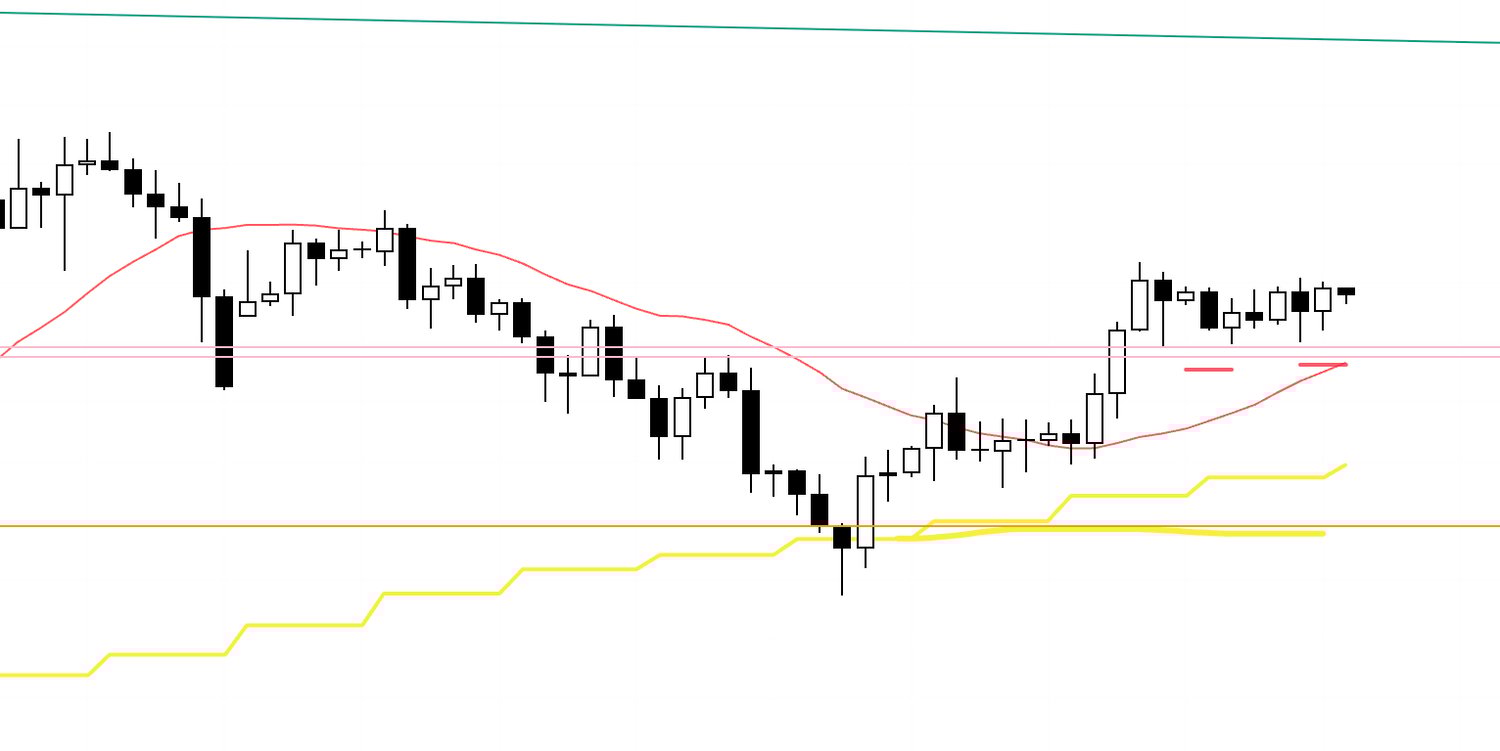
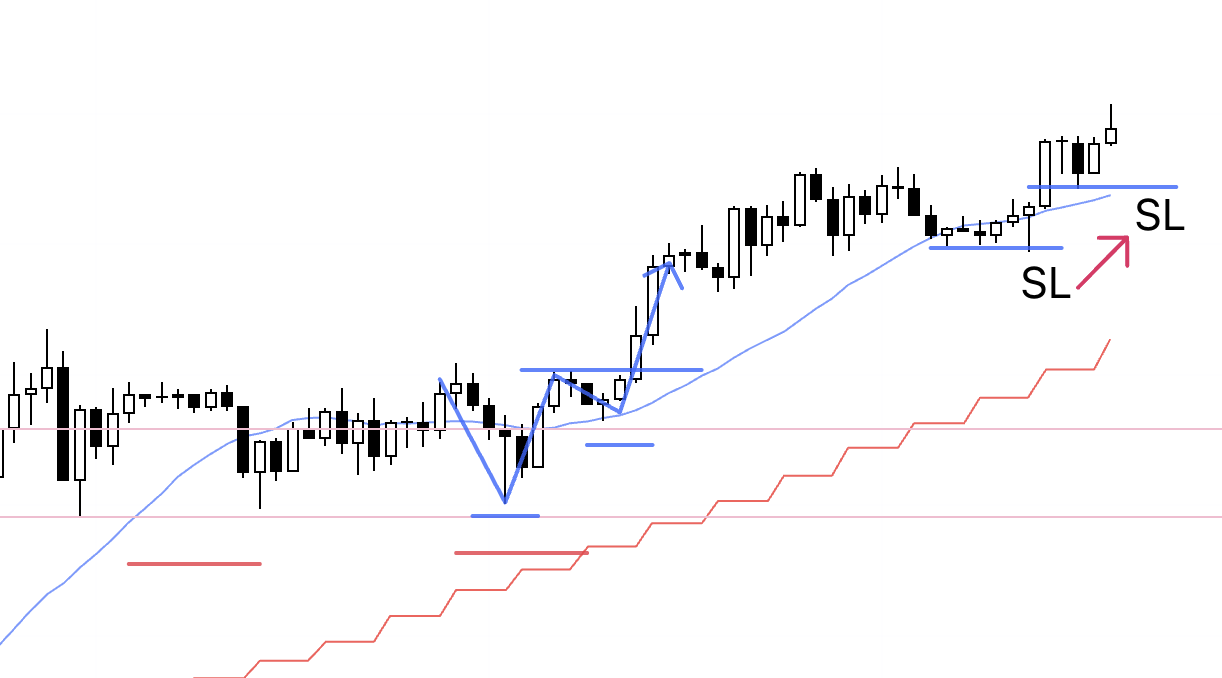
4h from Sunday’s Scenario post
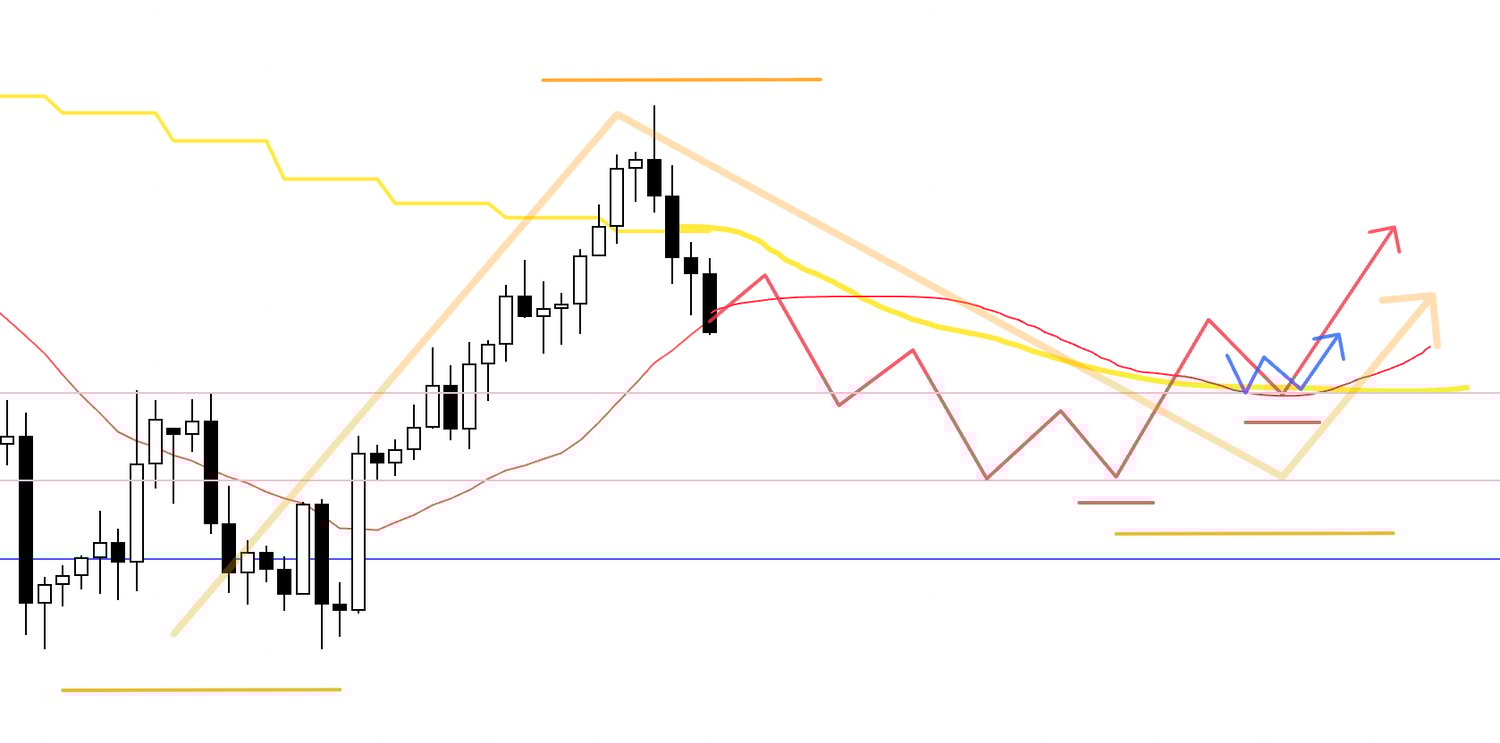
This was the buy scenario I had last Sunday, looking for the 4h downtrend to break, a series of higher‑lows supported by the 4h moving average (red), and—importantly—alignment with a daily higher‑low.
Let’s look at the live chart.
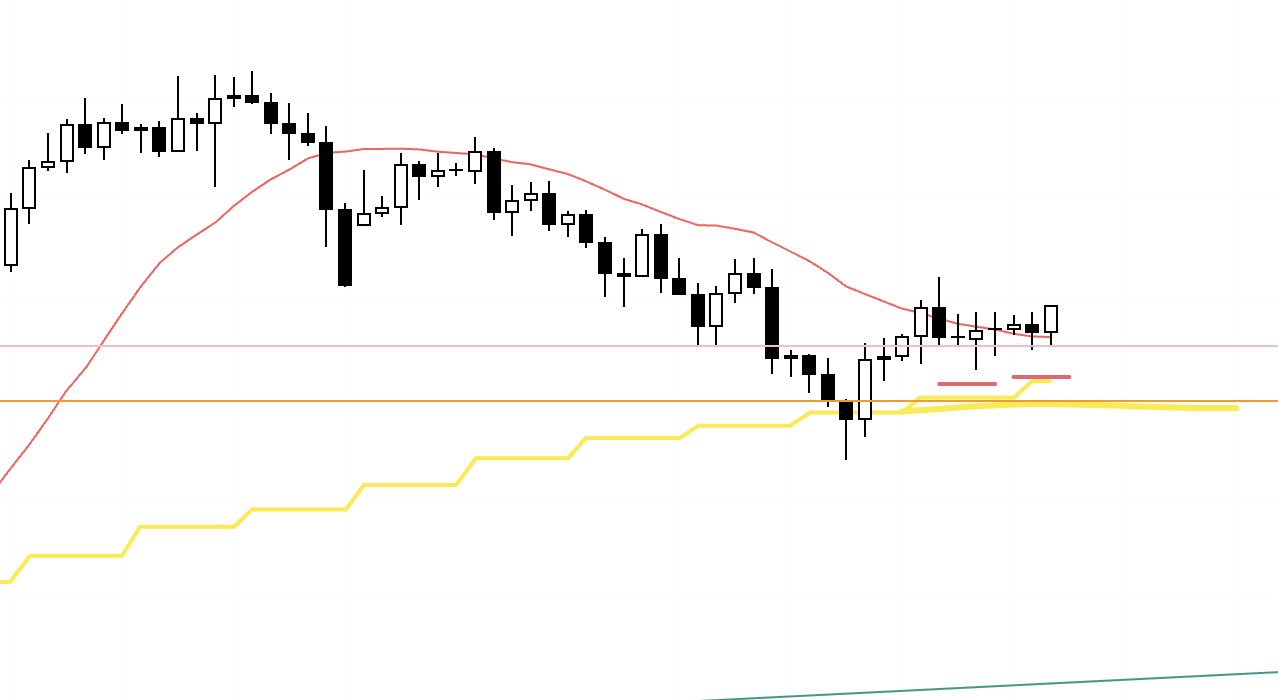
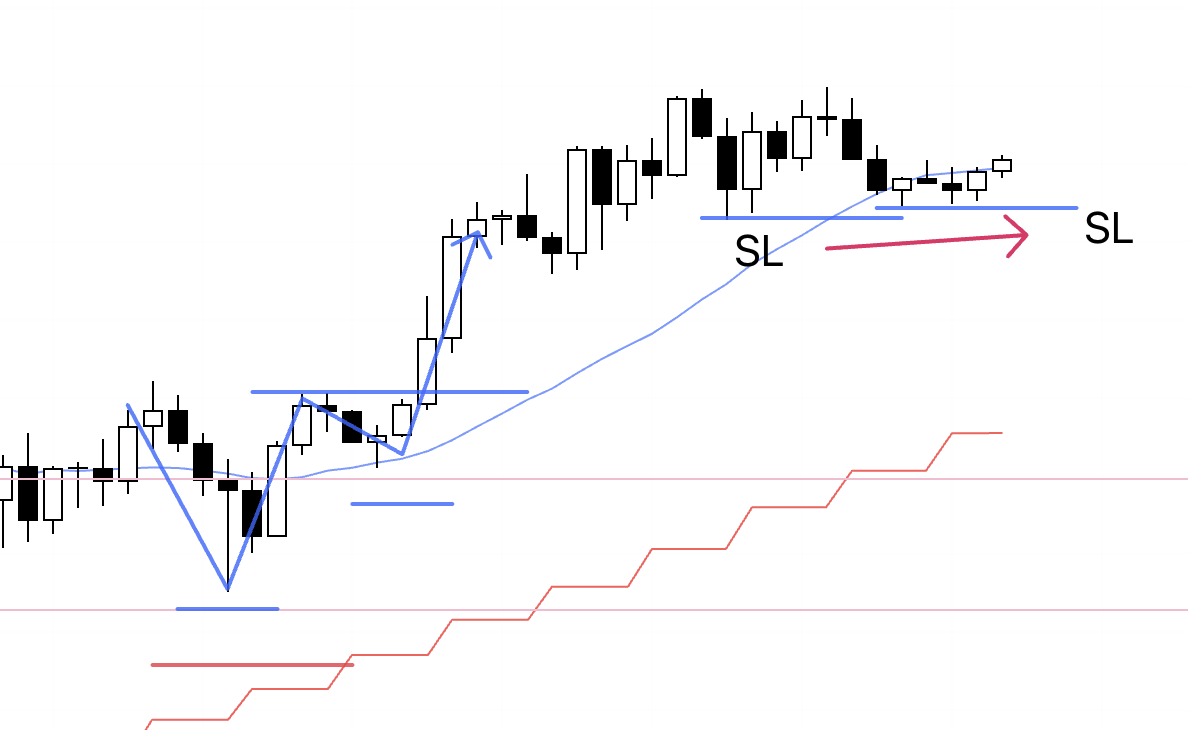
4h
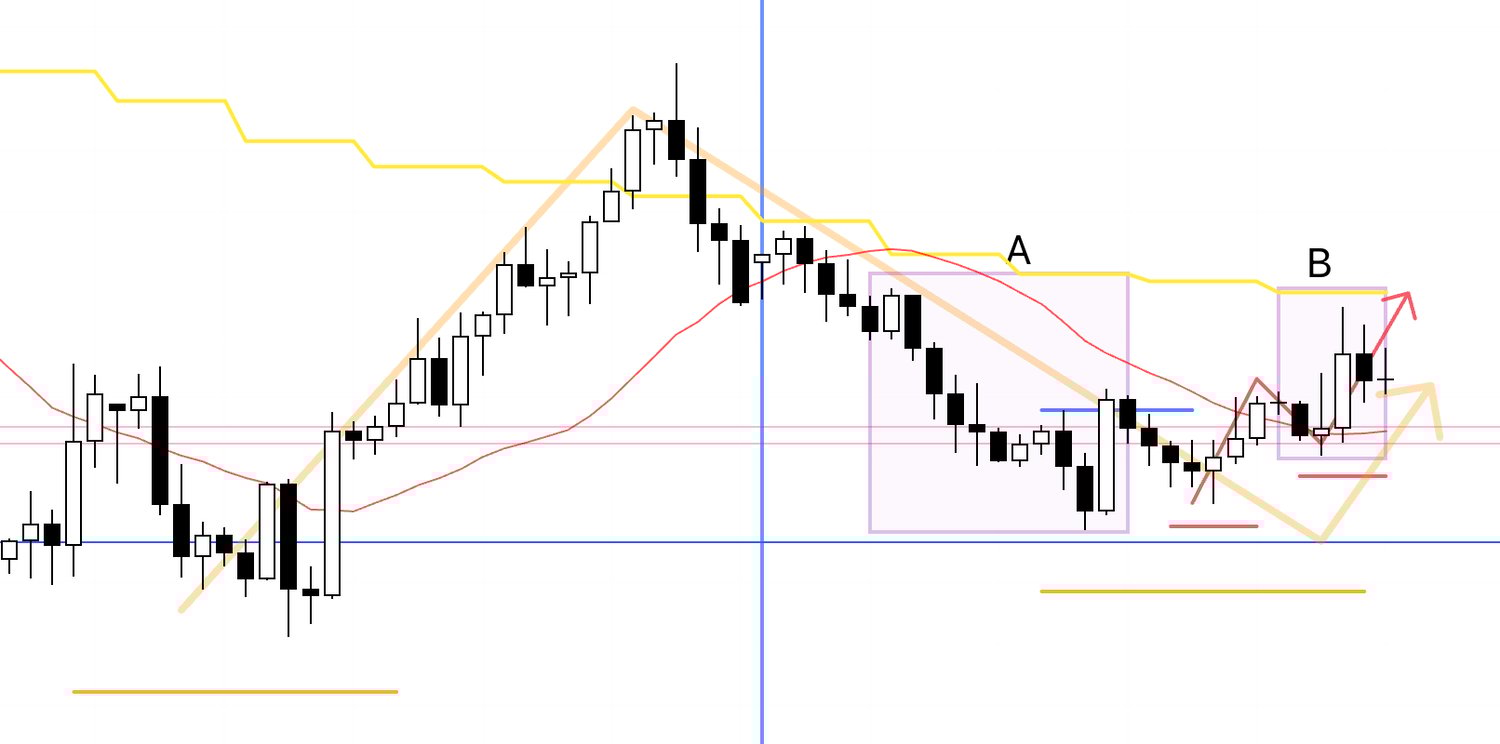
On the actual chart, price failed to break below the lower blue line and rotated into a 4h trend reversal.
That implies a double bottom on the daily and marks a daily higher‑low.
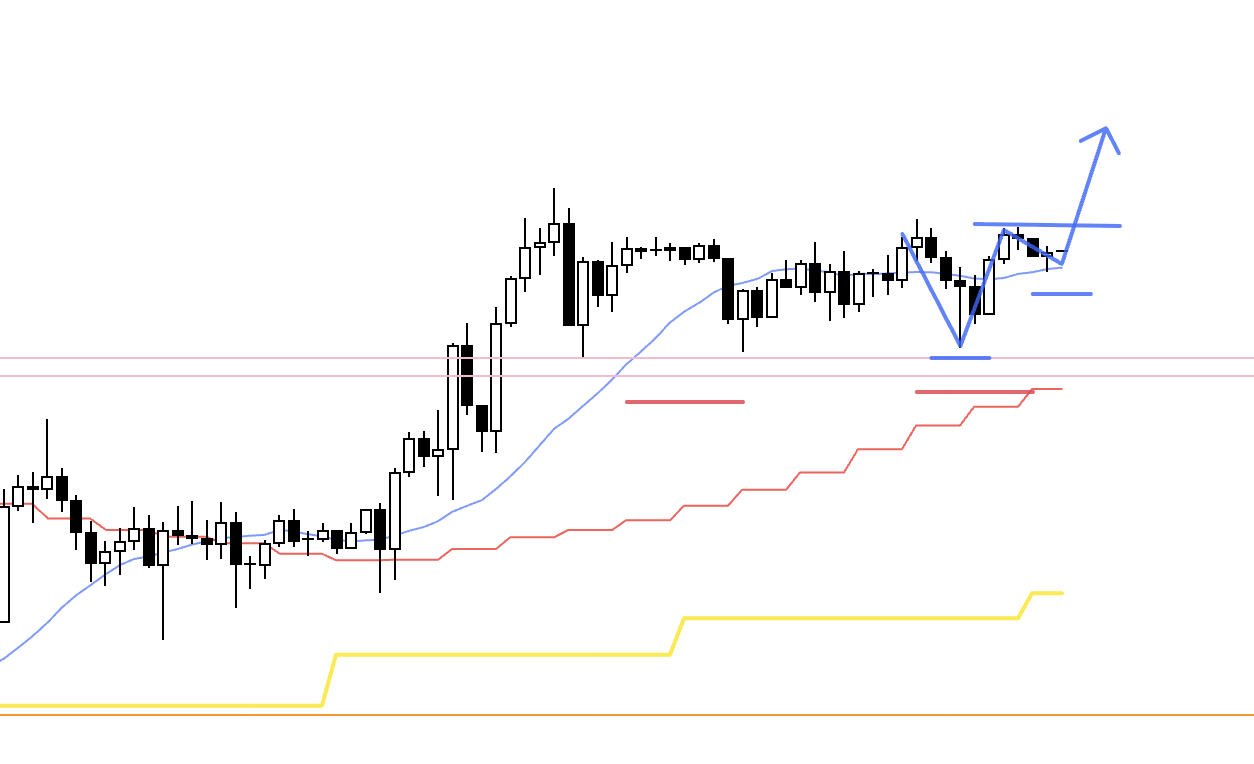
At the end of the trade labeled A, 4h had already taken out the recent high (blue), which ended the 4h downtrend.
After that, price formed a higher‑low, but at that moment the 4h moving average (red) was still pressing from above, so I couldn’t take the trade.
Subsequently, another higher‑low formed and the moving average began to support from below, which defines the B low.
In the Scenario post I sketched a path where the daily moving average would also support from below, but in reality the daily MA did not fall that far and sat overhead.
Even so, there was room for price to close the gap up to the daily MA, so taking the trade was feasible.
(I explain this daily‑MA relationship in more detail in my blog post on moving averages—feel free to read it if you’re interested.)
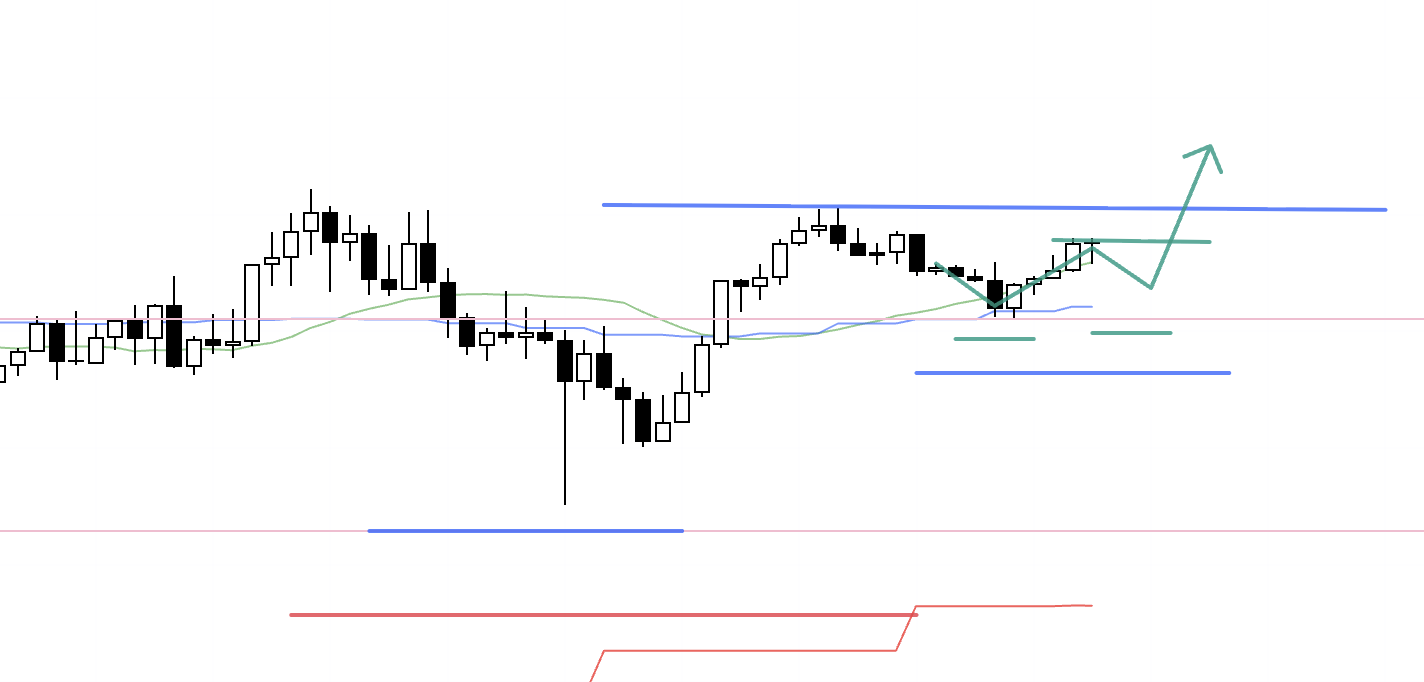
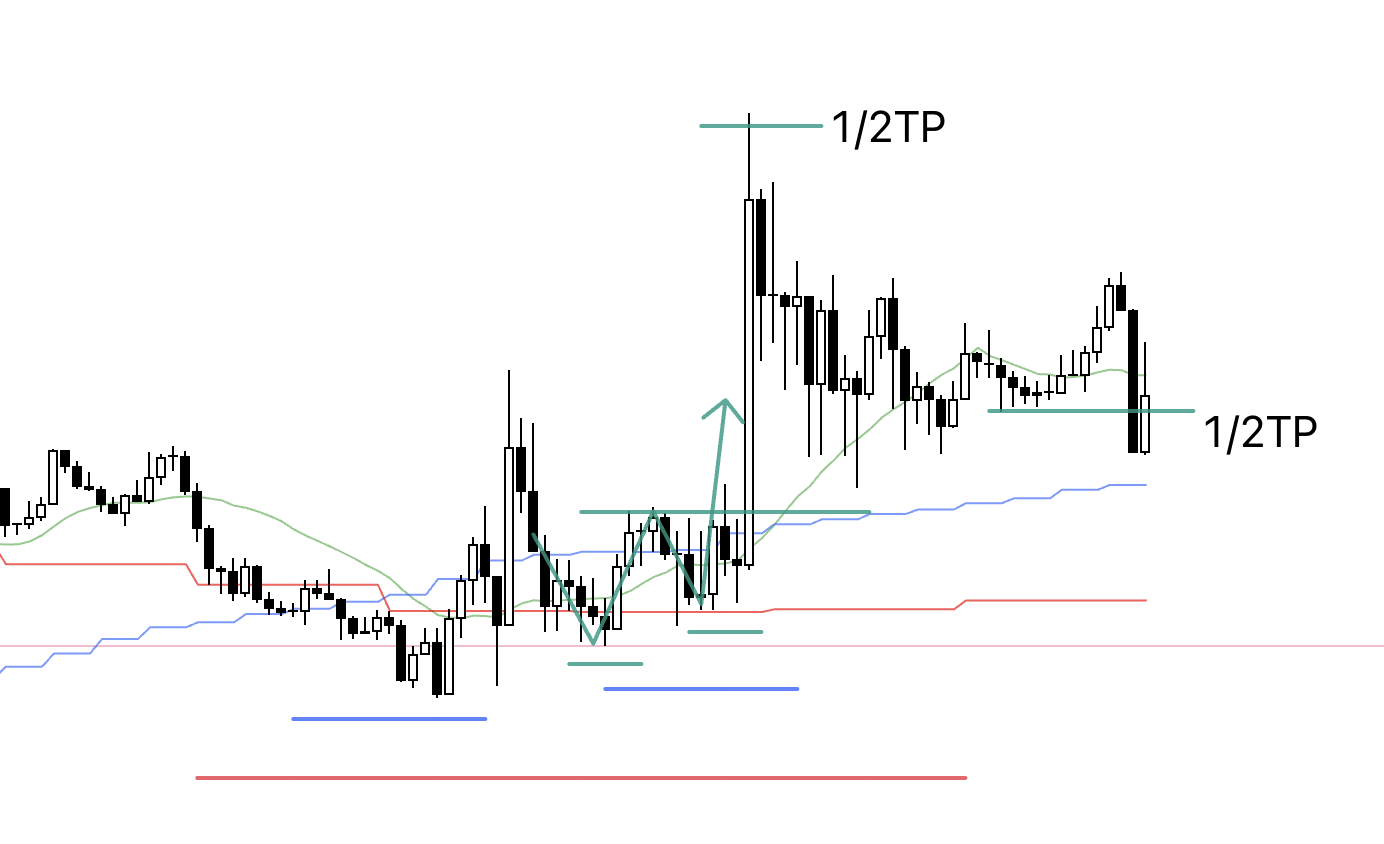
1h
On the 1h, within the daily higher‑low, the 4h printed a higher‑low and the 1h did as well.
However, entering on a break of the 1h high did not offer acceptable risk‑reward versus the distance to the daily MA (yellow), so if I were to trade it, the entry would be on the 15m higher‑low and higher‑high (green) forming inside the 1h higher‑low.
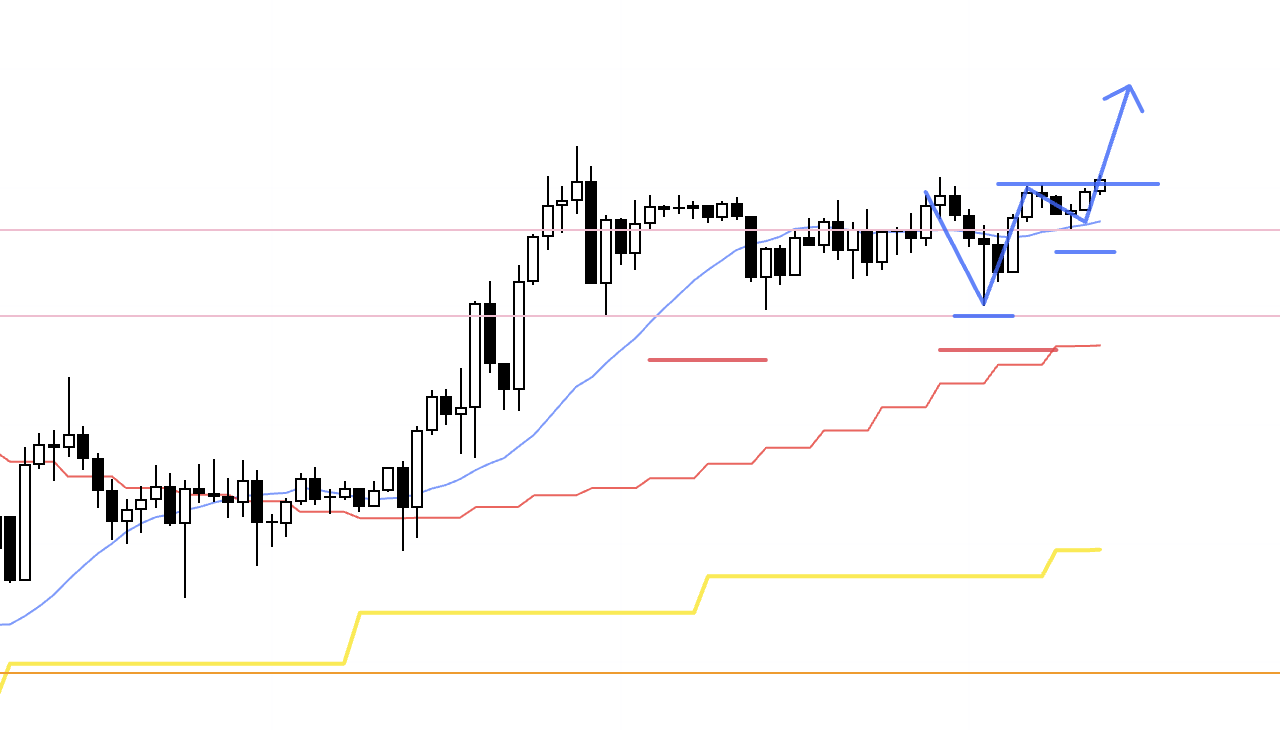
15m
Here is the 15m chart.
Within the 1h higher‑low (blue), the 15m also printed a higher‑low and higher‑high (green), so an entry there improves the risk‑reward and makes the trade viable.
One note of caution.
This upswing is the rally that builds the daily lower‑high, meaning it runs counter to the daily downtrend, so I would plan to secure half near the daily MA (yellow).
It’s critical to map the market direction across timeframes, understand ahead of time where the risks lie, and execute accordingly.
As price prints successive higher‑lows, I raise the stop loss, and the trade ends when trend structure finally breaks and the trailing stop is hit.
While I didn’t take this one, I make the same decisions in a repeatable way every time, so I hope this is helpful.
〜・〜・〜・〜・〜・〜・〜・〜・〜・〜・〜・〜・〜・〜・
That’s all.
To avoid any misunderstanding, the single most important message of this blog is process consistency.
I write this to offer a practical model of how to map scenarios in advance and keep executing them over time, not to brag about winning trades, which I have no interest in.
That is precisely why the Sunday Scenario post plays such a central role.
This week’s trades were simply the faithful execution of what I had set in the scenarios, not after‑the‑fact claims that “this is where one should have traded.”
Where the edge emerges, where the risks are, and what should trigger a trade can all be known from the chart in advance, and when that happens, I just do what I said I would do.
Don’t confuse “if that happens, I’ll do X” with “that will happen.”
I don’t predict the future, and “do nothing if it doesn’t happen” is part of the scenario set.
I strictly wait for spots where both win rate and risk‑reward skew in my favor, and I trade only there.
Even if that means fewer trades, it’s the better path to growing capital.
What to do is simple.
Master the basics—Dow Theory and multi‑timeframe analysis.
Practice repeatedly.
Build the consistent process of scenario‑setting and execution.
Repeat.
That is all I’ve done.
No complex indicators are necessary.
By tracking swing highs and lows across timeframes, you can infer what traders on each timeframe are seeing and waiting for, and where stop clusters are likely to sit, which helps you locate points where orders concentrate.
Markets move on supply and demand, so those concentration points naturally become areas where price moves more readily.
What I do is simple, but simple is not the same as easy.
It takes real work to refine the basics until you can truly use them, and only then does it become “easy” to repeat them.
I hope this blog gives useful hints to those who are building a strategy or struggling to achieve consistency.