


I will review key trading takeaways with a focus on the trades I executed this week.
This “Weekly Trade Report” is posted every Saturday.
If you read it together with “Trade Scenarios,” which I post every Sunday, you can see how I frame ideas in advance and how I actually trade those scenarios in practice.
This is not advice on “how you should trade,” nor am I claiming this is the correct answer.
Nor is it intended to showcase individual wins and losses, or to recommend specific strategies based on those outcomes.
Its purpose is to demonstrate, at a practitioner level, how I repeatedly apply a consistent process built on pre-defined scenarios—“process consistency”—so you can use it as a reference for building your own strategy and maintaining your own process consistency.
The results are solely my own and do not guarantee your future profits.
With that firmly in mind, please conduct thorough testing and preparation for your own trading, and act solely at your own risk.
I trade pullback buys and sell-the-rally setups on the 4h chart.
For my pullback-buy and sell-the-rally framework, please see my prior blog posts on Dow Theory and multi-timeframe analysis.
Now, please see the charts below.
USDJPY 4h
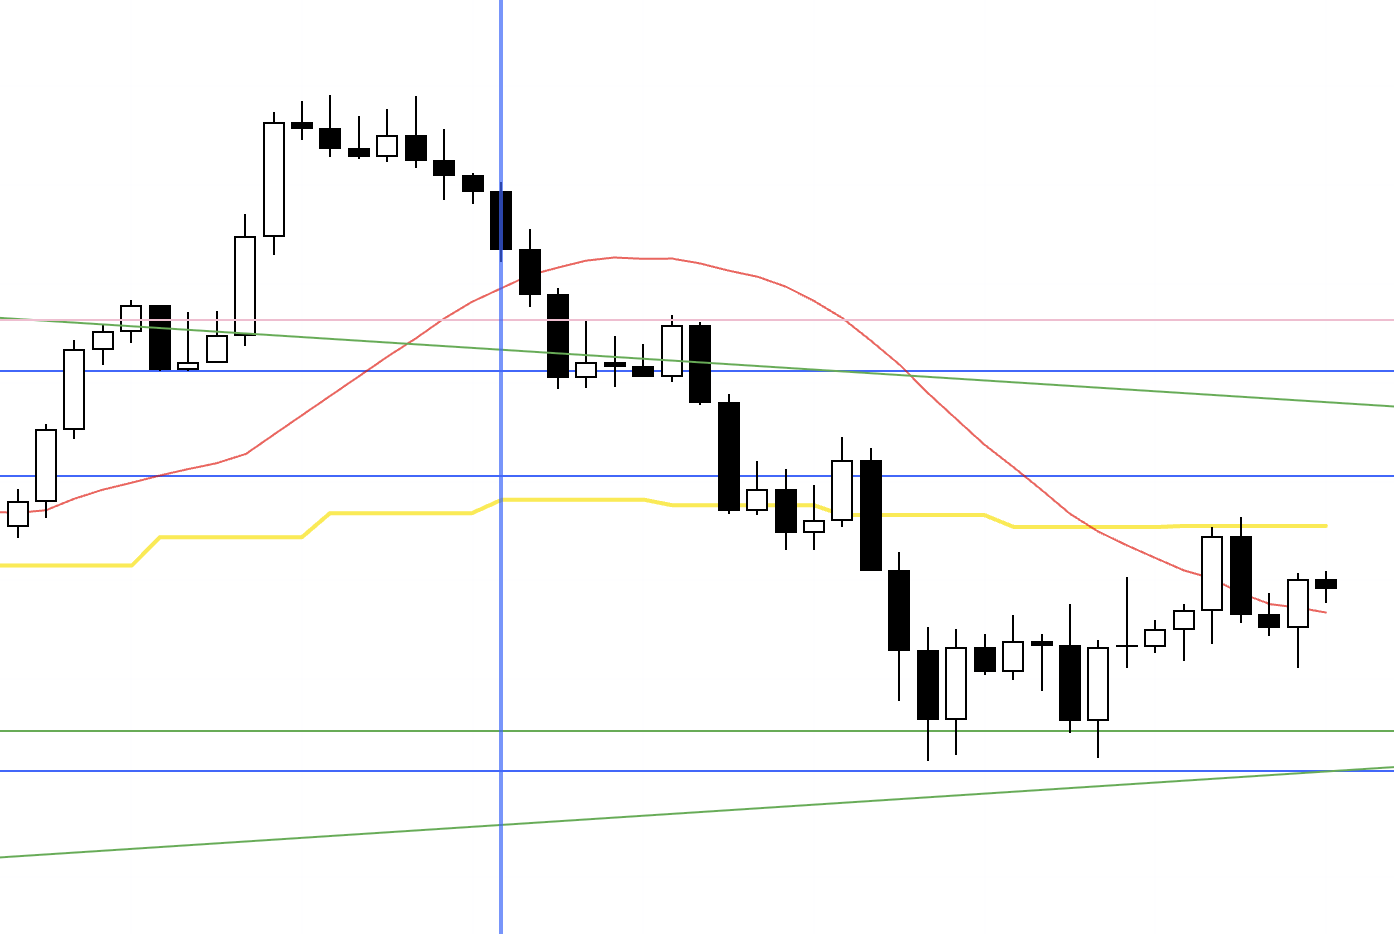
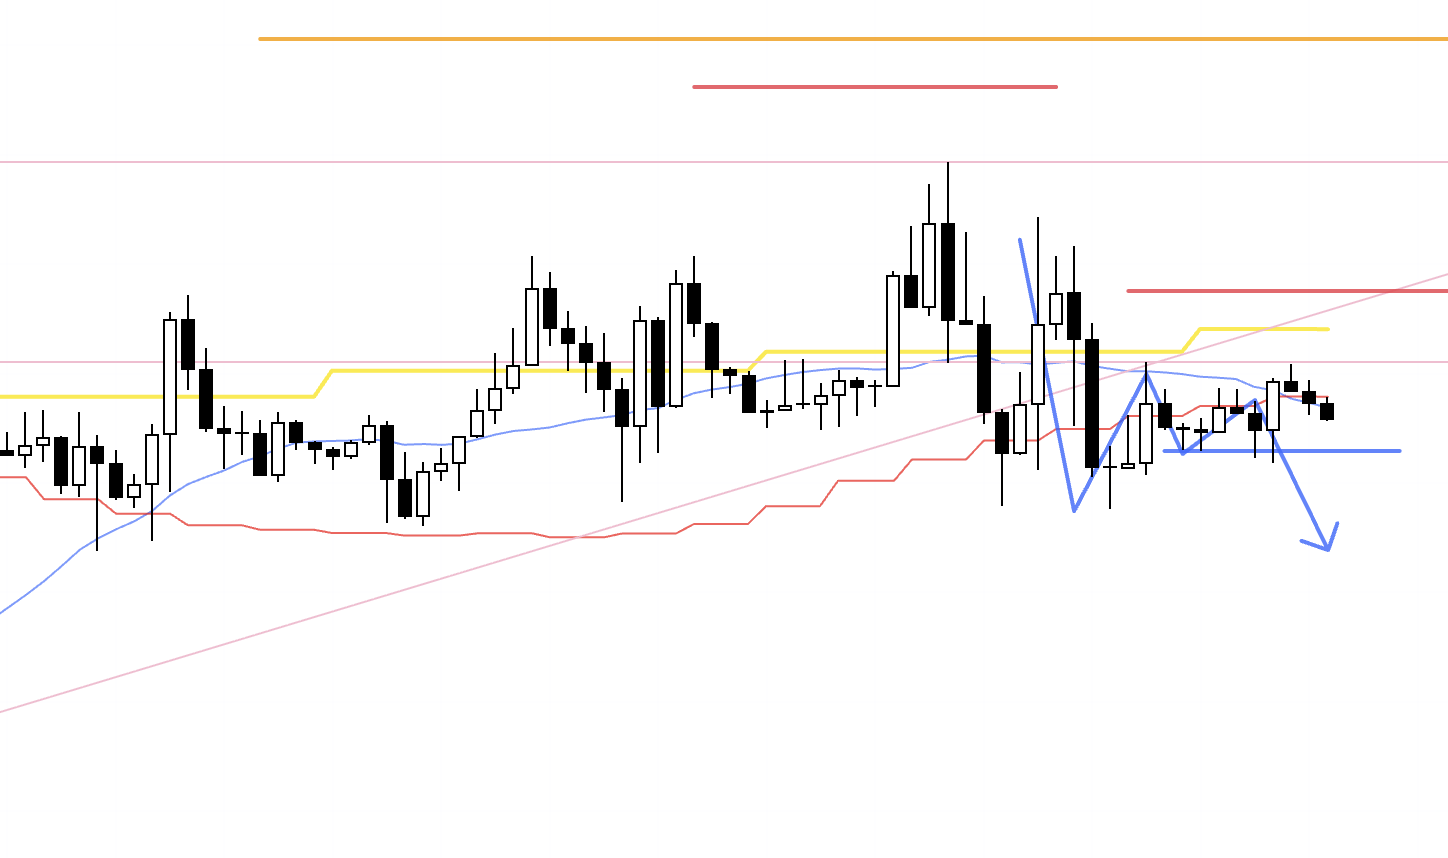
This is the USDJPY 4h chart.
This week’s price action lies to the right of the blue vertical line shown on the chart.
USDJPY finally broke out of the prolonged range last week, and I was waiting to buy the dip, but price soon slipped back into the range.
There were no points in USDJPY worth considering for a trade this week.
Next, please see the EURUSD chart below.
EURUSD 4h
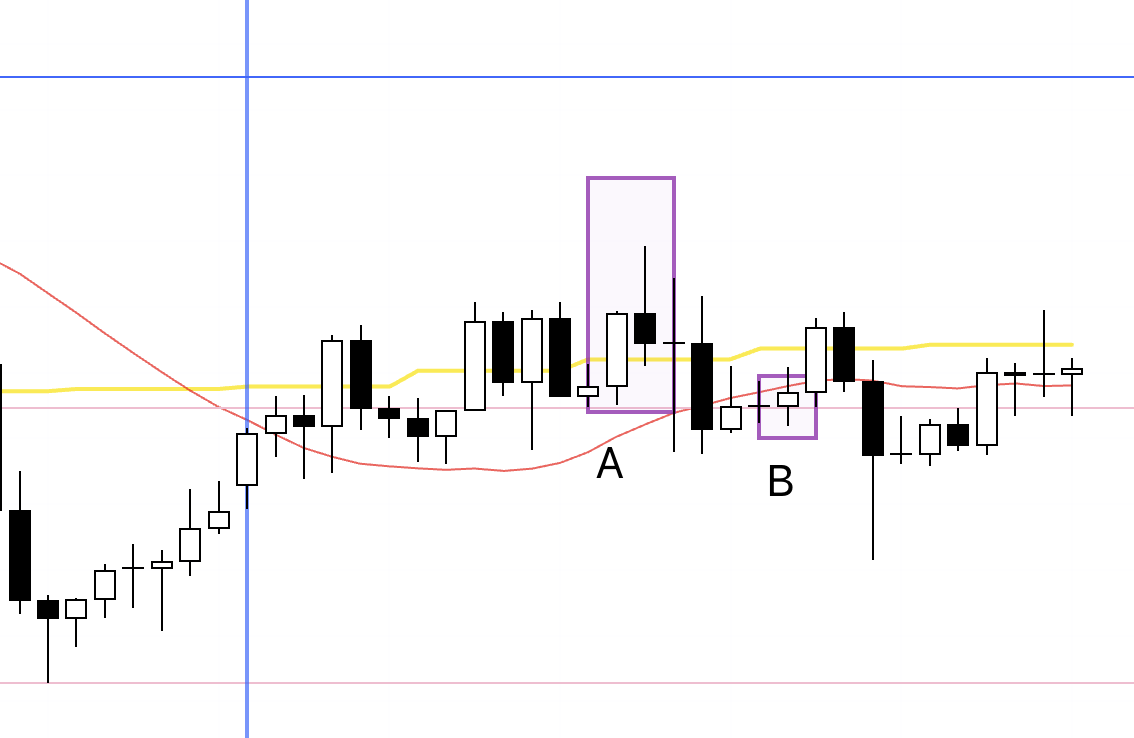
This is the EURUSD 4h chart.
There were two points I considered for trades in EURUSD this week.
I actually executed only at point A, while at point B I waited for an entry, but conditions were not met and I canceled it.
I took screenshots before each entry and wrote commentary, which I will share below.
〜・〜・〜・〜・〜・〜・〜・〜・〜・〜・〜・〜・〜・〜・
October 1 (Wed)
EURUSD
The buy scenario I had outlined in Sunday’s Trade Scenarios blog materialized.
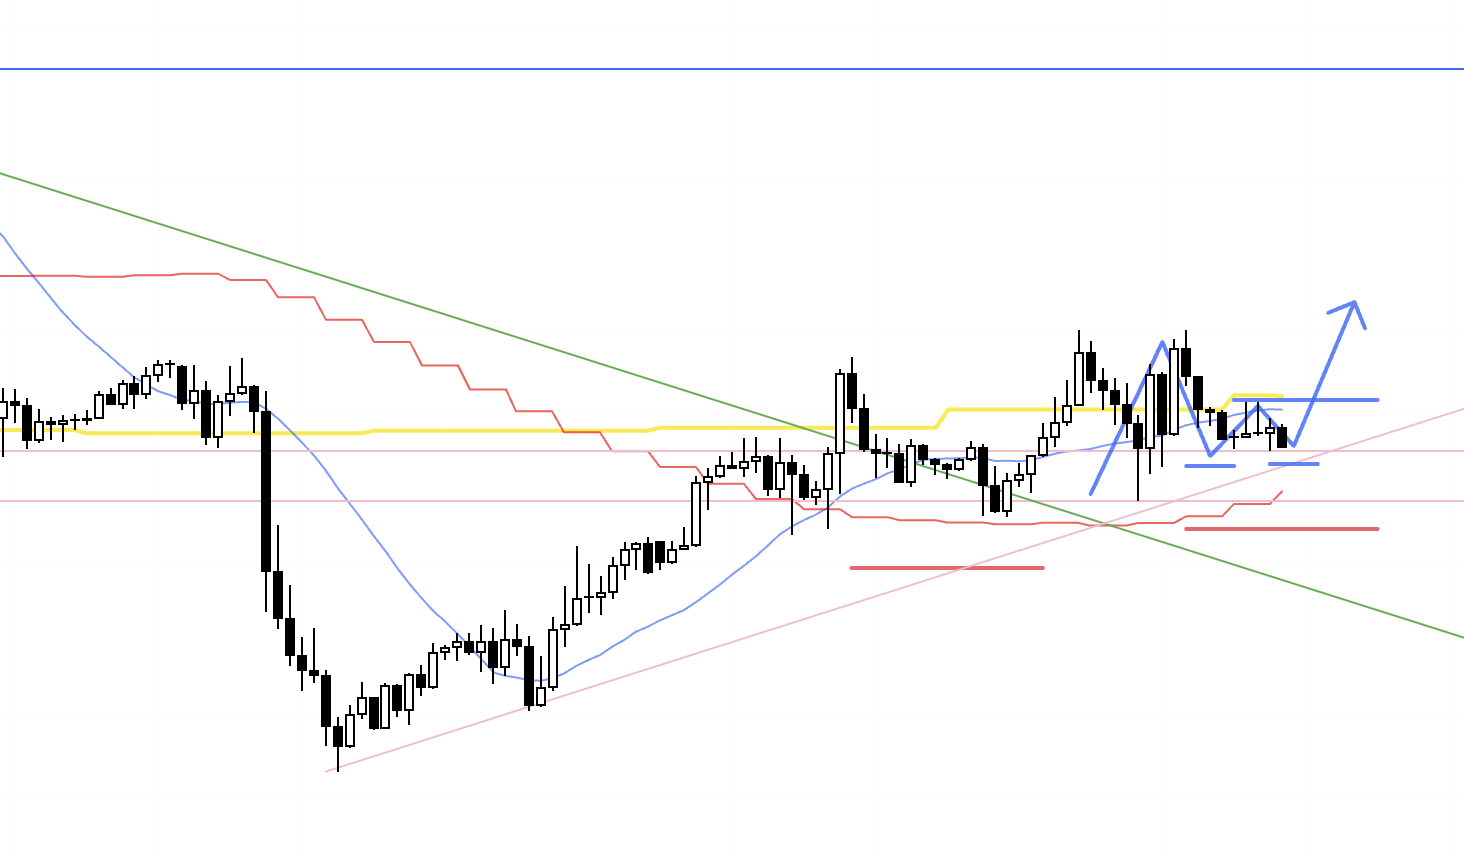
4h chart from the Sunday Trade Scenarios blog

On 4h, I was looking for a buy scenario at the juncture where higher lows would end the prior downtrend and turn into a new uptrend.
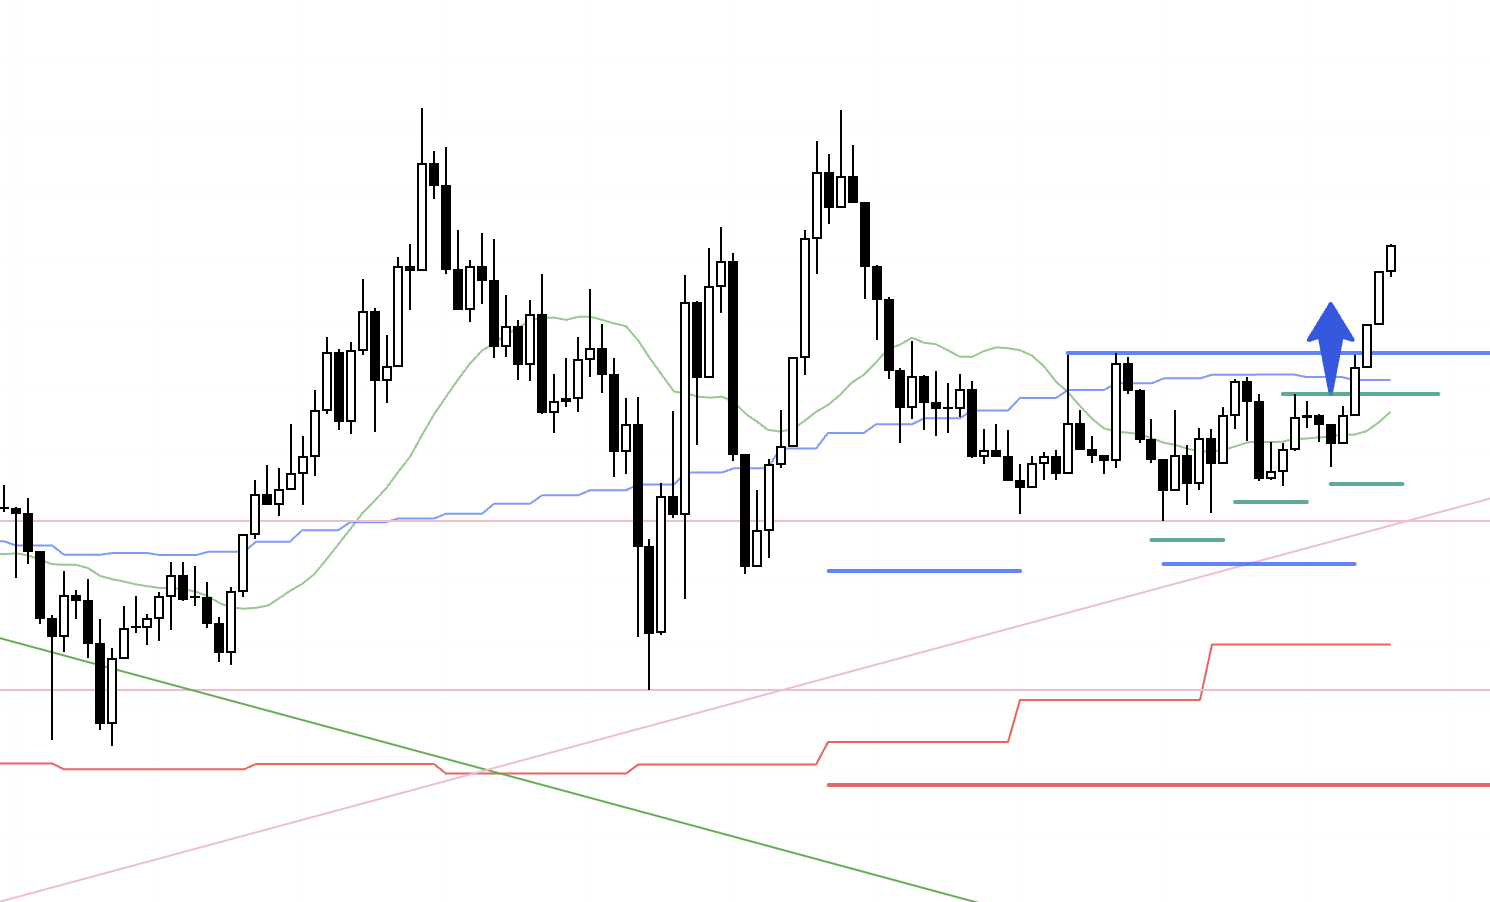
4h
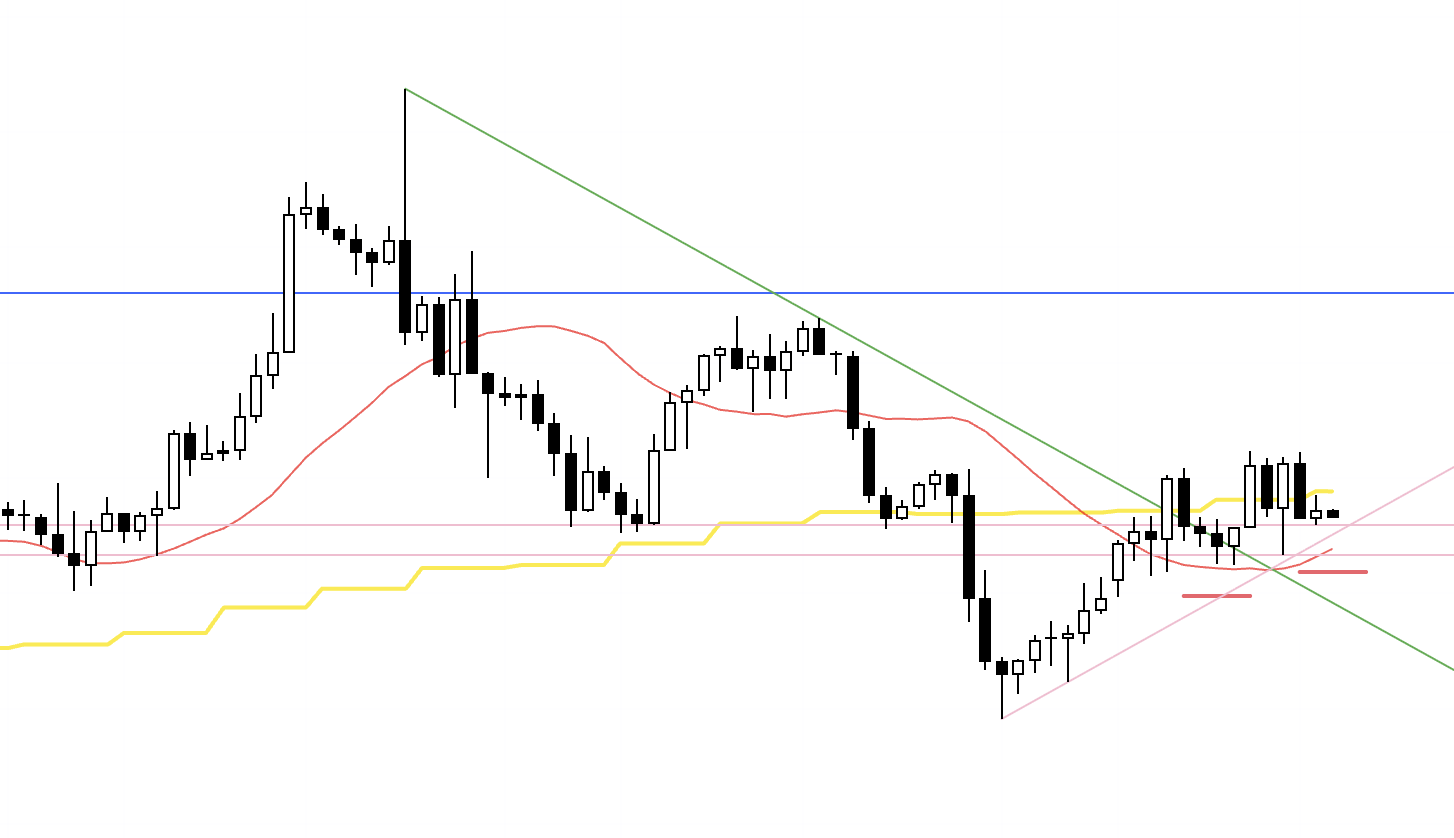
This is the actual 4h chart.
As it began to form the higher-low structure anticipated in Sunday’s scenario, I looked to buy as a pullback.
Price also broke the descending trendline (green) drawn across the highs of the prior downtrend and carved out a fresh higher-low pivot.
As noted in the scenario, this is the first inflection where an uptrend could begin, a spot with upside edge.
Let’s zoom into the 1h for more detail.
1h
On 1h, within the 4h higher-low zone, a double bottom formed and price was about to take out the high.
If I can enter a step earlier on a lower timeframe, I prefer to do so.
15m
The entry triggered.
This is the 15m chart, and I was able to enter one step earlier at the break of the green line than the 1h high (blue line) we had just observed.
From here, as usual, once higher lows form I use a trailing stop and hold until the trend breaks.
15m
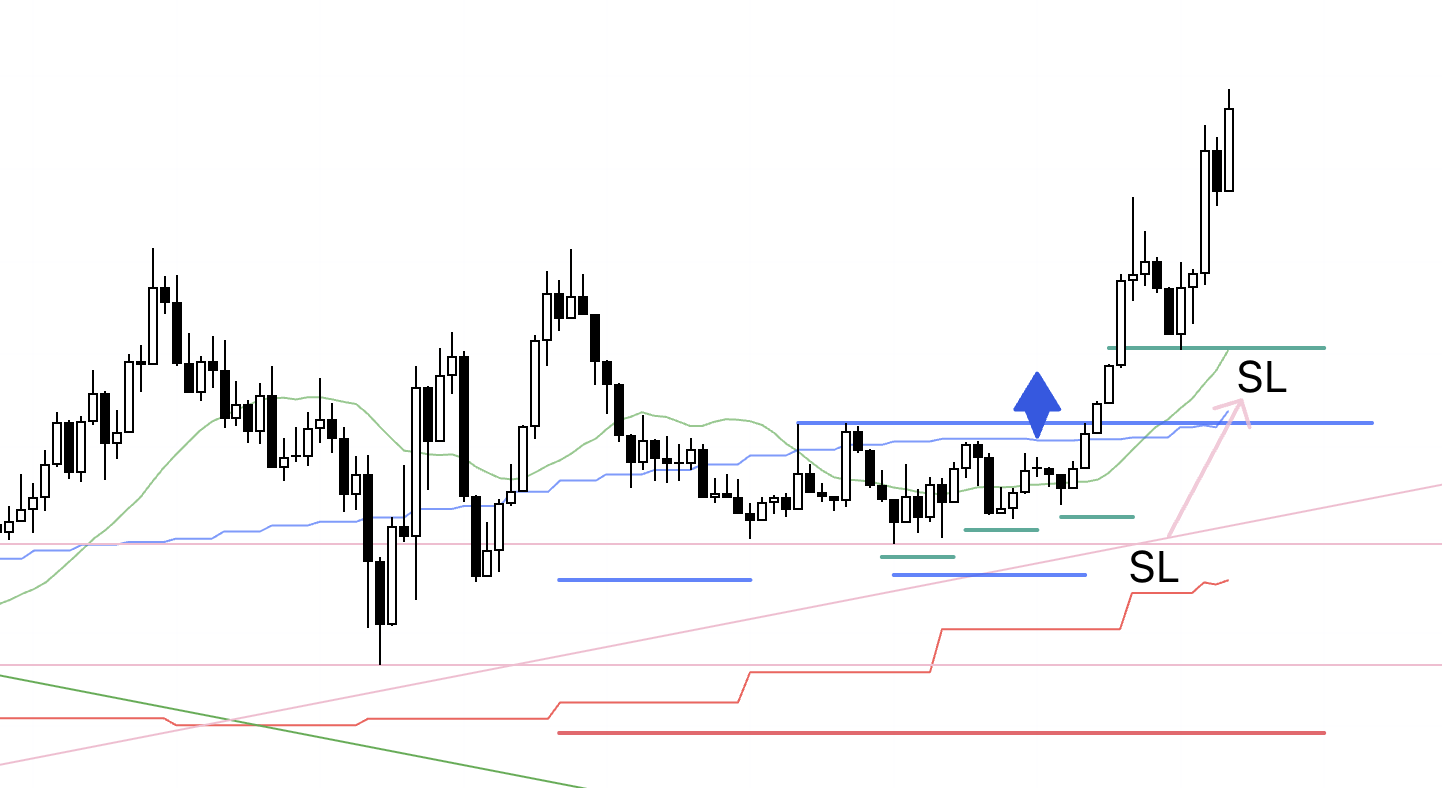
After a higher low printed, I raised the SL to just below that higher low.
15m

Price then reversed sharply, and the trade was closed.
When you see a result like this, you might think, “You should have taken profits on that prior surge.”
But that is hindsight.
No one knows in advance how far it will run or exactly where it will turn.
You cannot consistently pick the top.
That is precisely why you must exit repeatedly according to your pre-set rules.
The question is not this single outcome, but whether repeating this exit rule over many iterations leaves a net profit.
That is what matters.
〜・〜・〜・〜・〜・〜・〜・〜・〜・〜・〜・〜・〜・〜・
October 2 (Thu)
EURUSD
4h
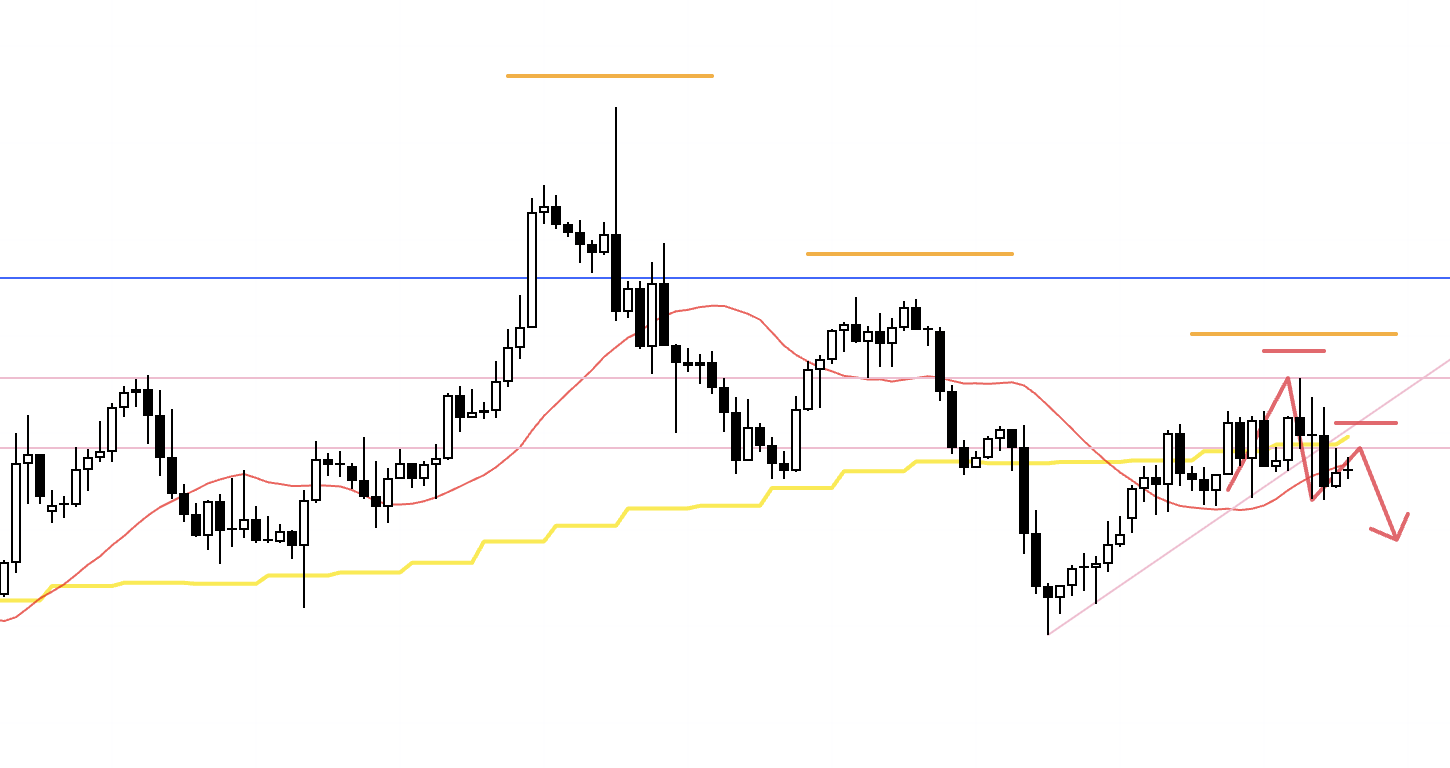
On 4h, a lower-high pivot formed, setting up a potential realignment with the daily downtrend.
This creates the possibility that the daily pullback has stalled and that a new leg lower, as a sell-the-rally sequence, is beginning.
1h
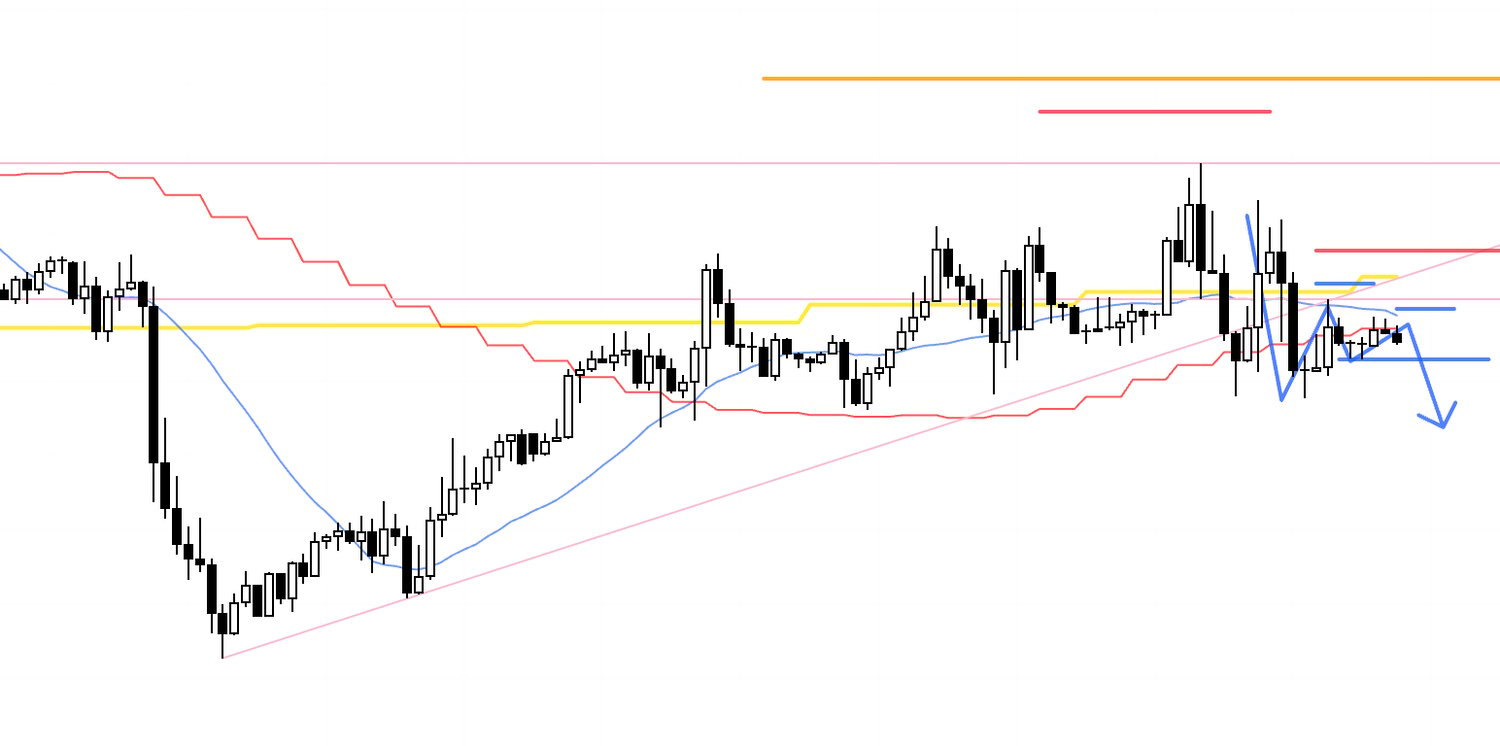
On the 1h chart, within the 4h lower-high area, 1h was also attempting to make a lower high.
Price broke the rising trendline drawn from the origin of the prior advance and, capped by a horizontal level, began to lower the highs, so if a lower low were confirmed, the short would have edge.
Breaking the most recent low (blue line) would confirm the lower-high structure, so I placed a sell stop order to enter on that break.
1h
Price then dipped slightly below the low, but did not hit my stop order, and instead broke above the high, invalidating the entry conditions, so I canceled the order.
〜・〜・〜・〜・〜・〜・〜・〜・〜・〜・〜・〜・〜・〜・
That is all.
Because I keep showcasing the same types of trades, those who have read this blog from the beginning may now have a clear sense of where I trade and where I do not.
I continue to execute entries and exits based on consistent criteria, acting faithfully in line with pre-defined scenarios.
Because I know exactly what I am waiting for, I do not hesitate in my decisions.
As I have said many times on X, trading is about repeatedly executing consistent entries and exits and letting the sum of wins and losses leave a profit.
Do not be swayed by any single outcome, but keep following your pre-set rules and act only at points where you have edge.
I hope this is of value.