

Hello.
I’m outlining trading scenarios for the week ahead.
I publish this “Trade Scenarios” blog every Sunday.
And every Saturday I post a “Weekly Trade Report” detailing how I thought through and executed my trades over the prior week.
Read together with the Trade Scenarios post, I think it will help you see a consistent, practical process—how I plan in advance, what I wait for, and how I execute.
For strategy, please refer to my posts on Dow Theory and multi‑time‑frame analysis.
A scenario is not a prediction.
It is not a forecast, but my personal plan: “If this happens, I will do that.”
I don’t make market predictions, and this is not intended as one, so please keep that in mind.
Nor is this an instruction to buy or sell, or a signal service.
It makes no guarantee of future profit, and is offered solely for educational purposes to show how I run a consistent process.
I cannot take responsibility for the results of your trades, so please trade at your own risk.
With that, let’s start with USDJPY.
(On my charts, the line colors are: daily in orange, 4h in red, 1h in blue, and 15m in green, each representing the movement of that time frame.)
〜・〜・〜・〜・〜・〜・〜・〜・〜・〜・〜・〜・〜・〜・
USDJPY
Daily
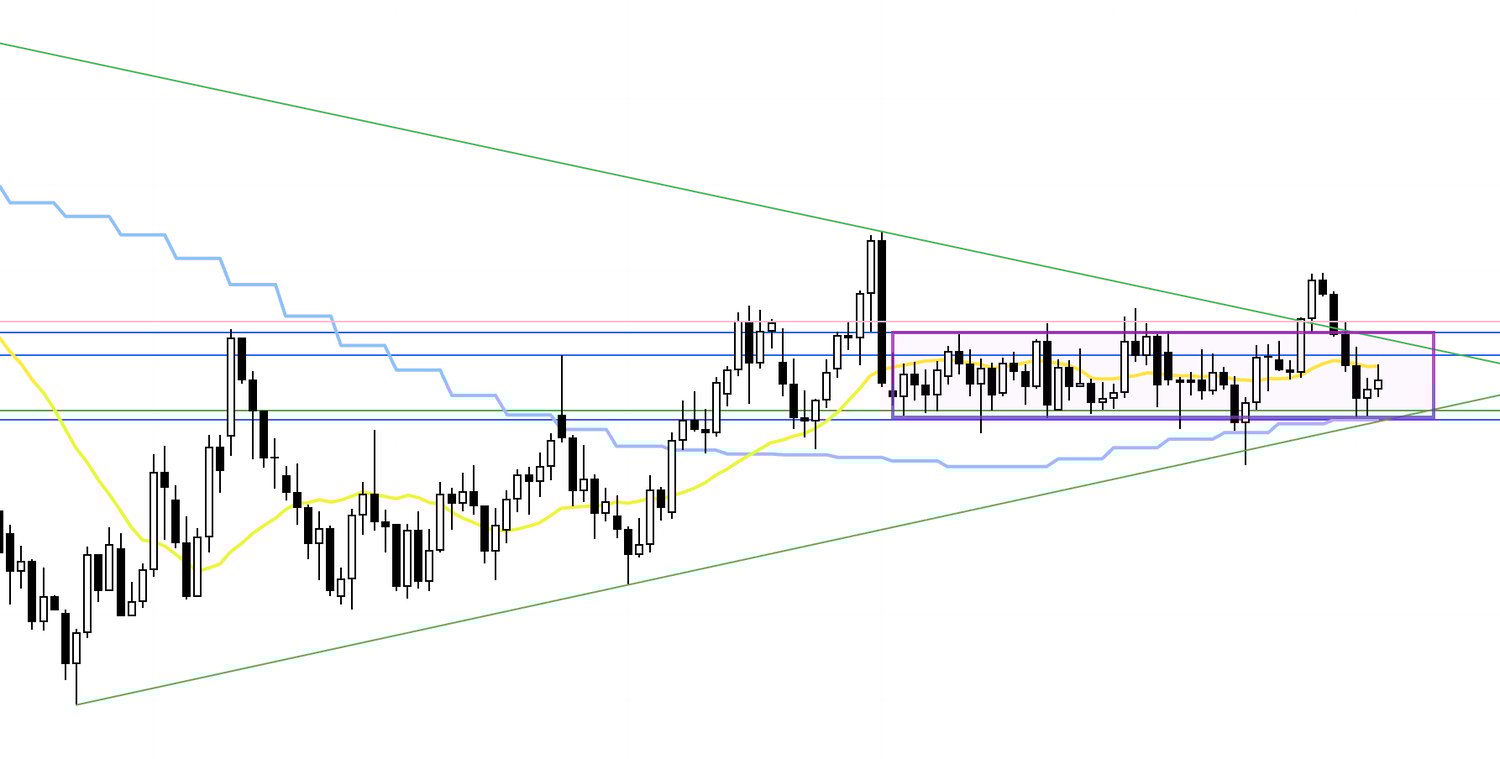
This is the daily chart, and after finally breaking above the long range last week (the area boxed in purple), price slipped back into the range and is currently contained within it, seemingly supported by the range’s lower boundary.
Daily
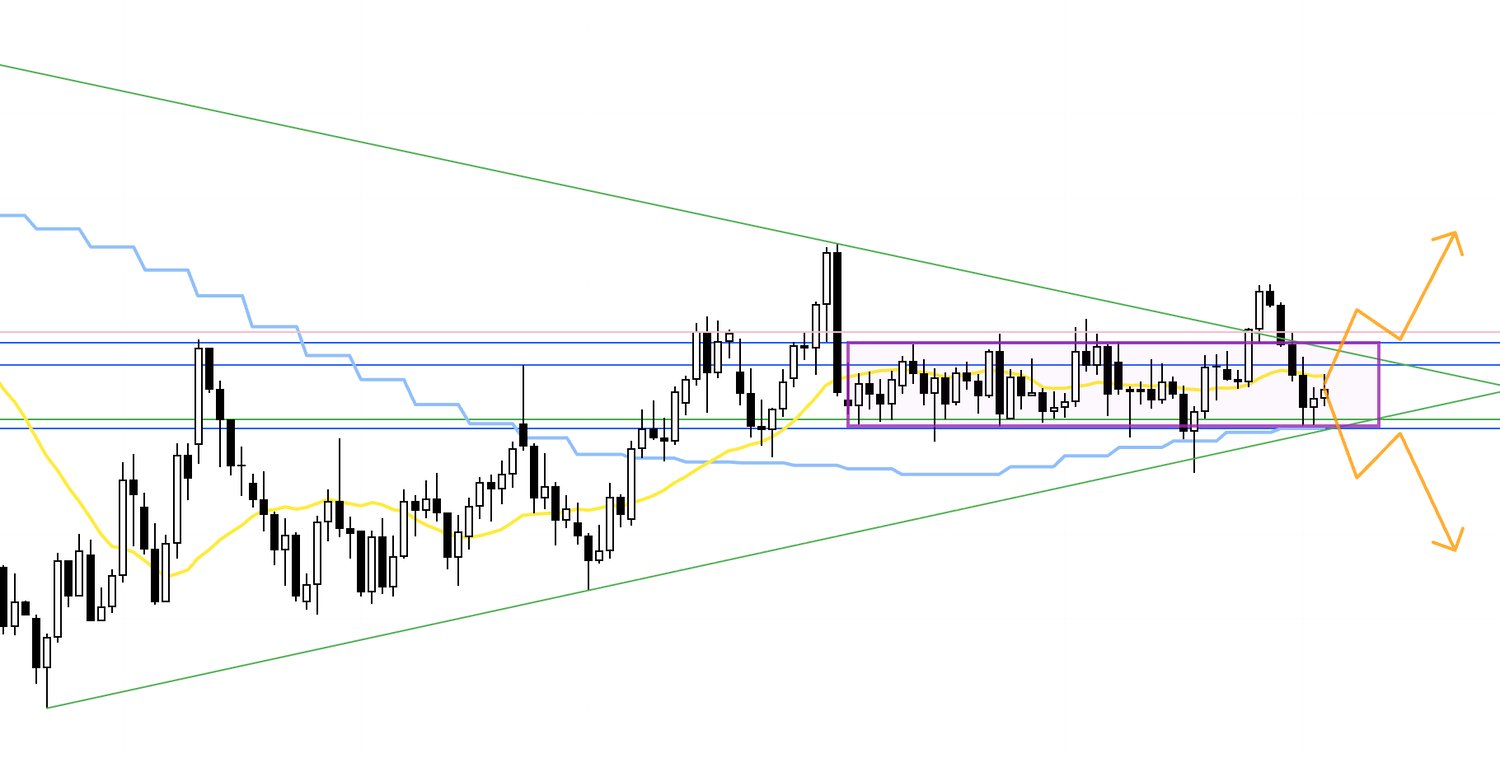
We are also boxed in between upper and lower trendlines that can be drawn on the weekly, and there is no trend at the moment, so I will only consider trades after a break in either direction.
My job is not to predict which way it breaks and try to nail it.
What matters is being indifferent to direction and having a plan for either outcome.
Now let’s look at EURUSD.
〜・〜・〜・〜・〜・〜・〜・〜・〜・〜・〜・〜・〜・〜・
EURUSD
Daily
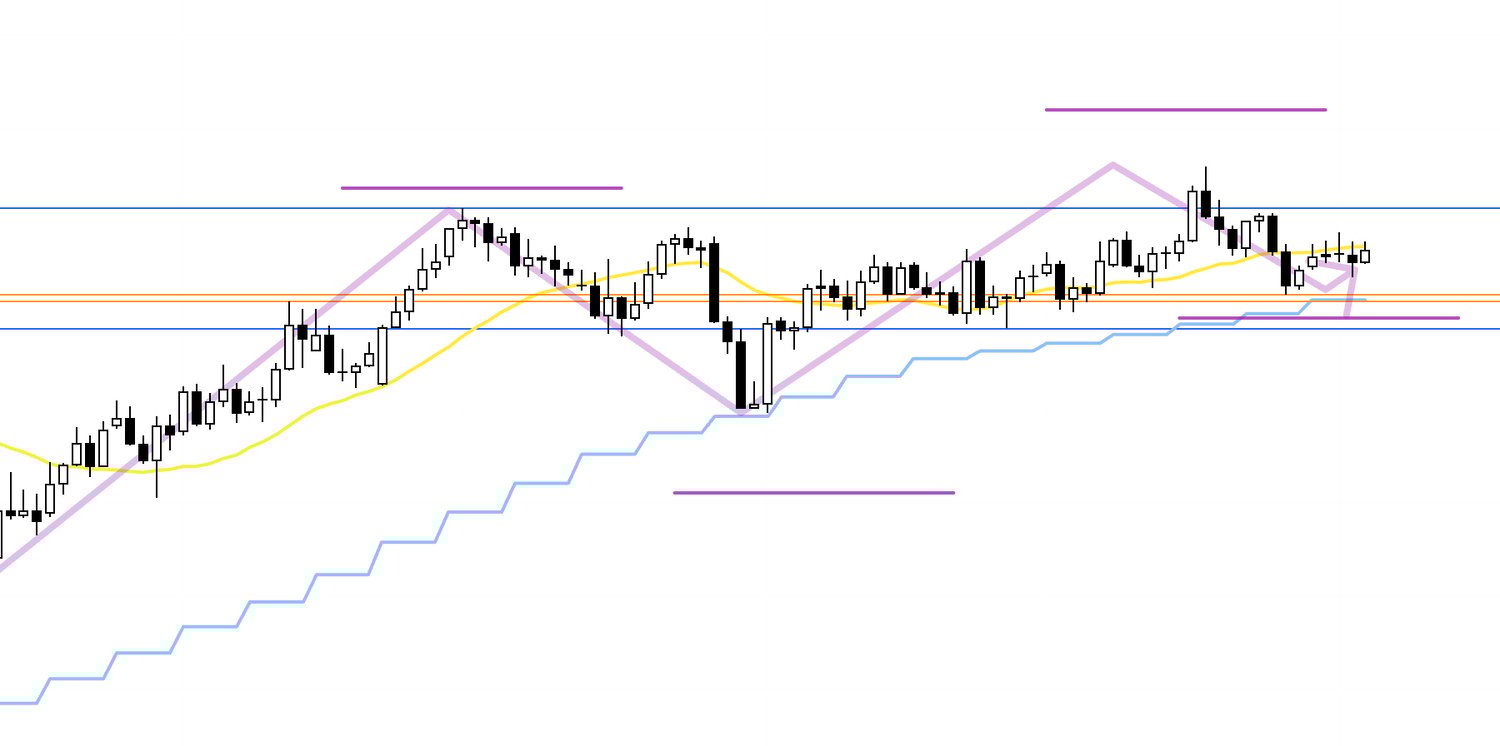
The purple overlay on this daily chart shows the weekly structure.
On the weekly, we’ve been making higher lows while printing higher highs, and we are currently in a weekly buy‑the‑dip area.
Daily
However, on the daily we’re putting in lower highs.
So if you looked at the daily alone, you would want to sell, but because we are in a weekly pullback‑buy zone, buy and sell orders are likely to collide, making this a higher‑risk setup.
Daily
Conversely, if price forms a new higher‑low pivot and transitions back into a daily uptrend, we will be aligned with the weekly and gain a bullish edge.
With that in mind, let’s look at the 4h.
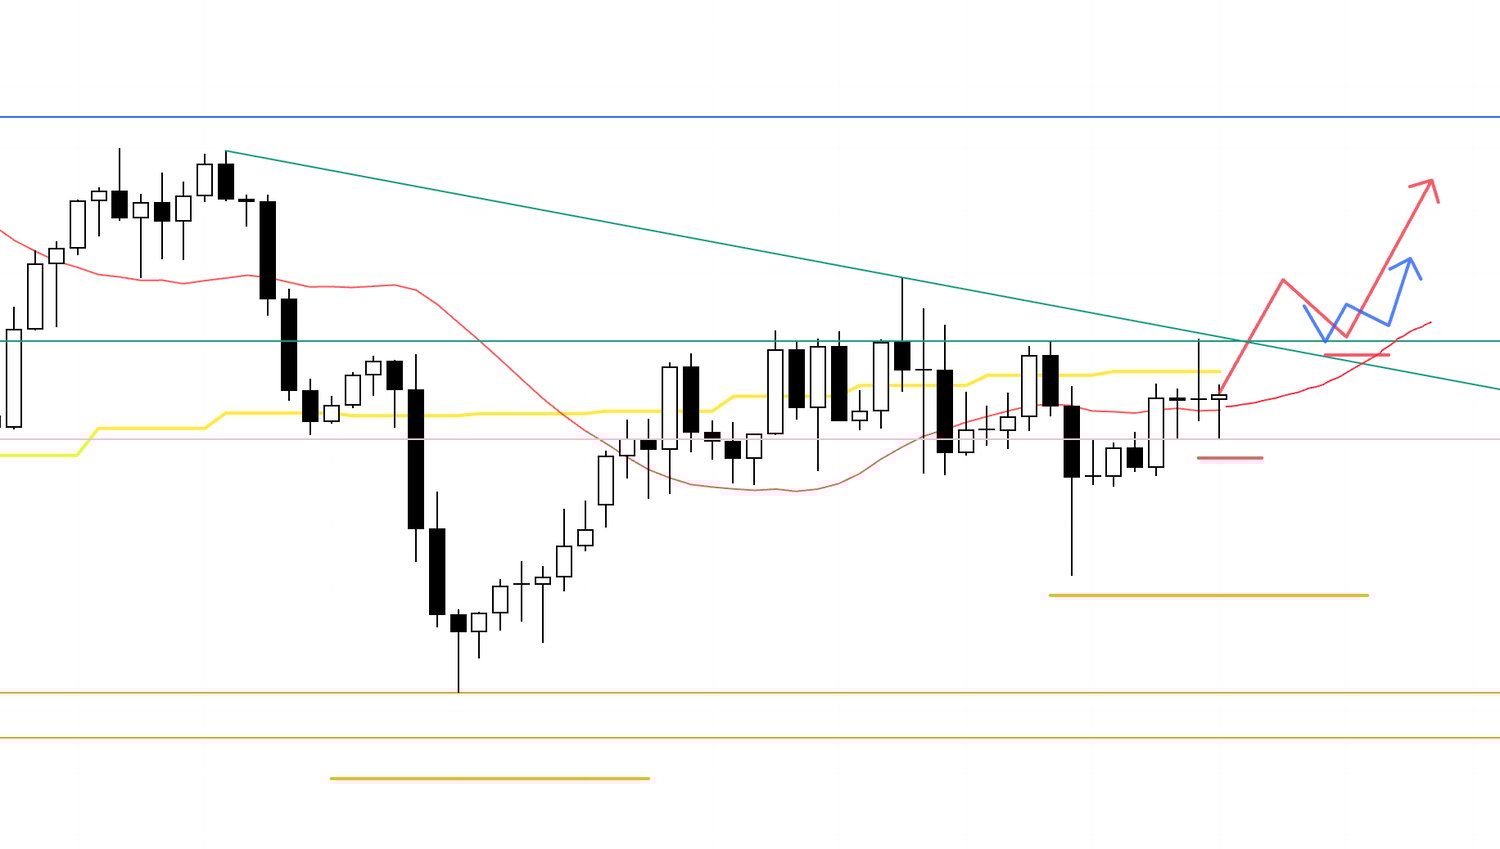
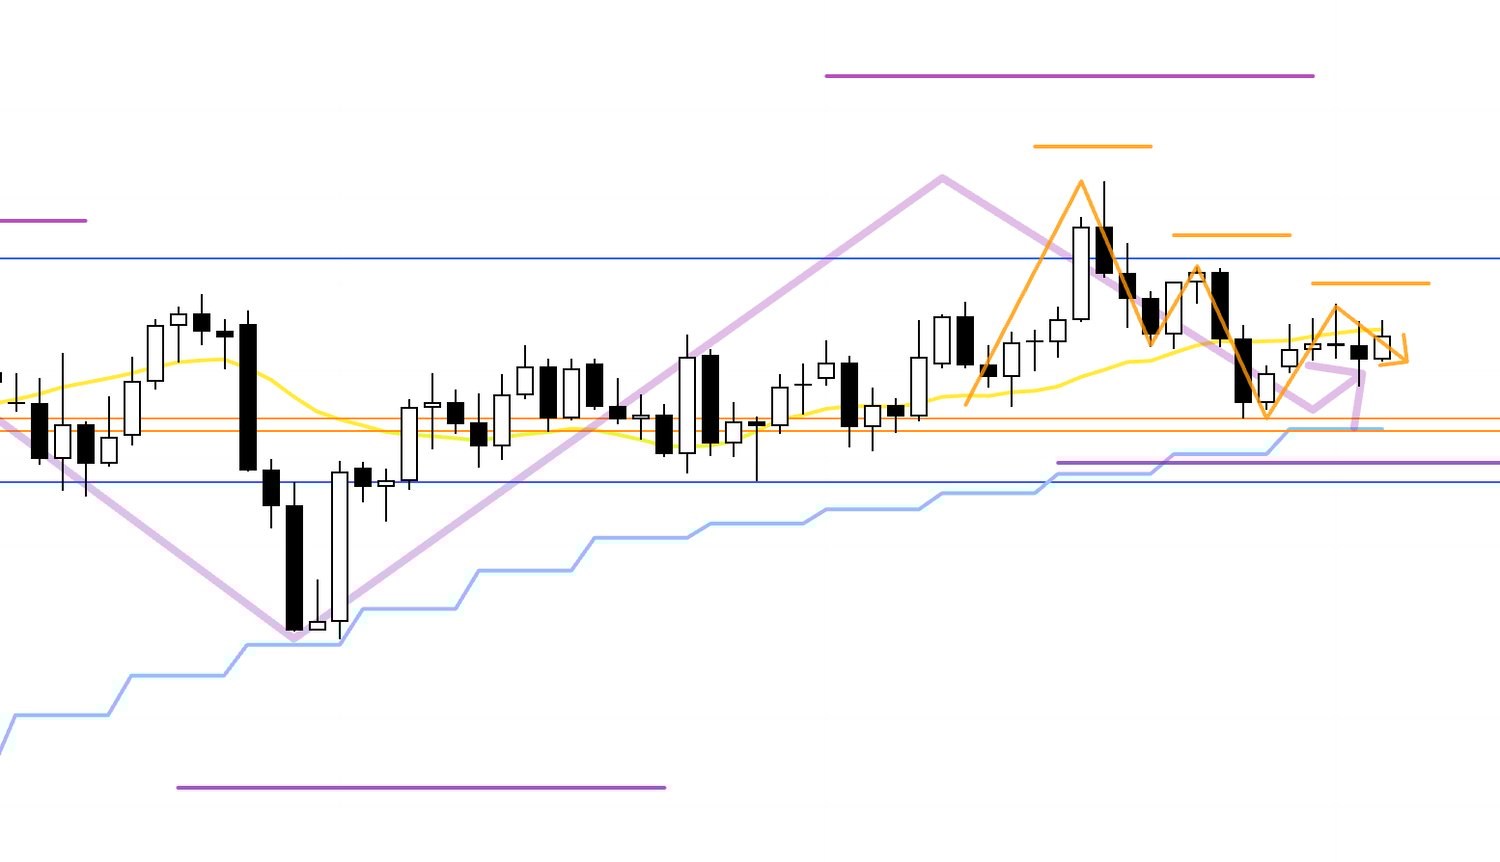
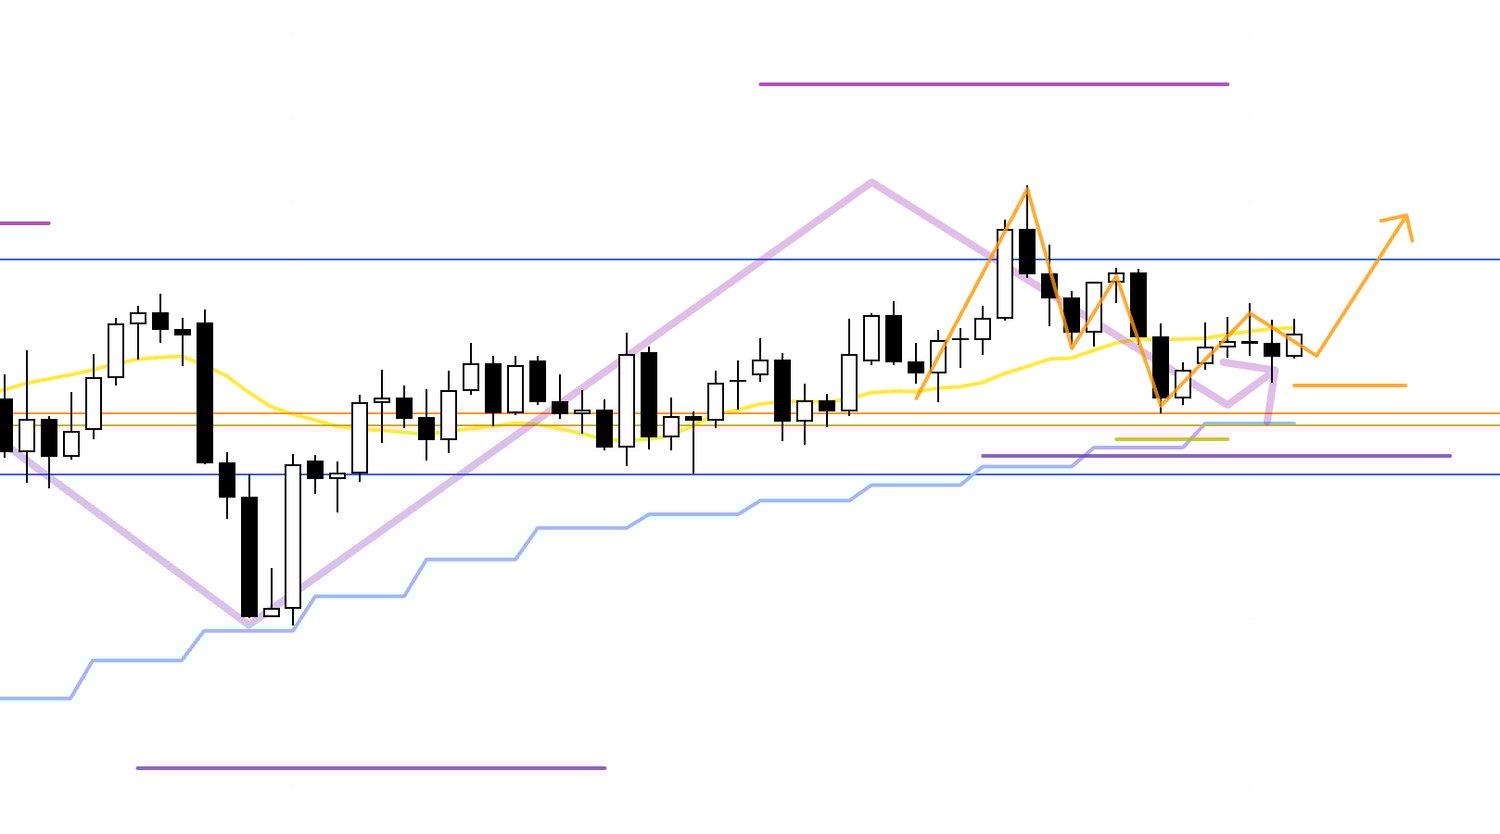
4h

This is the long scenario—participating in a daily trend reversal as a weekly pullback buy.
Right now the green horizontal level has capped price multiple times, and the green trendline has rejected it three times as well, so jumping in long immediately is risky.
First I want to see a clean break above those, then I’ll target the pullback on the lower time frames.
4h

Alternatively, if these lines continue to hold and a new 4h lower‑high forms, I’ll follow the downside on the lower time frames as a daily sell‑the‑rally move.
In that case, the further it falls, the greater the risk of encountering weekly dip‑buying, so the key is whether I can initiate from as high a level as possible and whether an entry appears with acceptable risk‑reward.
If I do take a position, I’ll manage it by, for example, securing half the profit upon reaching risk thresholds such as key levels.
〜・〜・〜・〜・〜・〜・〜・〜・〜・〜・〜・〜・〜・〜・
That’s all for now.
These are scenarios as of this moment, and as the week gets underway I plan to update and build them out based on the actual price action.
USDJPY has slipped back into its range.
With the range persisting since August, trading conditions remain challenging.
But our job is to control what we can control.
There is no need to force trades in difficult patches.
Even if trade frequency drops, if you simply wait for your favorable spots and focus on clean trend‑following, you won’t see your capital erode needlessly.
I build scenarios the same way and execute the same way, every time.
It doesn’t matter how the chart moves.
If a long edge appears, I buy.
If a short edge appears, I sell.
If I’m in a position and the trend ends, I close it because there’s no reason to hold.
This approach does not rely on willpower—no heroic discipline to cut losses or to keep holding—because the rules dictate the action.
All of this is possible because I identify where the risks are in advance and construct scenarios beforehand, which lets me execute without hesitation.
I hope this consistent planning and execution helps you stay consistent in your own trading.
These scenarios are my personal plan.
If you haven’t yet settled on your trading approach, feel free to use them as a reference when building your own strategy.
But if your trading is already well‑defined, don’t let my plan distract you—stick to your rules.
Thanks for reading to the end.