

I will review key takeaways from this week’s trading, centering on the trades I actually executed.
This Weekly Trade Report is posted every Saturday.
If you read it alongside the Trade Scenarios I post every Sunday, you can see how I think in advance and how I then execute trades based on those scenarios in real time.
This is not advice telling you how to trade, nor am I presenting it as the correct answer.
It is not a showcase of individual wins or losses, nor a recommendation of any particular strategy based on those outcomes.
My aim is to show, at an operational level, how I repeatedly run a consistent process grounded in preplanned scenarios, so you can use it as a reference for building your own strategy and maintaining process consistency.
These results are solely my personal outcomes and do not guarantee your future profits.
Keep that firmly in mind, and make sure you conduct your own testing and preparation, and trade solely at your own risk.
I trade pullback buys and sell-the-rally setups on the 4h timeframe.
For my pullback and sell-the-rally approach, please refer to my prior posts on Dow Theory and multi-timeframe analysis.
Please see the charts below.
USDJPY 4h
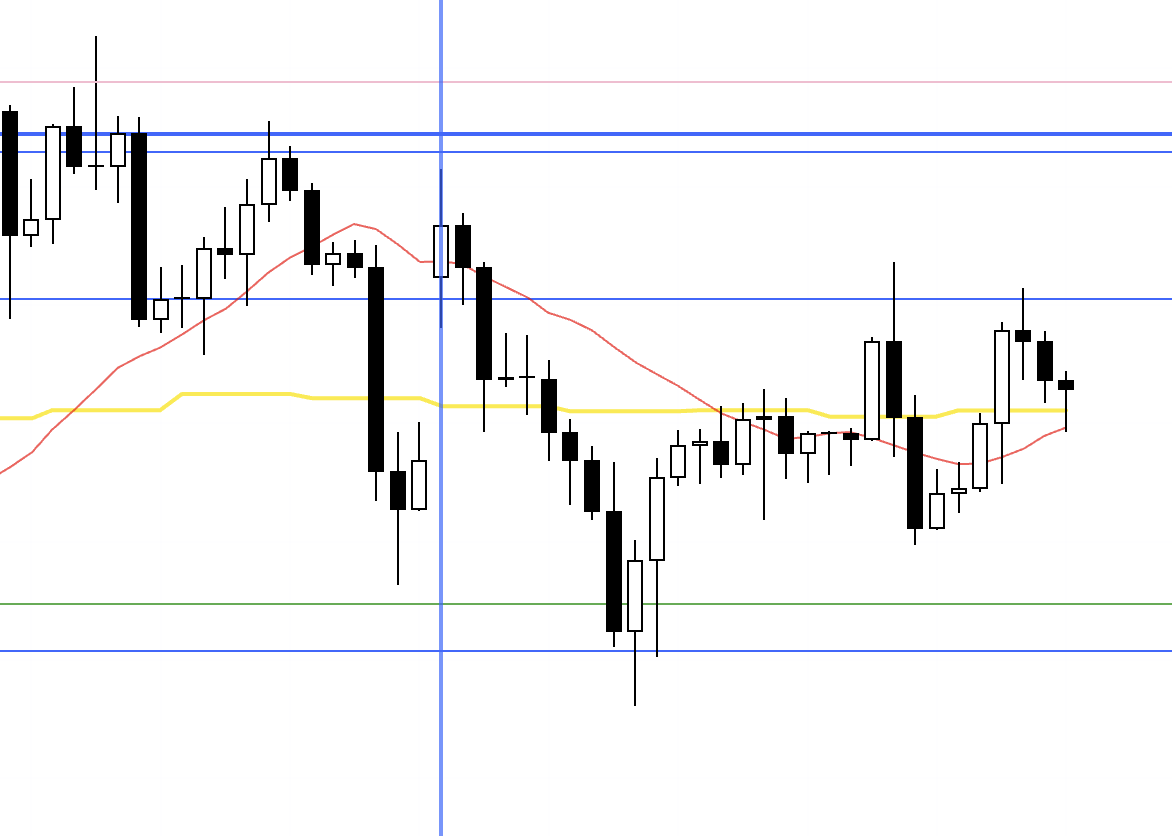
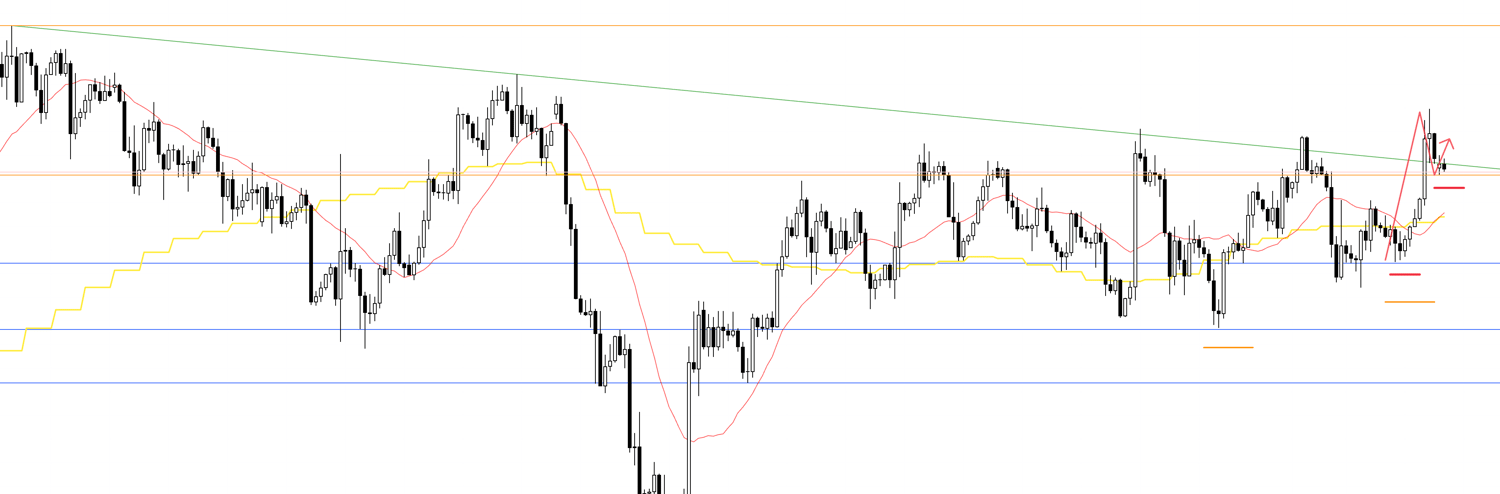
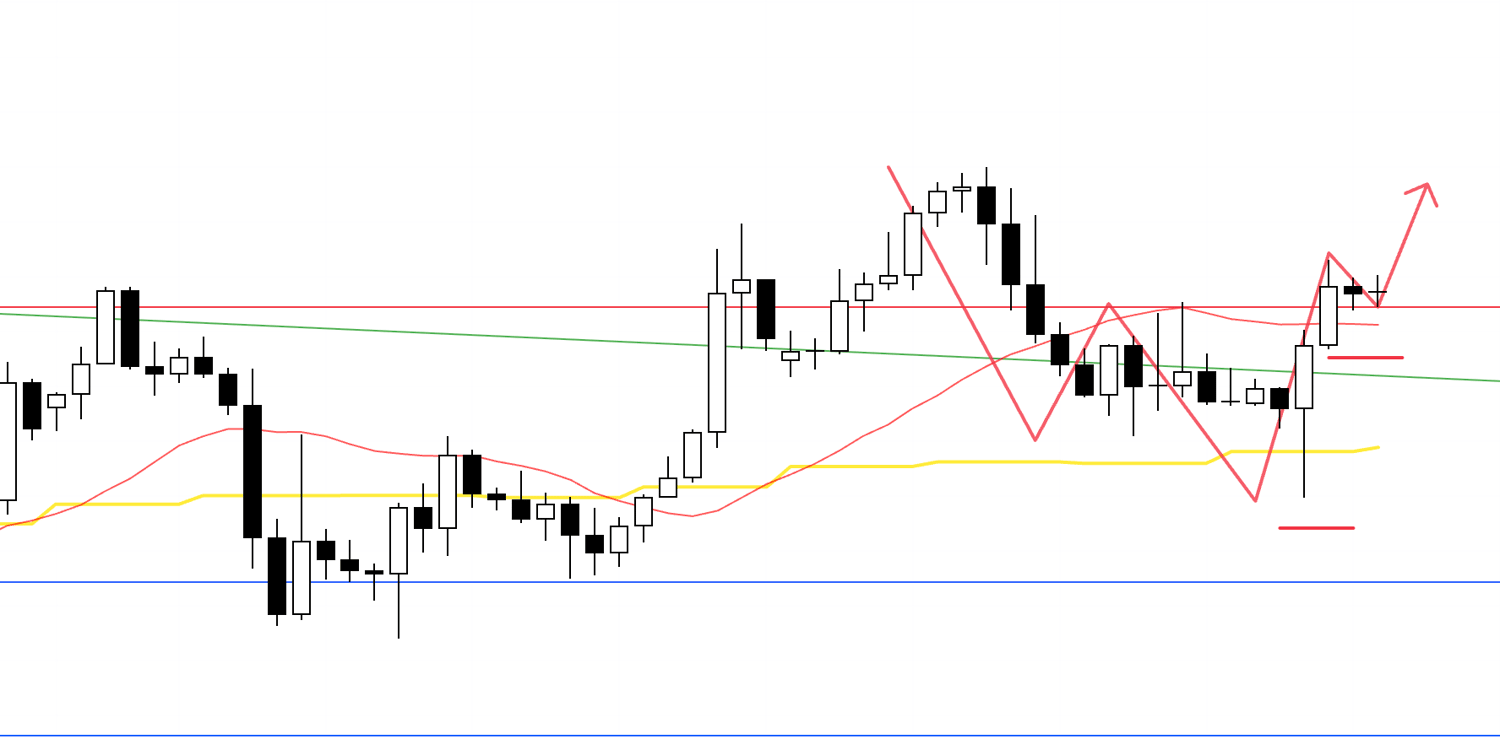
This is the 4h chart of USDJPY.
This week’s action is from the blue vertical line onward on the chart.
As with last week, price failed to break out of the range, and there were no tradeable setups for me in USDJPY.
Next, please see the EURUSD chart below.
EURUSD 4h

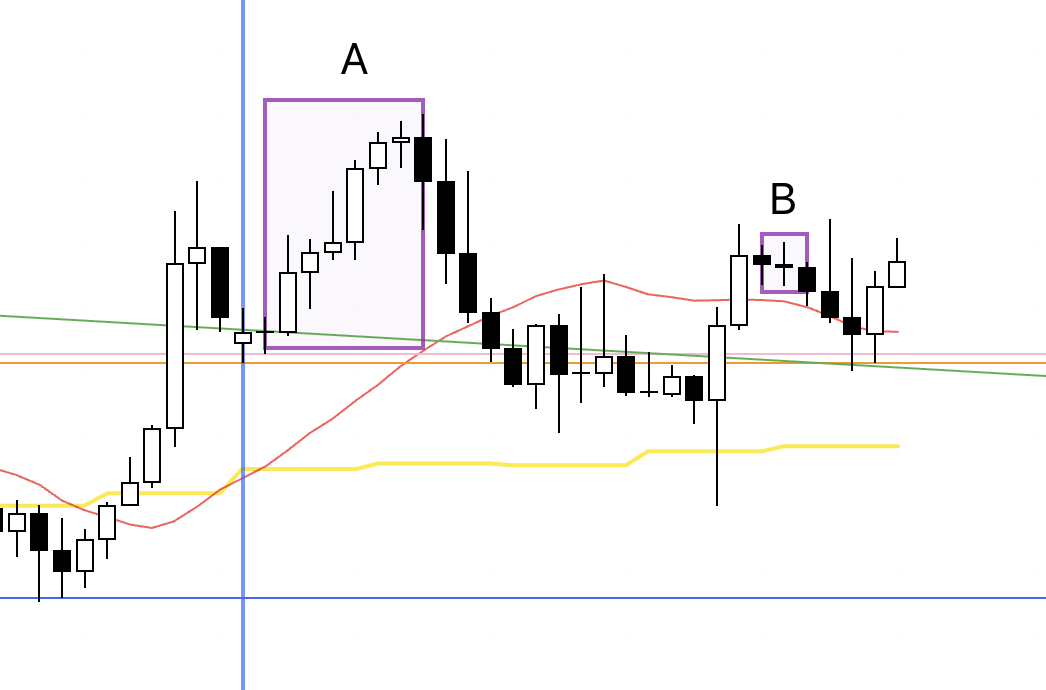
This is the 4h chart of EURUSD.
There were two areas this week where I considered taking trades in EURUSD.
I recorded both areas at the time of potential entry, but only point A resulted in an actual entry.
Point B documents the decision path that led to a pass, which I hope you find informative.
〜・〜・〜・〜・〜・〜・〜・〜・〜・〜・〜・〜・〜・〜・
September 8 (Mon)
EURUSD
4h chart from last Sunday’s Trade Scenarios post
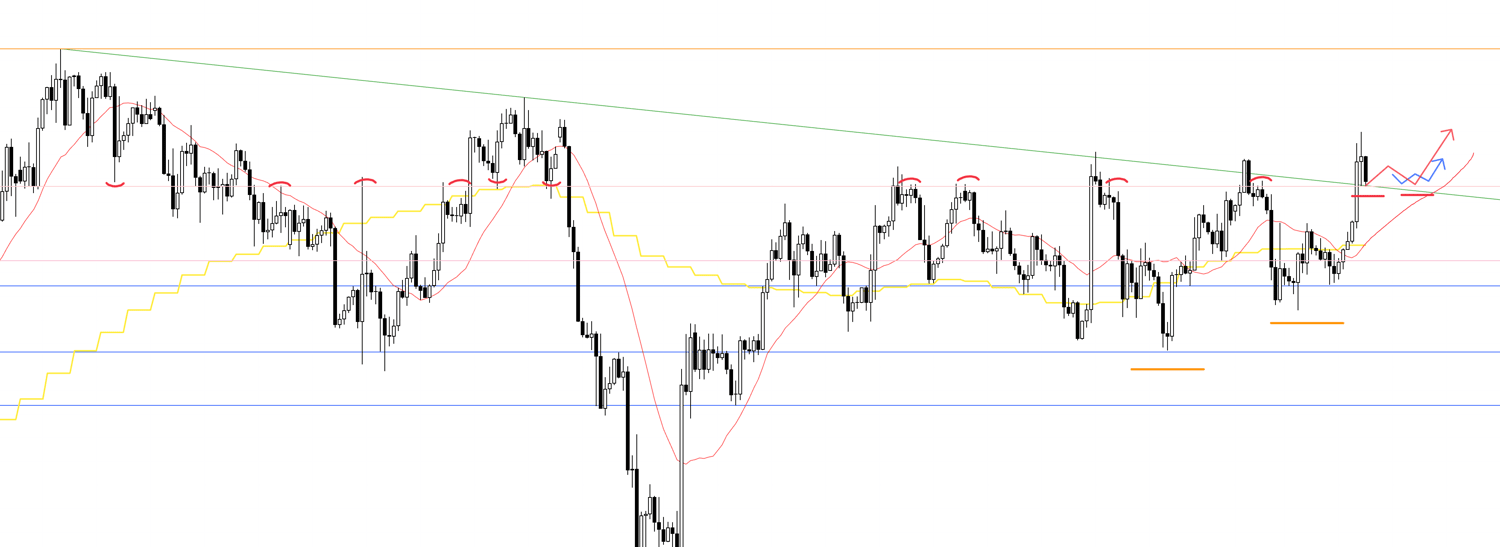
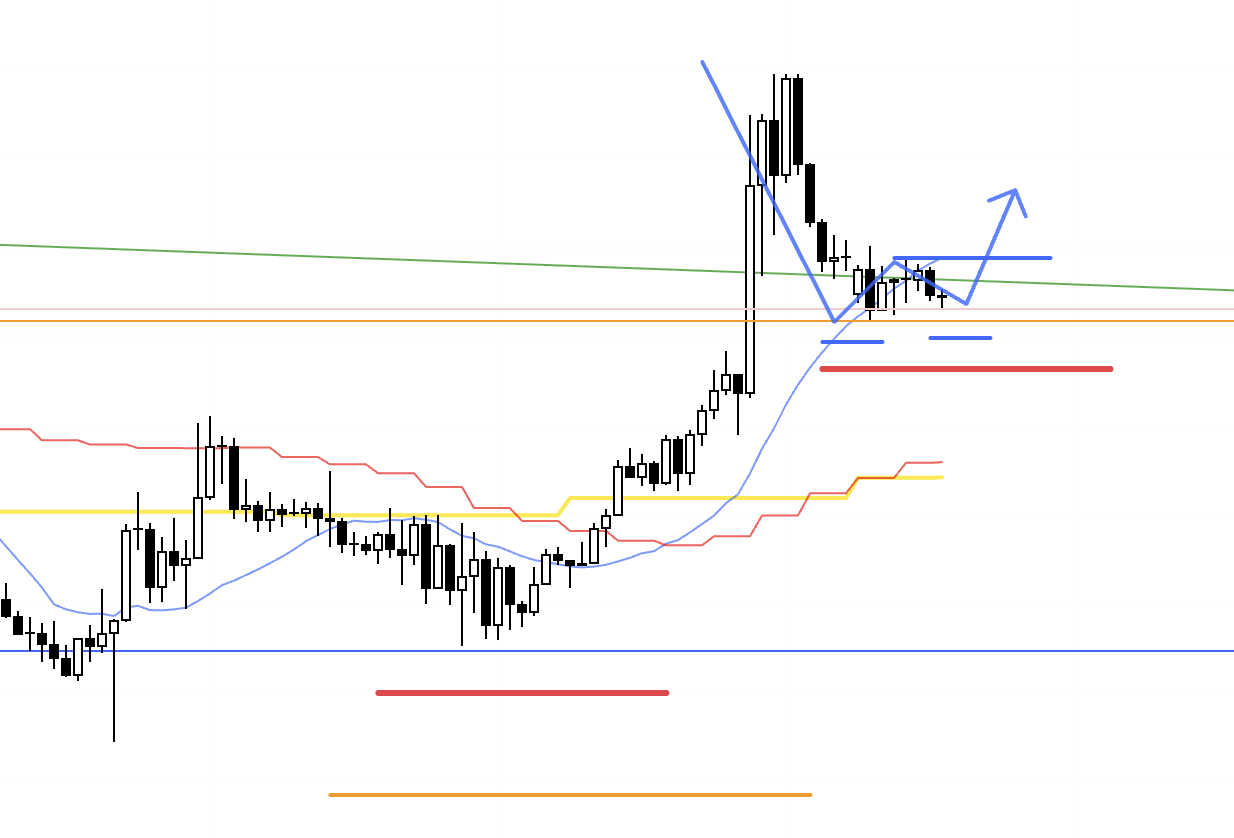
This is the chart from last Sunday’s Trade Scenarios.
The plan was to consider longs on a lower timeframe if the 4h found support near this pink divider line between buyers and sellers and then started to put in higher lows.
If support emerged in this area, it would also confirm a break above the green trendline, making it easier for new buy orders to cascade, and creating a point with strong edge.
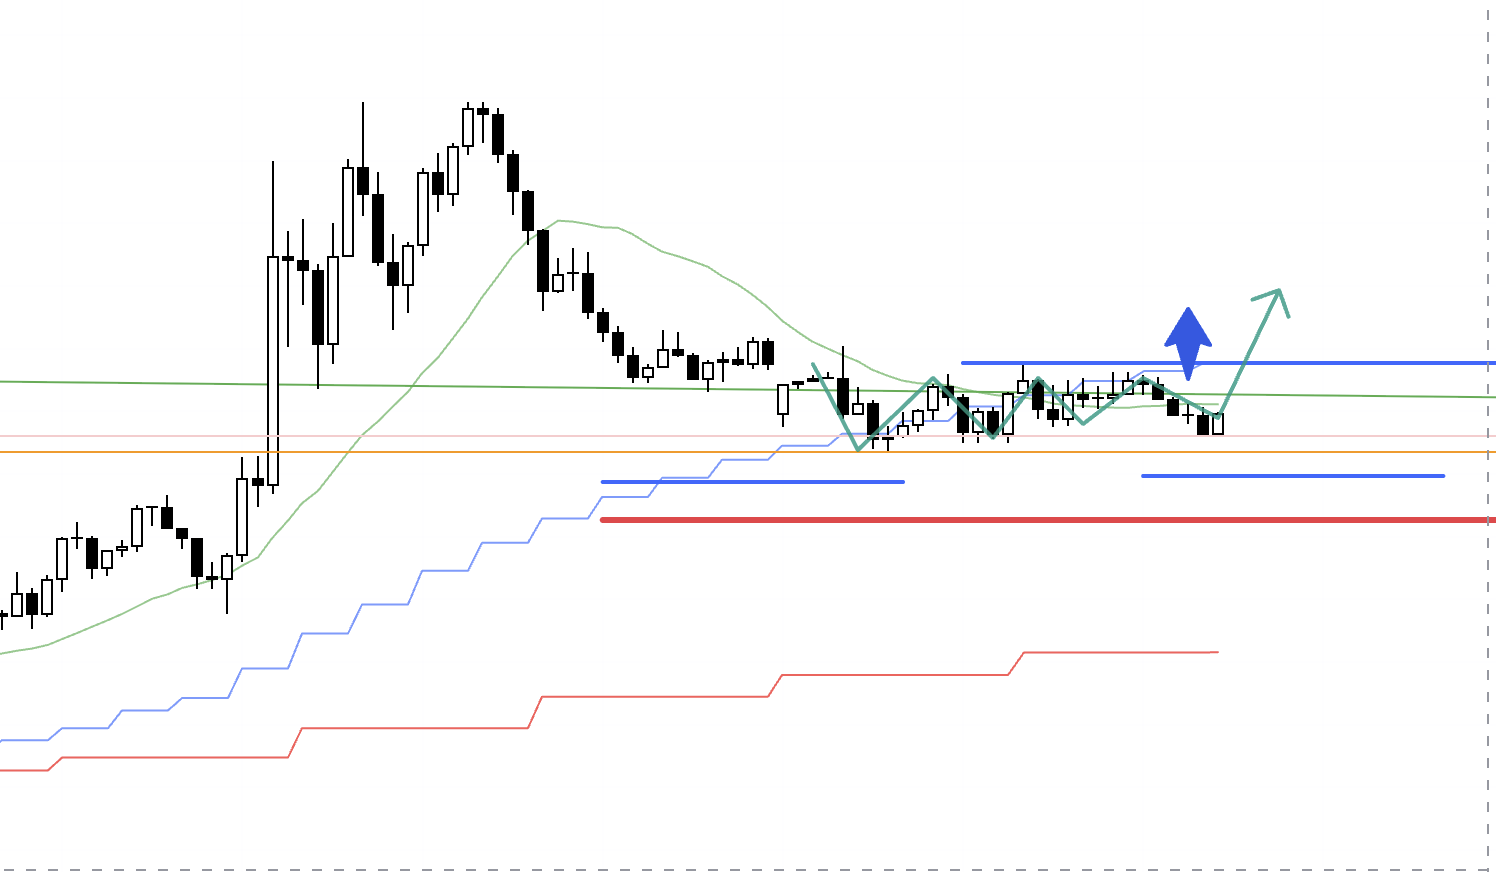
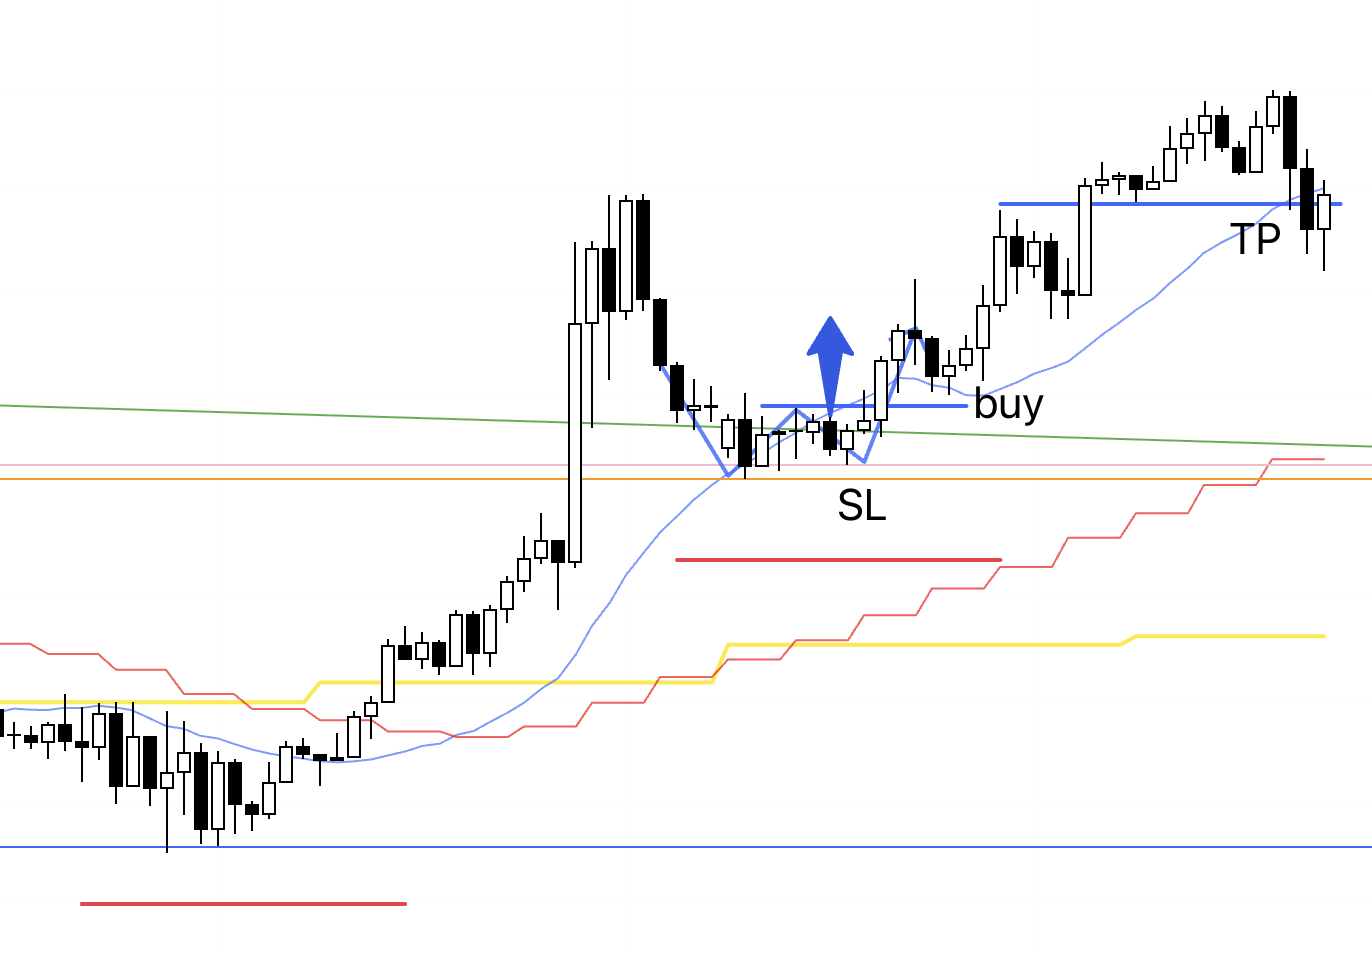
Now let’s look at the actual 4h chart.
4h
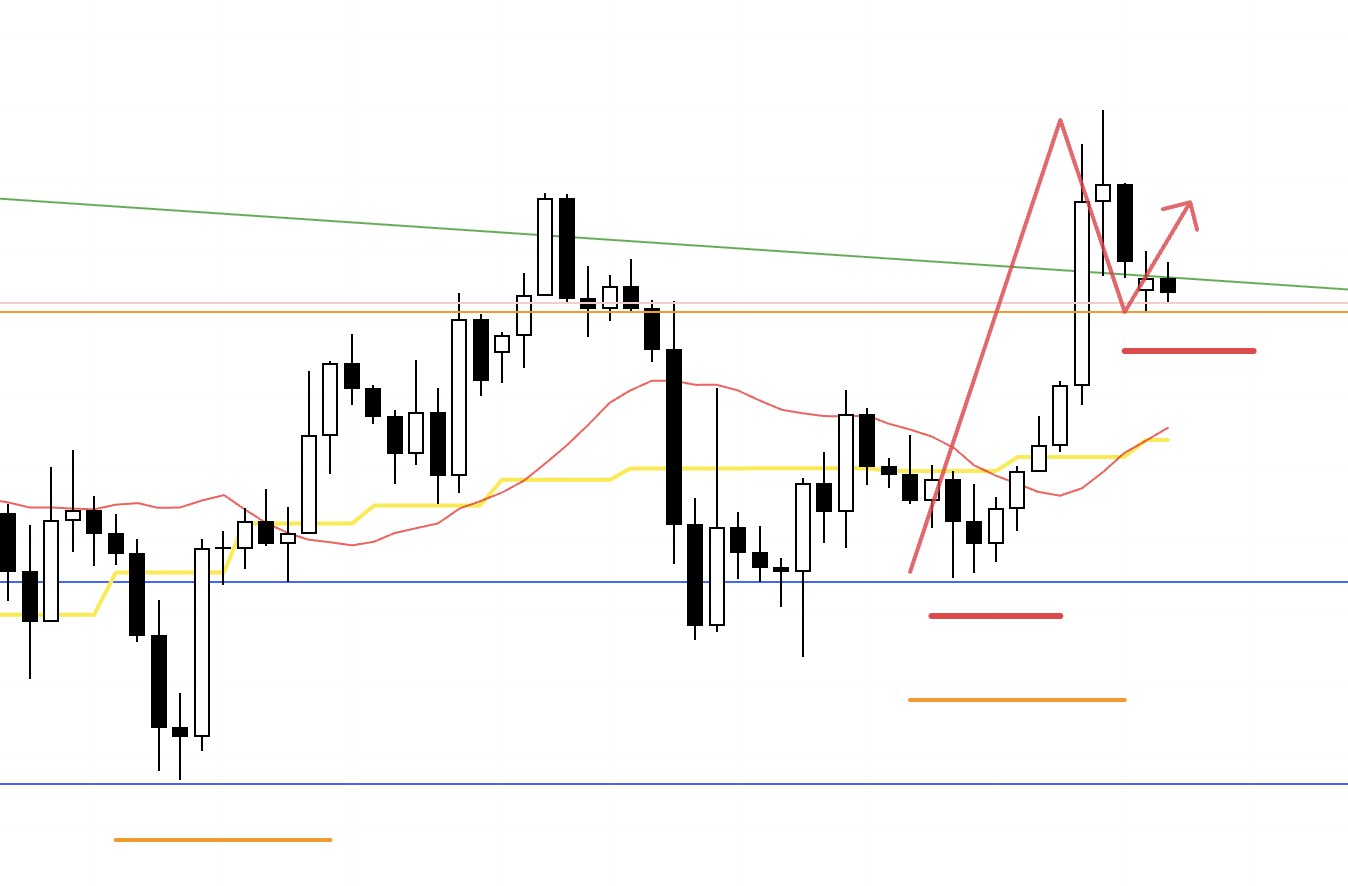
The week opened with a gap and gave us a pullback that reached into the 1h moving average, which made for an excellent entry location.
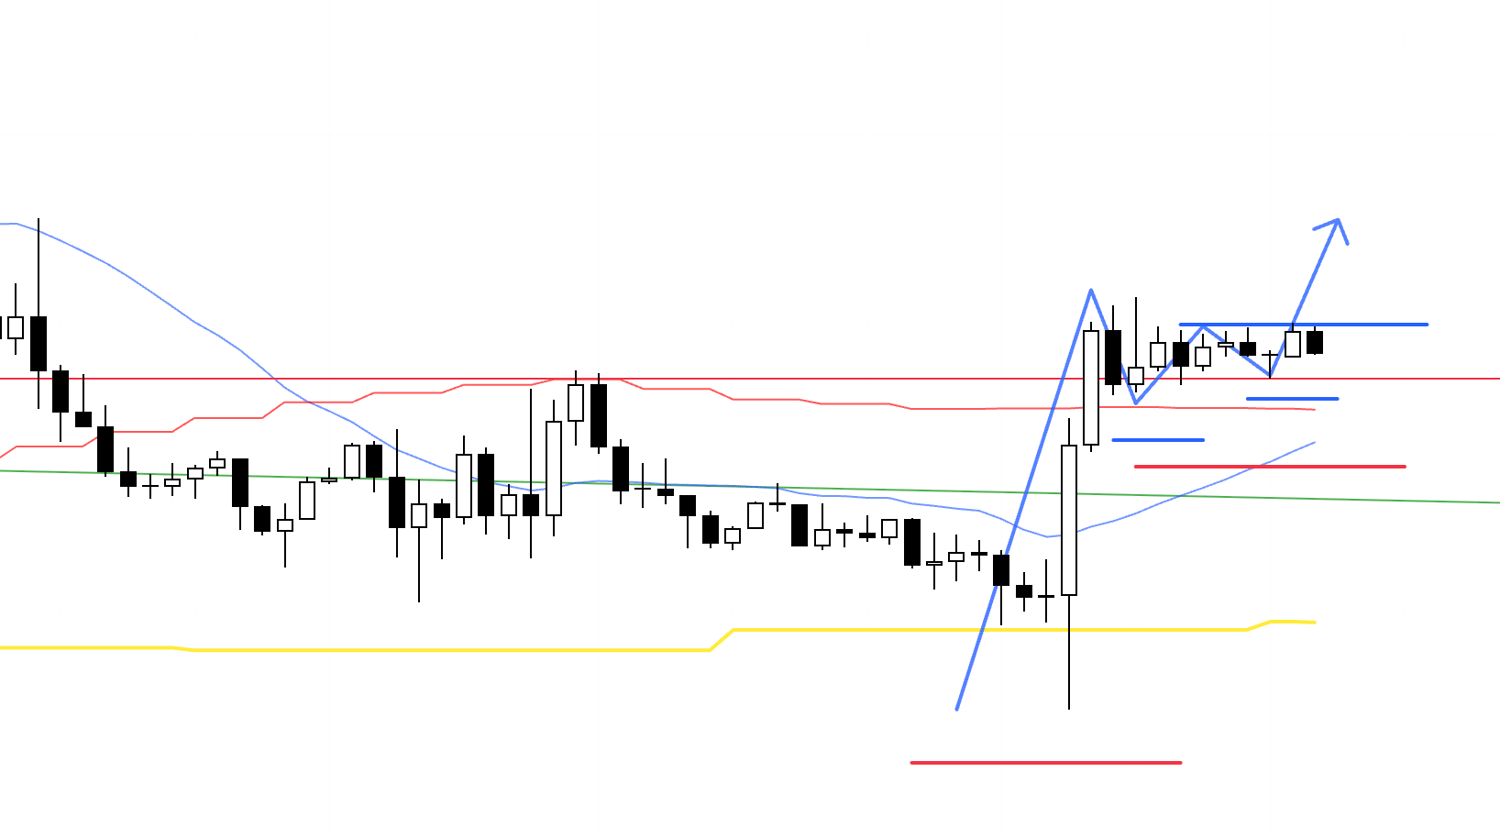
To confirm the supported line, let’s also look at a zoomed-out view.
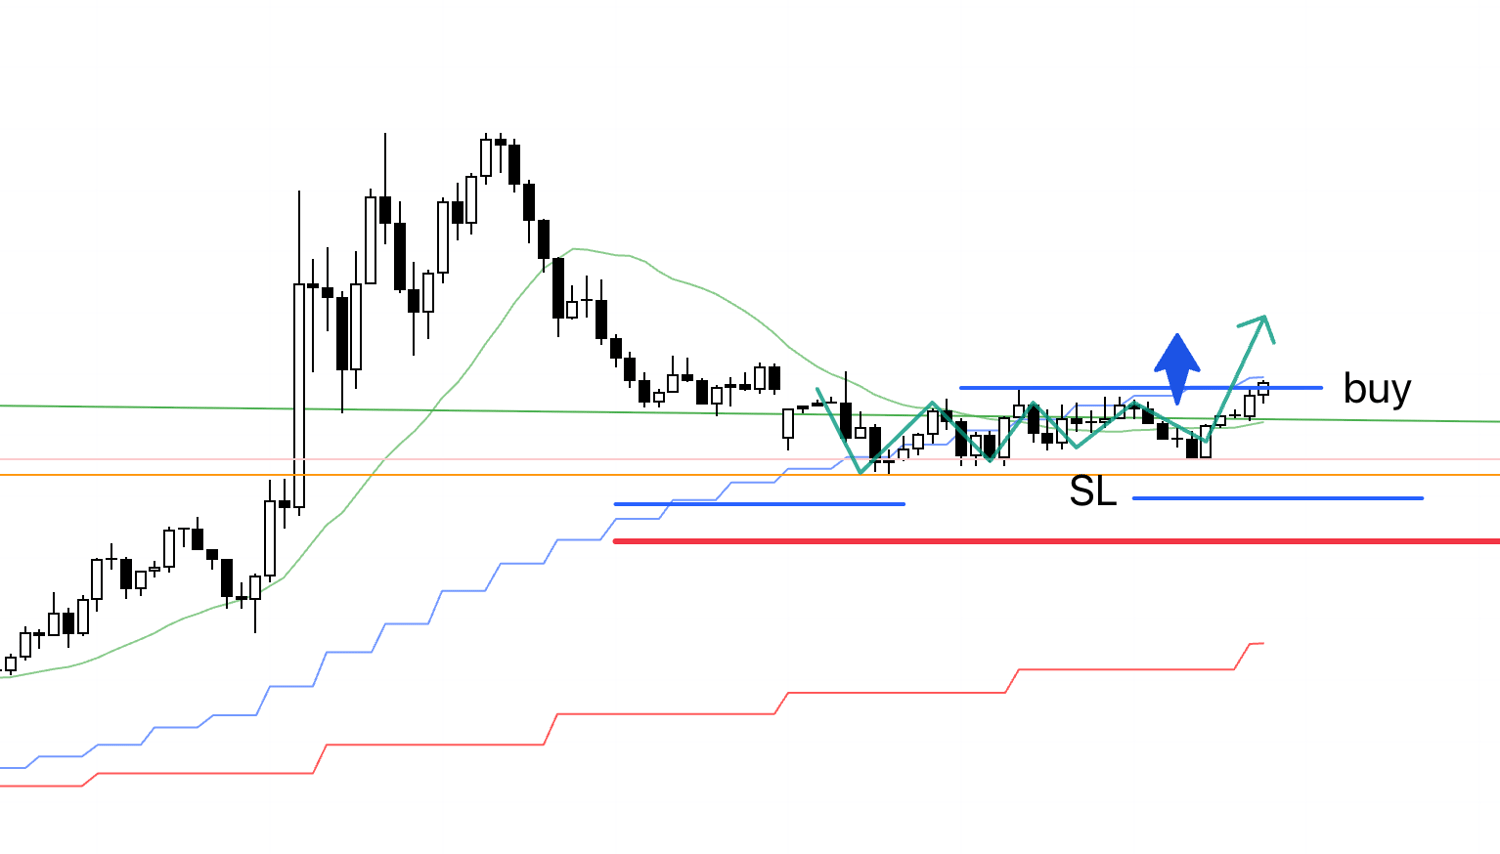
4h
On the zoomed-out 4h, you can see this supported line corresponds to the buyer–seller divider we watched in last week’s Trade Scenarios.
It sits slightly below the provisional line drawn last week, and because price has pierced it multiple times with wicks and it’s not very clean, I’m treating it as an area with some width rather than a pinpoint line.
Now let’s check the 1h chart.
1h
This is the first pullback within a new 4h uptrend, the first pullback after breaking the trendline, and there is ample room to the most recent weekly high, so this will be a 1h trade.
Let’s also look at the 15m.
15m
Here, the 15m breakout level and the 1h breakout level are the same.
Because the 15m dipped slightly below the most recent low, the 15m order is canceled, but the 1h low has not been taken out, so if price makes a new high, the 1h setup remains valid.
If that high breaks, I will trend-follow the 1h swing.
15m
Price cleared the high, so the entry order was filled.
This is shown on the 15m chart, but I will hold the position until the 1h trend breaks.
1h
On the 1h, the prior low has not been taken out, so this entry on the breakout is a trend-following trade riding the 1h swing.
1h
With a higher low in place, I raised the SL.
1h
After waking up, I raised the SL again.
1h
I raised the SL again.
I considered moving it up to the next higher low, but chose instead to raise it to a price level supported by the high/low structure and by the moving averages.
1h
When the 1h trend broke, the trailing stop was hit, and the trade closed.
〜・〜・〜・〜・〜・〜・〜・〜・〜・〜・〜・〜・〜・〜・
September 12 (Fri)
EURUSD
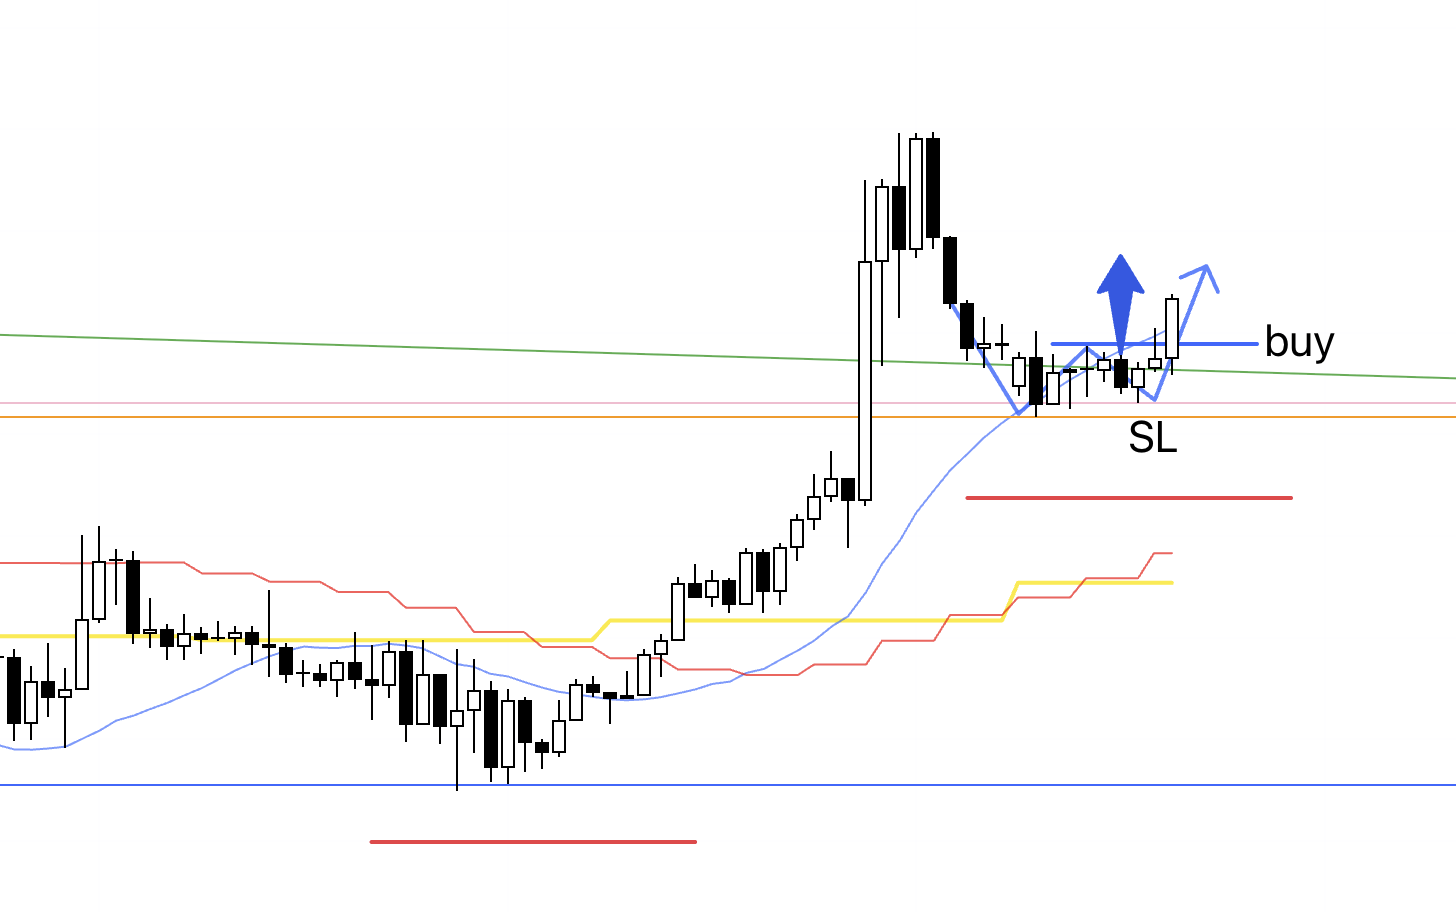
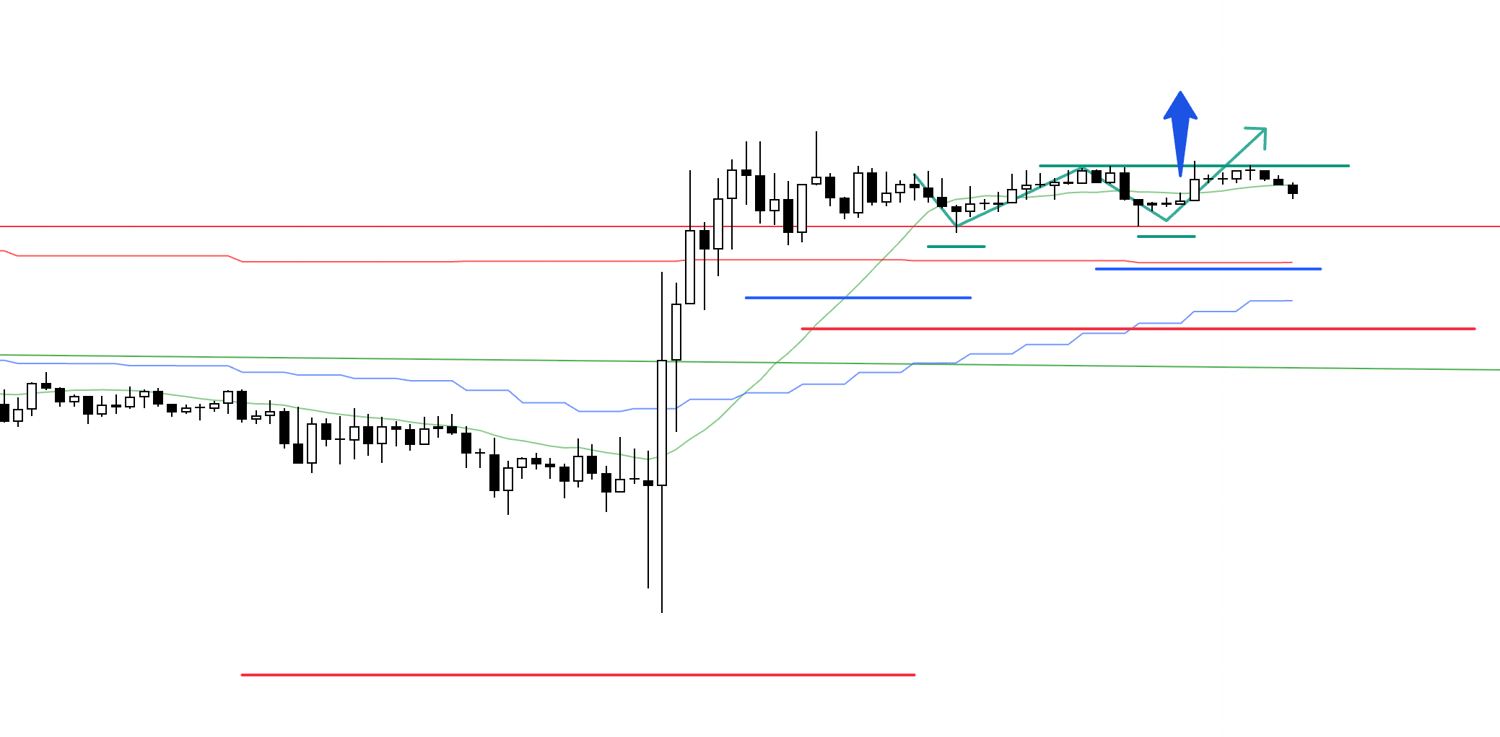
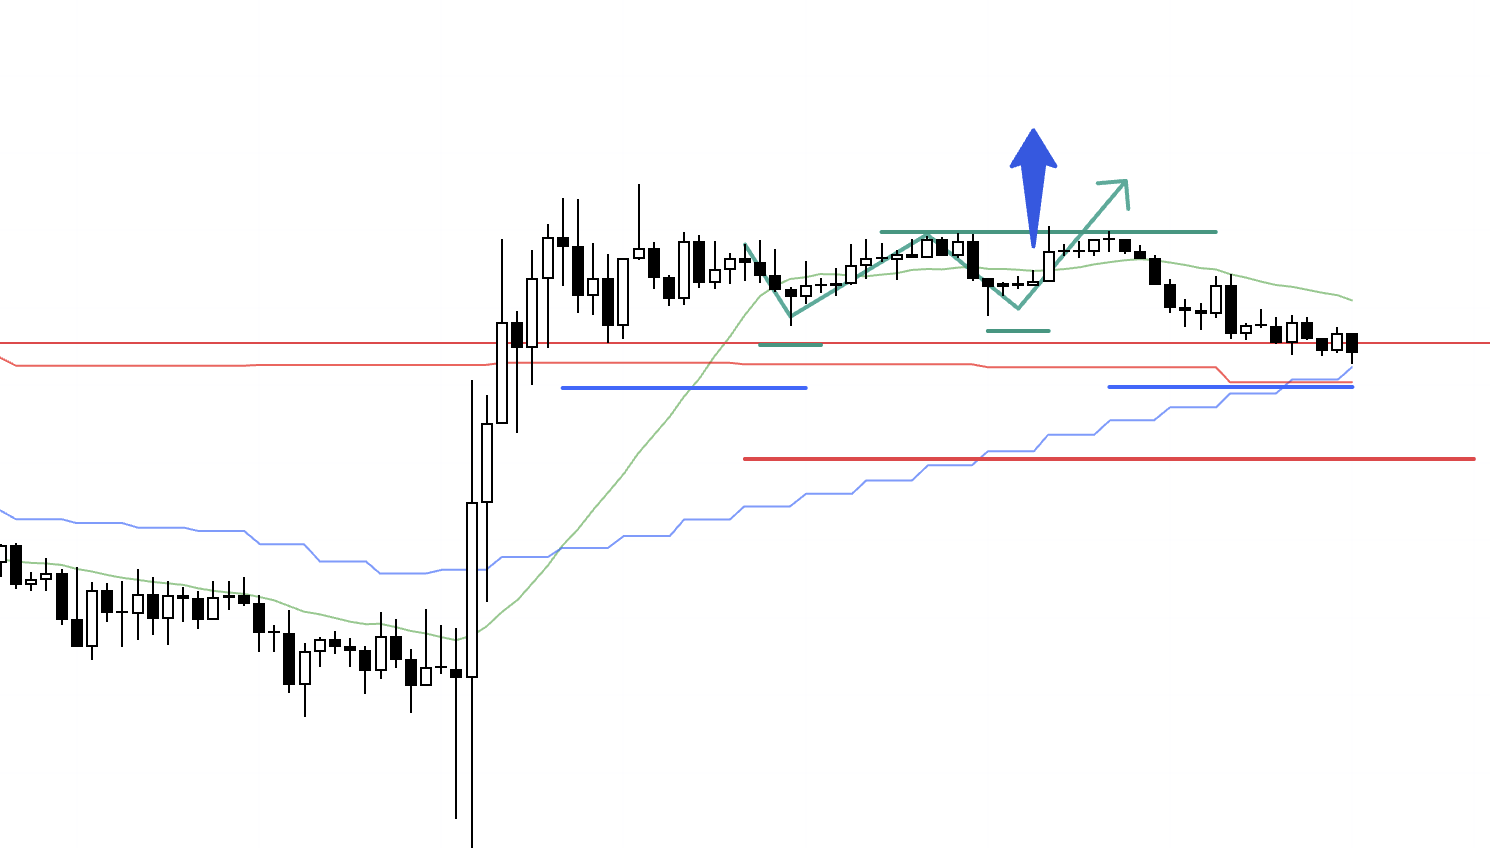
4h
On the 4h, price cleared the recent high, ending the short downtrend and forming a new higher-low area.
This is a spot to watch for a transition to an uptrend, and if that turn occurs, it allows a trade from one of the earliest points of the uptrend, an area with an upside edge.
The newly formed low is supported by the prior high’s line, and if we see a higher low from this point, it becomes a highly advantageous setup.
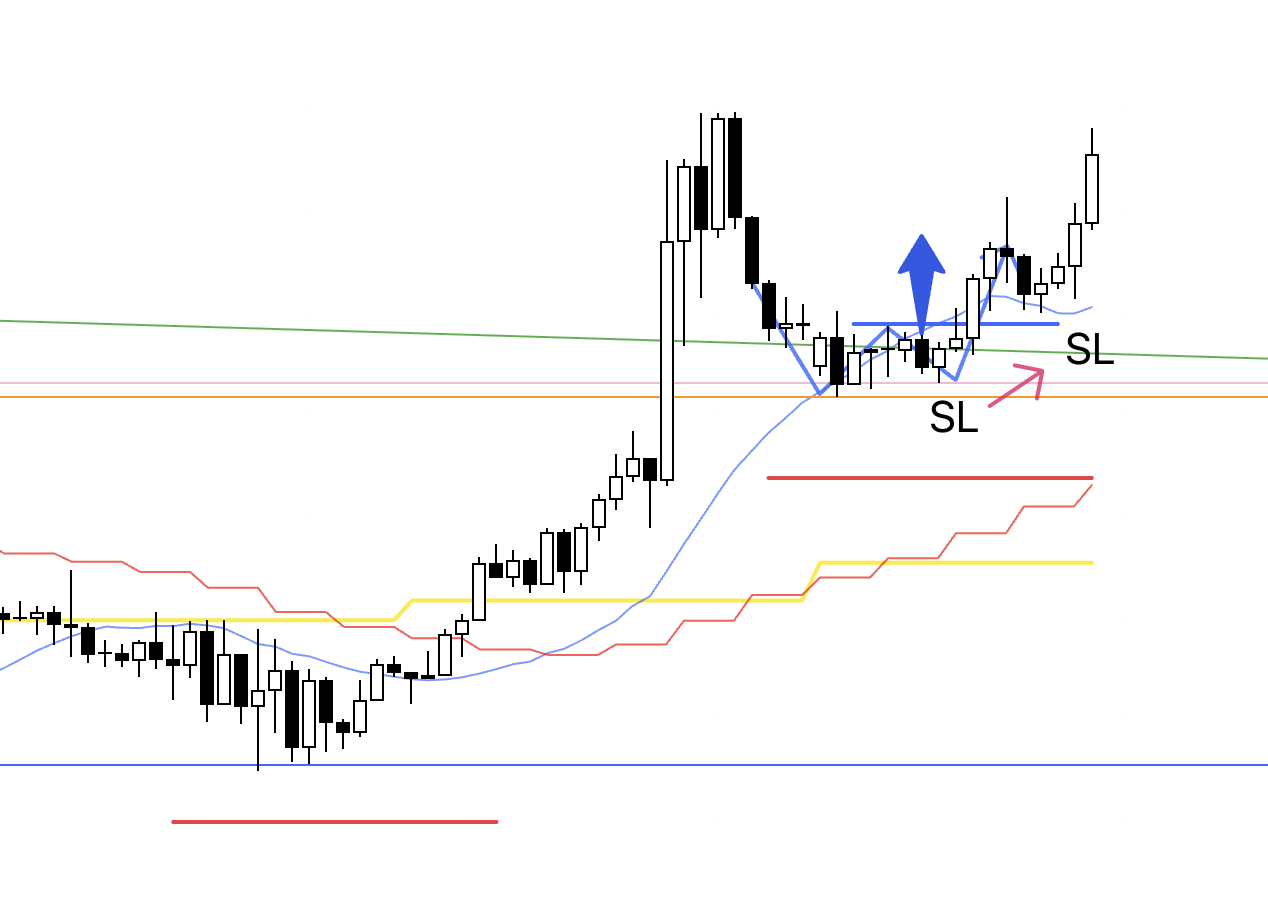
1h
On the 1h, taking out the recent high ended the downtrend and created a higher-low pivot.
A break above this high would confirm an uptrend transition, so I am planning an entry on that breakout.
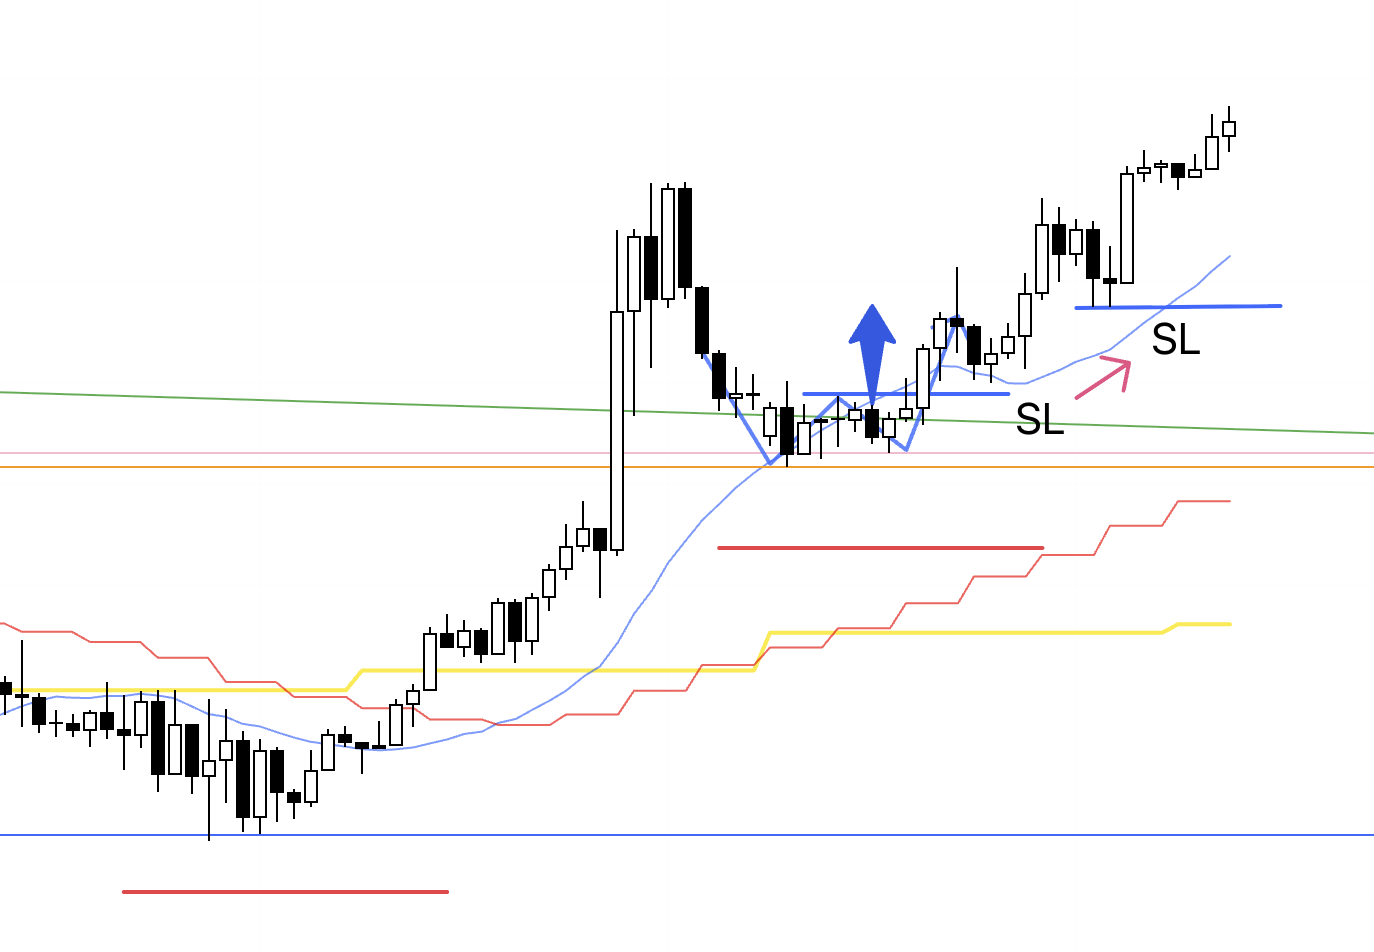
15m
On the 15m, the shape is identical to my usual setup.
The 15m breakout level and the 1h breakout level are the same.
Because the 1h is a bit extended from its MA, I will execute the trade on the 15m.
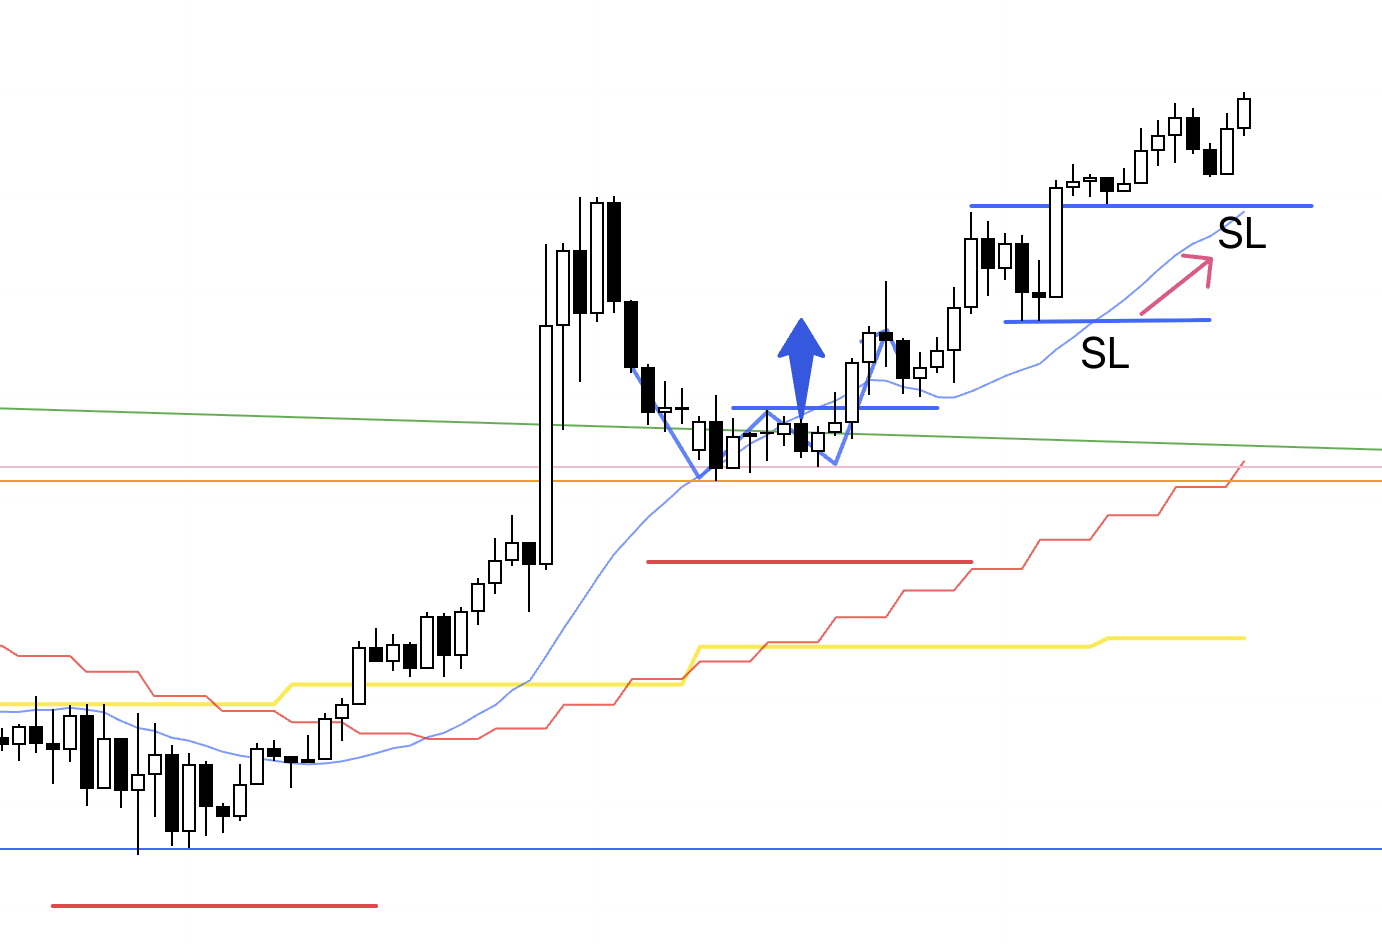
15m
Price broke the low, invalidating the setup, so the order was canceled and I stood aside.
〜・〜・〜・〜・〜・〜・〜・〜・〜・〜・〜・〜・〜・〜・
That is all for this week.
Once again USDJPY could not break out of its range, so I had no trades there.
What matters is not forcing a trade, but being willing to wait as long as it takes.
By waiting for only those areas with edge and trading only there, the edge has a chance to express itself.
Do not contaminate the sample size you are building.
Even if this month is sparse and next month is too, opportunities will come around.
Don’t fixate on a couple of months.
Keep your eyes on the next year and beyond, and keep repeating rule-based actions.
I hope some part of this was helpful.
This content is provided solely for educational purposes.
It does not instruct you to buy or sell, nor does it guarantee future profits.
You are solely responsible for any trades you undertake, so take the time to build your own strategy and testing, and trade at your own risk.
I hope the consistency of my trading helps you pursue consistency in your own trading.