

Hello.
I am laying out my Trade Scenarios for the coming week.
I post this Trade Scenarios blog every Sunday.
And every Saturday I publish a Weekly Trade Report detailing how I thought through and executed my trades over the prior week.
Read alongside these Trade Scenarios, the Weekly Trade Report gives you a consistent, operational view of how I form a plan in advance, what I wait for, and how I execute.
I believe it can serve as a practical reference for a real-world, end‑to‑end process.
For the underlying strategy, please see my posts on Dow Theory and multi‑timeframe analysis.
A scenario is not a forecast.
It is not a prediction but a conditional plan: “if X happens, I will do Y.”
I do not predict markets, and these are not that.
Please understand this up front.
This is not an instruction to buy or sell, nor is it a signal service.
It does not guarantee future profits.
It is provided for educational purposes, using my own consistent process as the example.
I cannot be responsible for any outcomes of your trades, so please trade at your own risk.
Let’s start with USDJPY.
(On my charts, line colors denote the timeframe: orange for Daily, red for 4h, blue for 1h, and green for 15m.)
〜・〜・〜・〜・〜・〜・〜・〜・〜・〜・〜・〜・〜・〜・
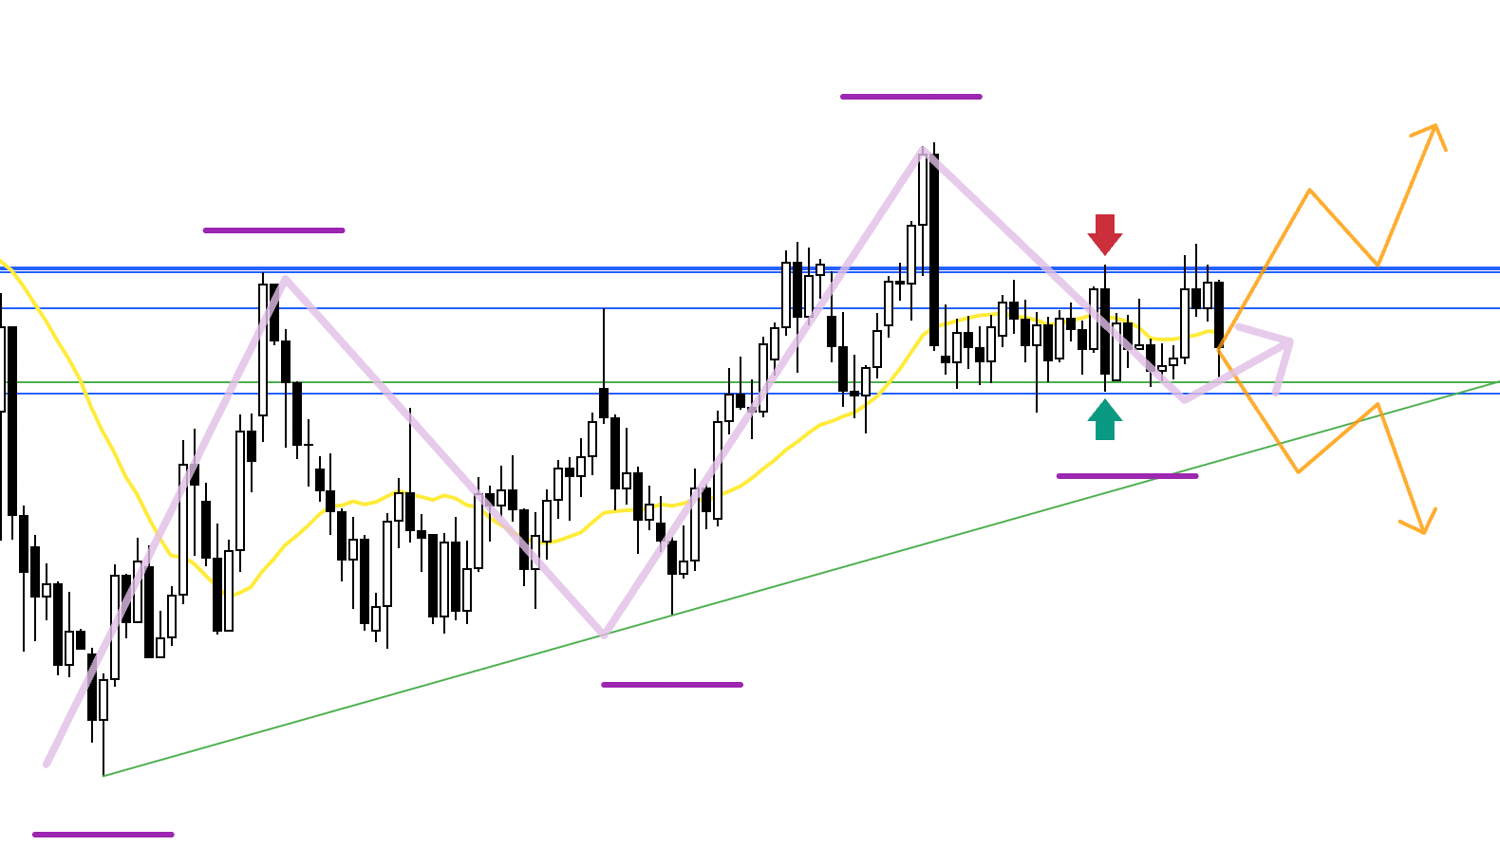
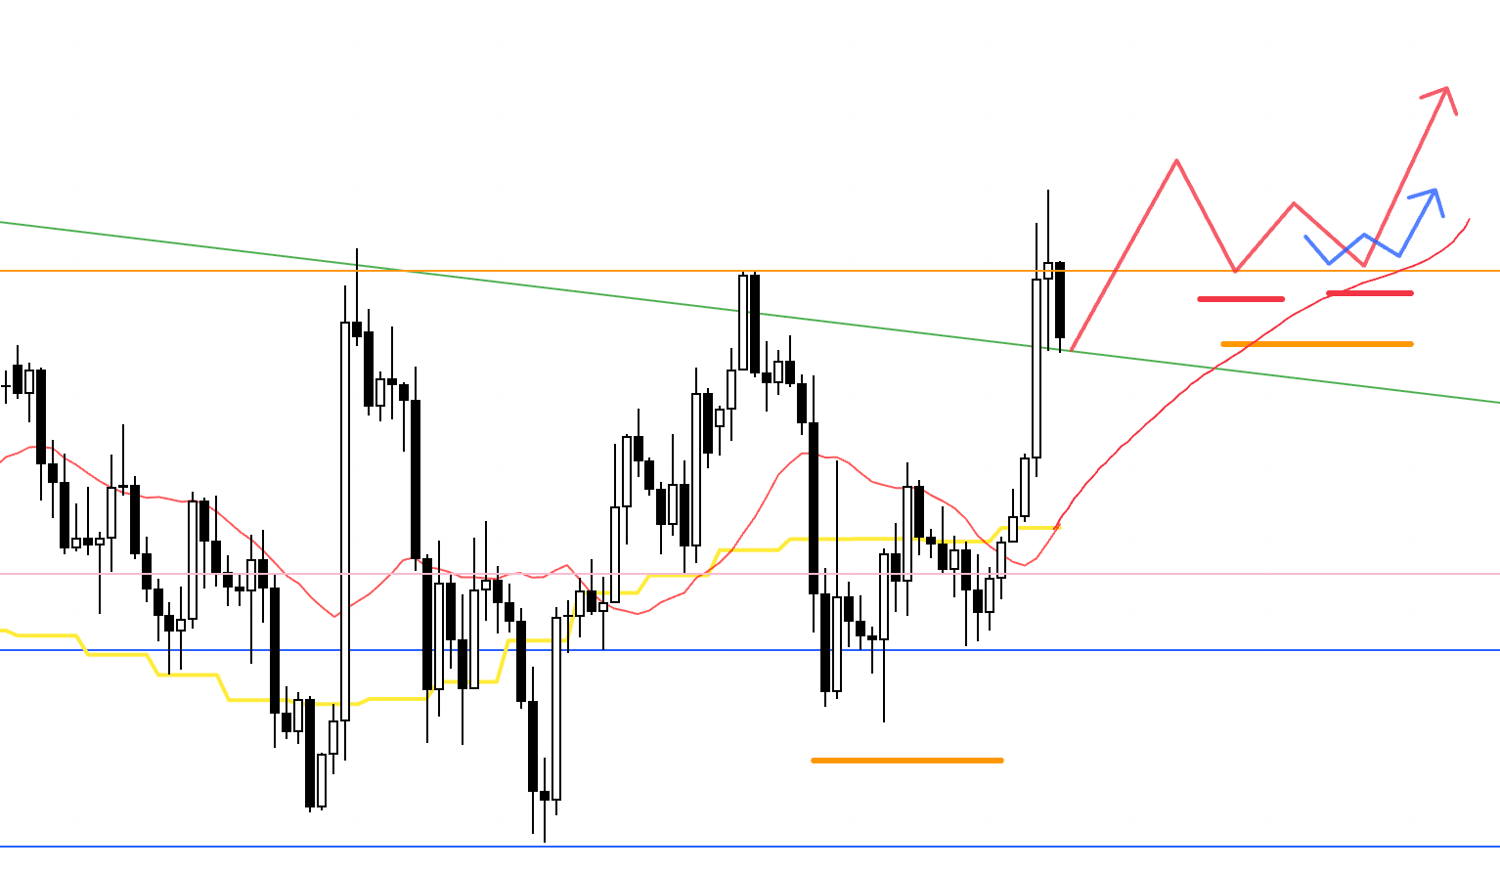
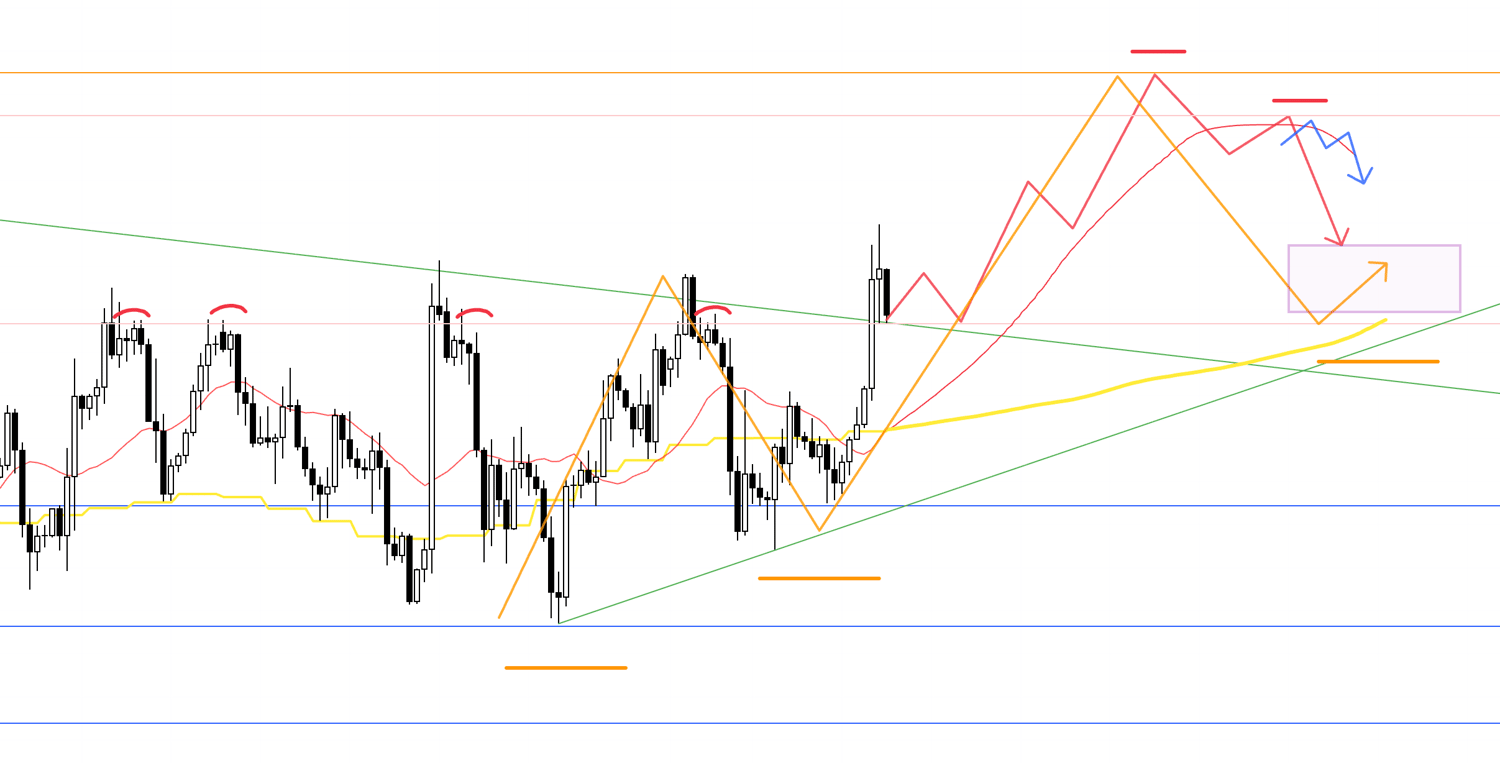
USDJPY
Daily

Little has changed since last week.
On this Daily chart, the purple arrows and lines overlay the Weekly structure.
The Weekly is an uptrend pullback with higher lows, while on the Daily price has neither managed to print lower lows to extend the decline nor break through overhead resistance, leaving bulls and bears in stalemate.
Same as last week, when price is compressed between buyers and sellers like this, the base plan is to wait for a decisive range break and then consider trades only after the resolution.
As indicated by the orange arrows, I want to buy only after a break and subsequent support hold, and sell only after a break and subsequent rejection, respectively.
With that in mind, let’s look at the 4h.
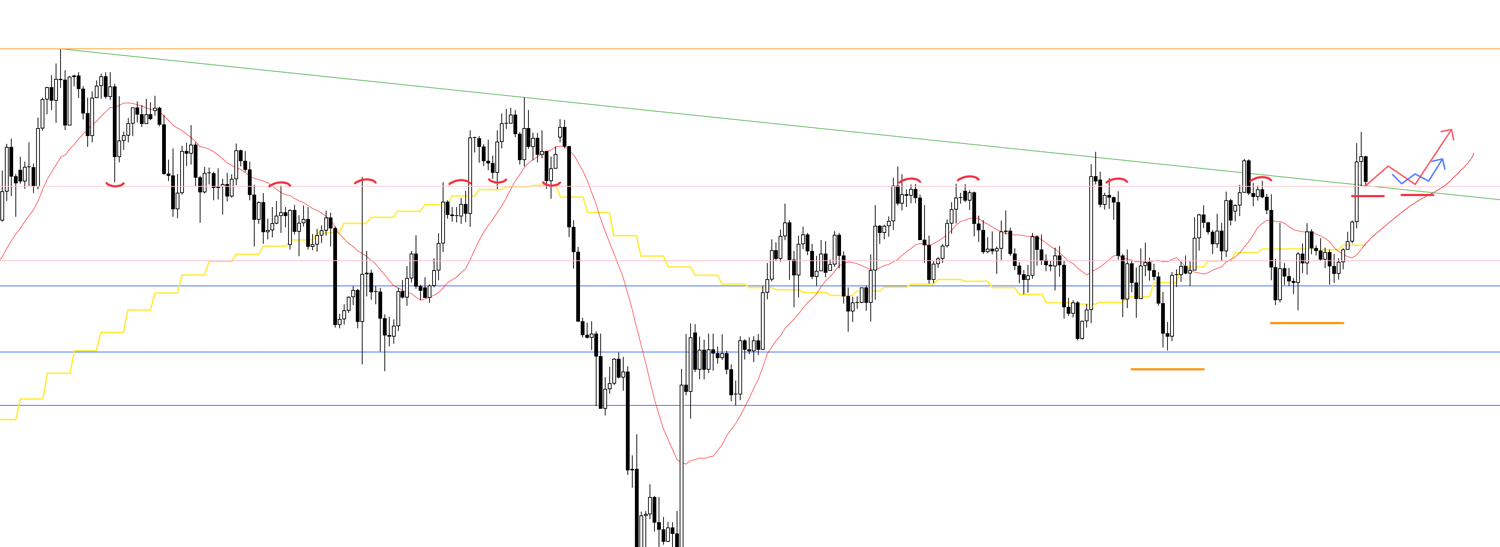
4h
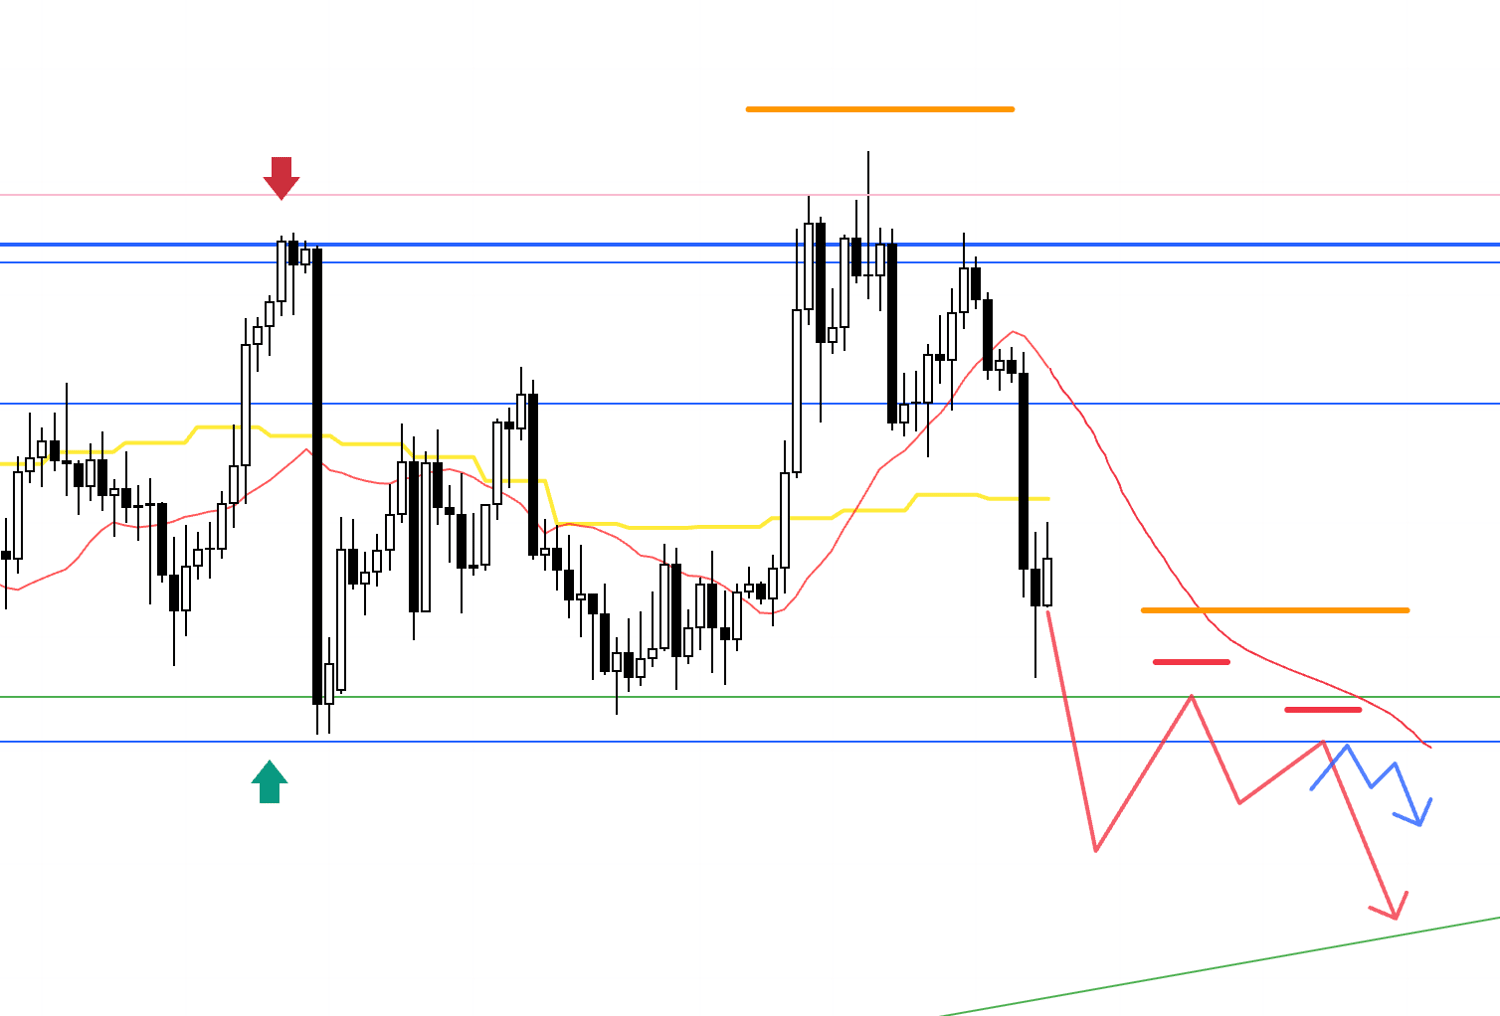
This remains largely the same as last week.
If price breaks below the lower support, then gets capped on a retest as that line flips to resistance while carving out a lower high, I will consider entries on lower timeframes.
In that case, the key is whether there is sufficient room to the Weekly trendline and similar reference levels to meet risk‑reward requirements, and I would manage risk accordingly, for example by banking partial profits on a trendline touch.
4h
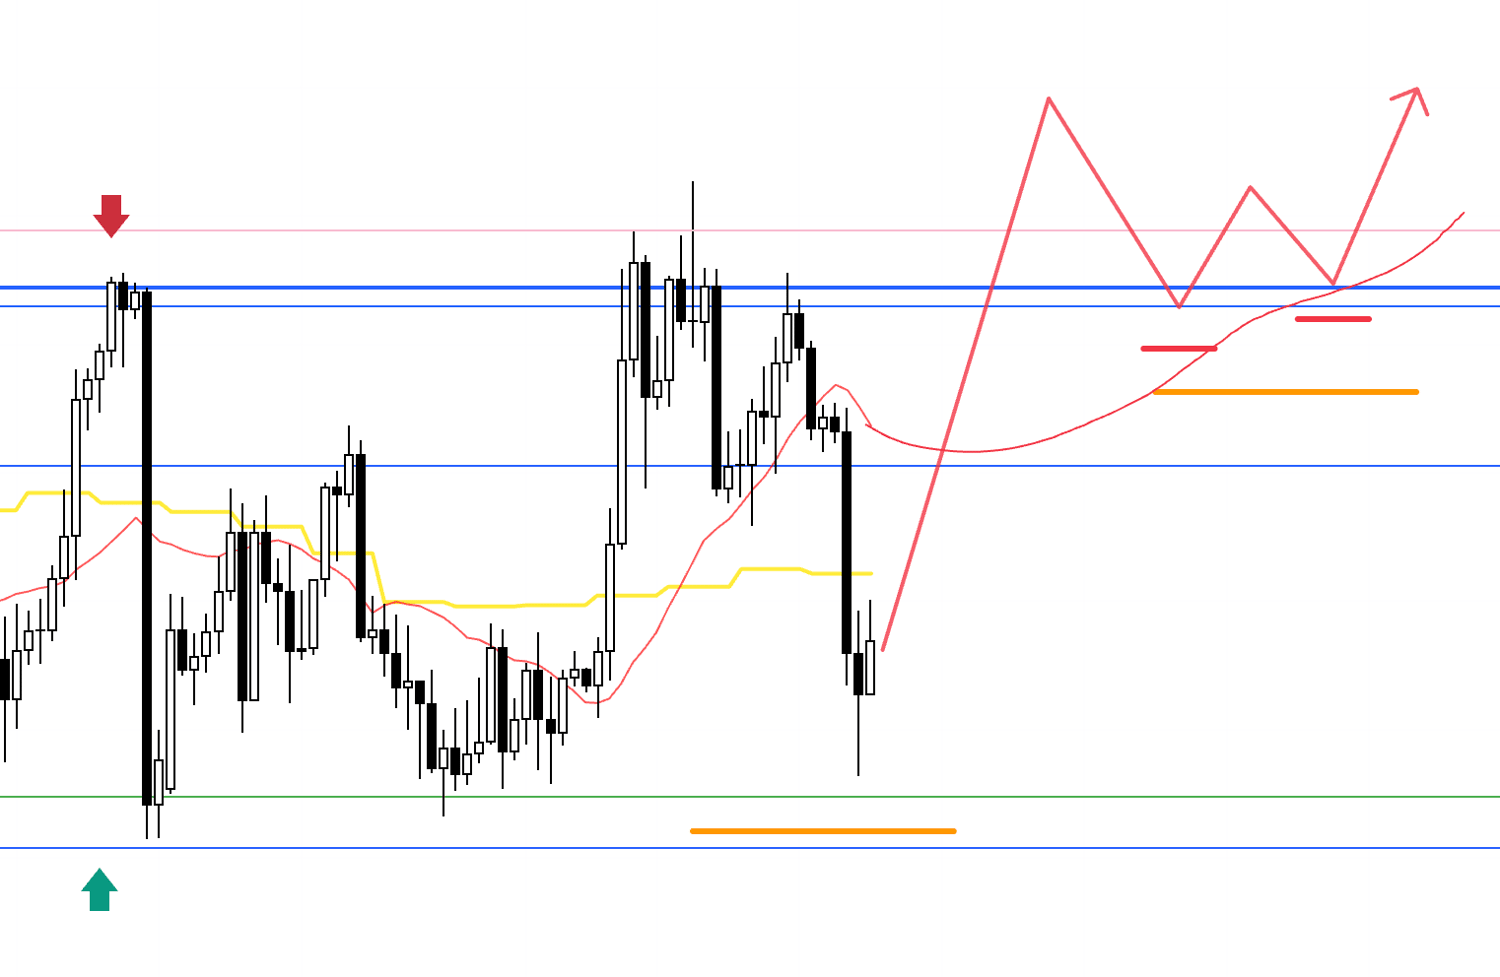
Conversely, if the higher resistance flips to support with a clear higher low, I will look for entries on lower timeframes.
I cannot know how the path between here and there will evolve, but for USDJPY the first priority is seeing which side the range resolves.
I will then act accordingly.
Now to EURUSD.
〜・〜・〜・〜・〜・〜・〜・〜・〜・〜・〜・〜・〜・〜・
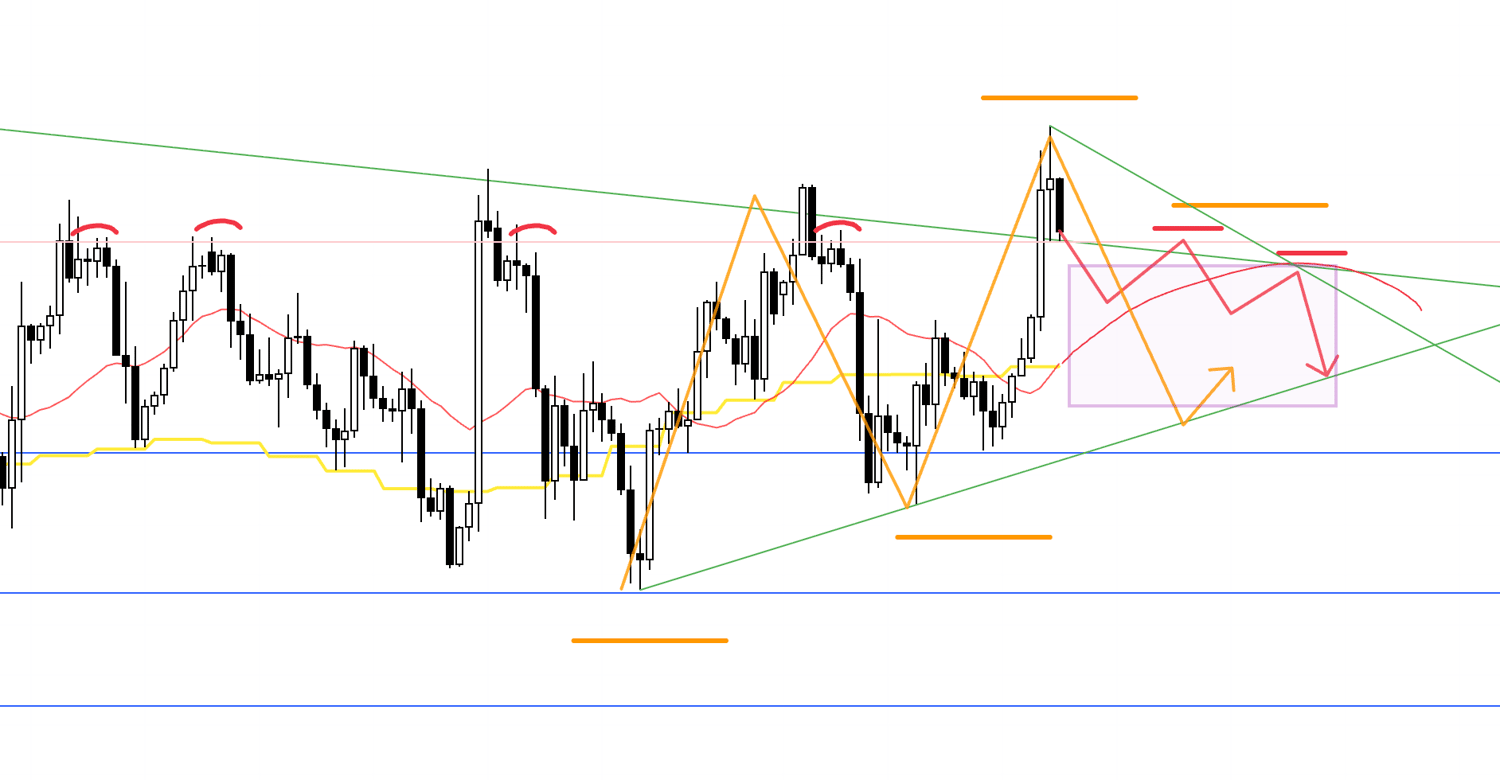
EURUSD
Daily
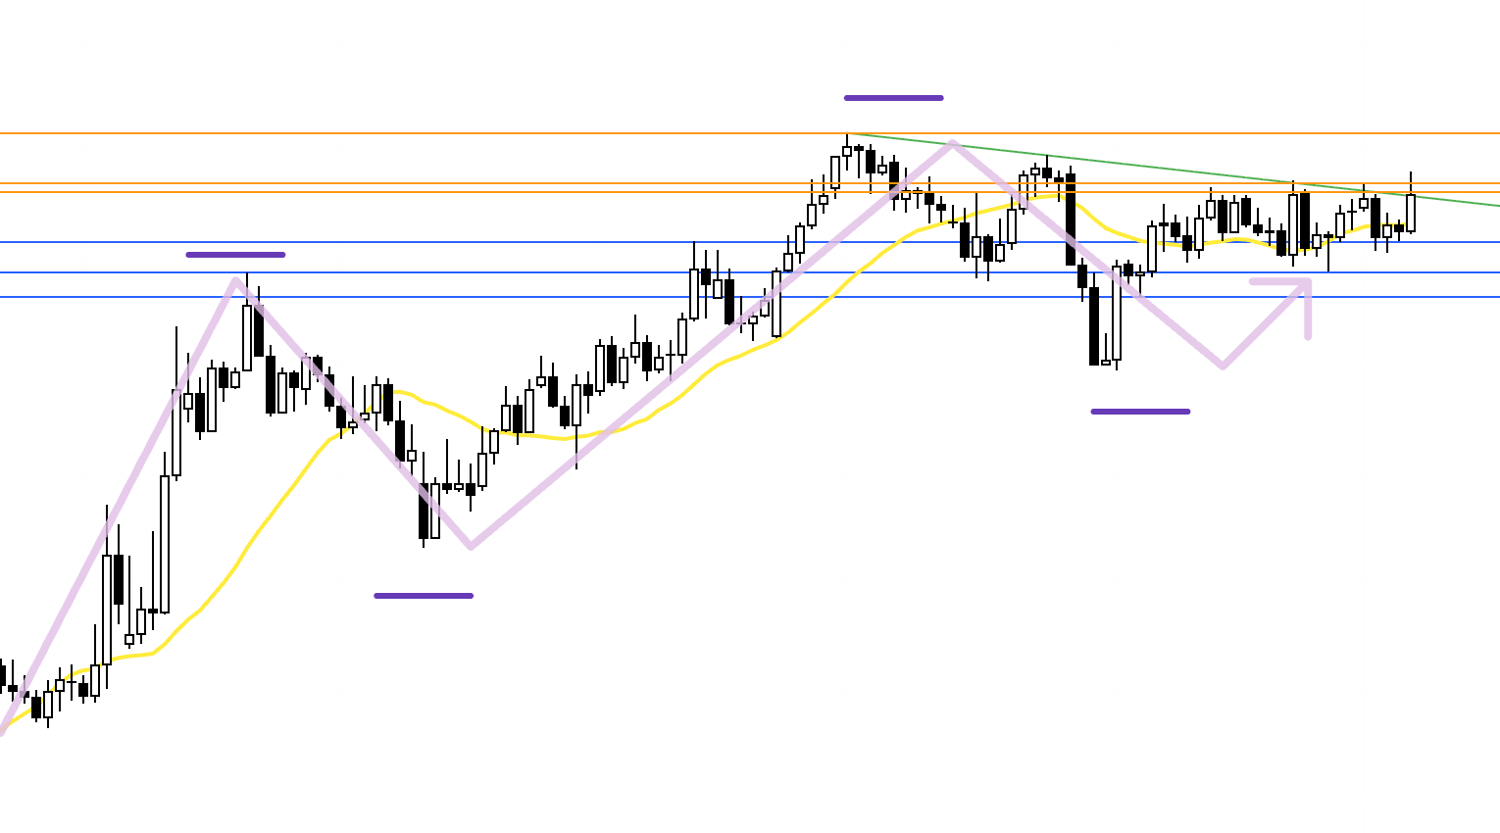
I overlaid the Weekly structure in purple on the Daily chart.
The Weekly sits in a pullback buy area, yet recently we have lower highs forming along the green trendline, and repeated topside rejections have kept the upside heavy.
That does not automatically mean it will fall.
Because it is a Weekly pullback buy area, the blue support region is prone to Weekly dip buying, and EURUSD, like USDJPY, has been moving into a range‑like posture.
If selling, be mindful of those blue support lines.
If buying, repeated caps argue for waiting for a clear topside break.
With that in mind, here is the 4h.
4h
If price takes out the capped highs and then forms a pullback that holds around the prior high, I will consider longs on lower timeframes.
4h
We have also broken above the green trendline, and the current low has stalled at the pink line that has been in play for some time.
If price forms another higher‑low pivot off that line, and lower timeframes print a double bottom or similar that rejects prices beneath it, I will consider buying.
4h
Alternatively, if the pink line caps price and we end up with another lower high, that could justify a short on lower timeframes as a Daily lower‑high setup.
However, the Daily has also been lifting its lows, creating converging price action, so risk‑reward becomes the critical filter.
The orange arrows depict the Daily flow.
When highs are lowering while lows are lifting, buy and sell orders tend to clash and price can turn choppy.
This area carries elevated risk, so be mindful of risk‑reward and let the setups dictate the decision.
4h
If price later extends higher, the next switch to a short bias would be if Weekly highs cap the move and 4h prints a lower‑high pivot with moving averages rolling over and capping from above.
In that case I will consider shorts on lower timeframes.
There are several caveats here.
Please see the next point.
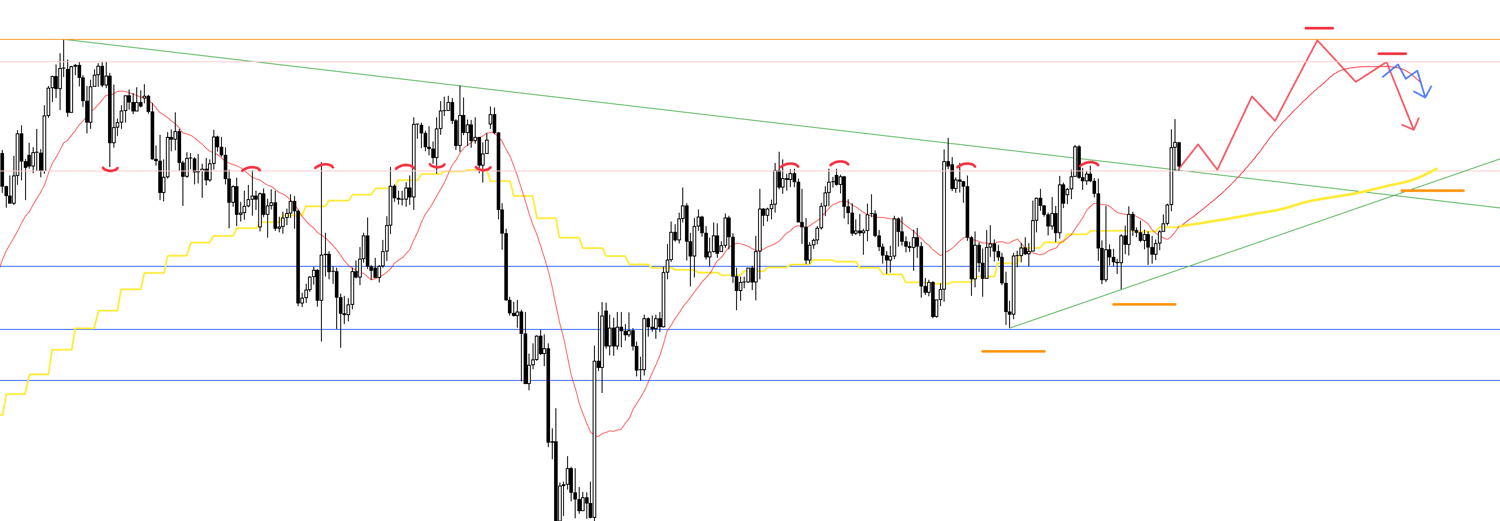
4h
The orange arrows reflect Daily action.
If the Daily takes out prior highs, that confirms a Daily uptrend and likely attracts “buy the dip” flows.
With the green trendline and the Daily MA (yellow) providing support from below, the pink boxed area, for example, would carry increased dip‑buying risk, so the key is whether we get a chance to sell from elevations where risk‑reward remains attractive.
In that context, any 4h downtrend would merely be “a pullback to form a Daily higher low,” and trades should be framed with that in mind.
4h
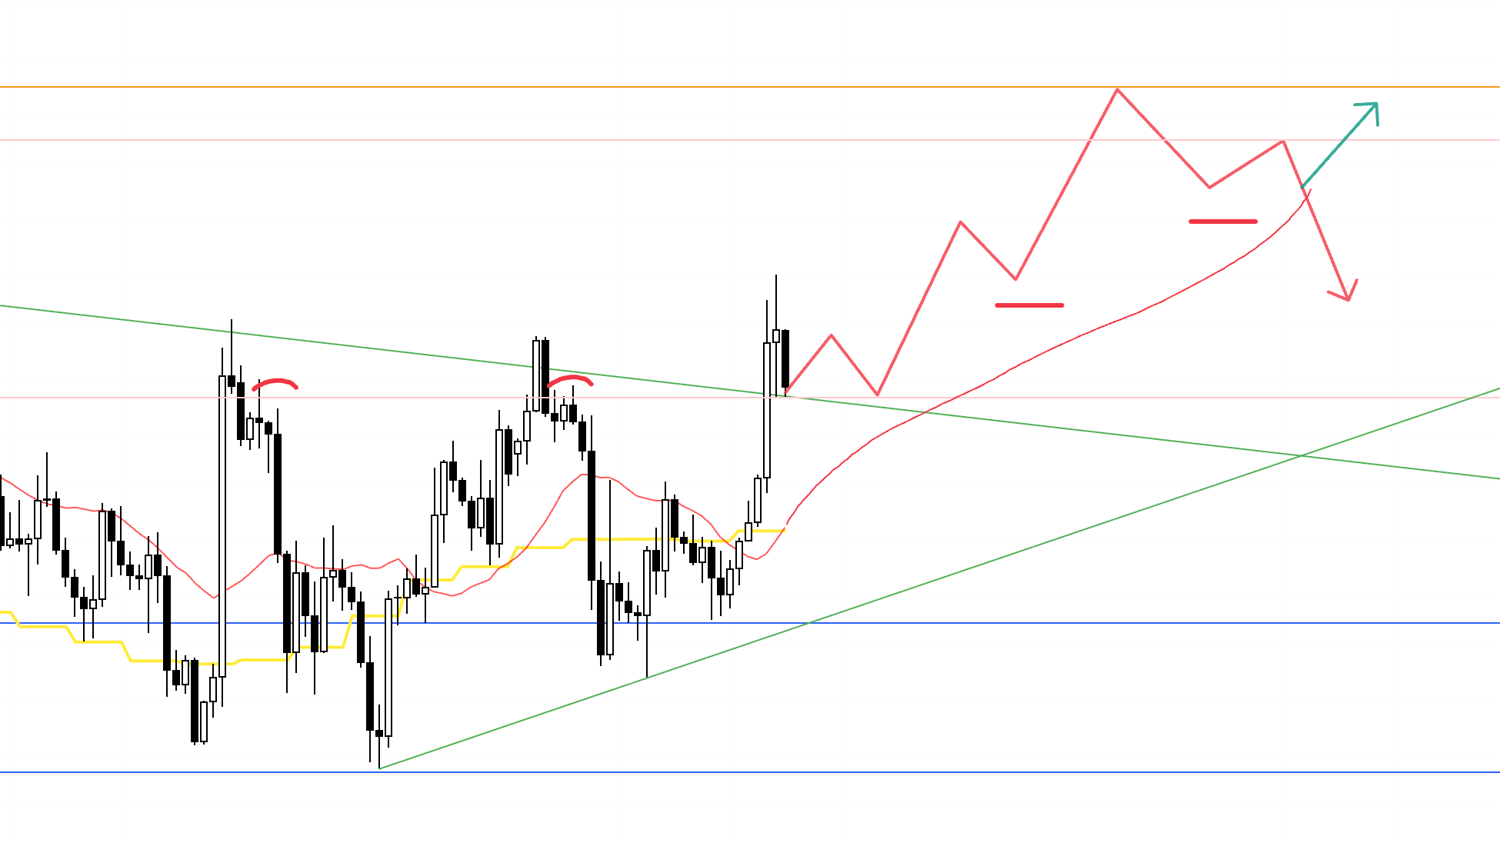
At any 4h lower‑high pivot, the relationship with the moving average (red) matters a great deal.
If the MA is still supporting from below, even after a 4h lower high, the lows have not broken and dip‑buyers will still be active as indicated by the green arrow.
Naturally, such pullbacks are also where I would consider buying.
That is why it is essential to judge the context in which a 4h lower‑high forms.
〜・〜・〜・〜・〜・〜・〜・〜・〜・〜・〜・〜・〜・〜・
That is all for now.
These are my current scenarios, and I will update or rebuild them as the week unfolds and price reveals more information.
What matters most is risk awareness.
If you follow my weekly scenario building, you will see that I watch the market across multiple timeframes and try to identify who is likely trading where, on which timeframe, and with which orders.
This allows me to map where risks may be hiding on the chart.
By doing so, I avoid “high‑risk regimes” where buy and sell flows are balanced and price turns erratic, and I focus instead on repeating trades only at locations that are favorable to me.
USDJPY has been ranging for a while, but the point is not to predict which way it will break.
That is gambling pure and simple.
I do not care which way it breaks.
Whichever way it goes, I will align with the subsequent move and trade only at the most favorable points.
It is also a mistake to get anxious about “fewer opportunities lately” and take trades that are not in your rules or in your scenarios.
Wait relentlessly for setups with an edge, and keep repeating only those trades.
That consistency is crucial.
I hope this was helpful.
These Trade Scenarios are my personal plans.
If your own approach is not yet fixed, feel free to use them as a reference for building your strategy, but if your trading is already well‑defined, please do not let my plan distract you from your own rules.
Thank you for reading to the end.