


I will review the key points of this week’s trading, focusing on the trades I actually executed.
This Weekly Trade Report is posted every Saturday.
If you read it together with the Trade Scenarios I post every Sunday, you can see how I think in advance and how I execute trades based on those scenarios in real time.
This Weekly Trade Report is planned to become a paid product, but I am still preparing to upgrade it into a more comprehensive offering and need a little more time.
I am sorry for the repeated delays, but for now I will continue to publish this Weekly Trade Report for free, and I hope it helps your trading in some way.
This is not advice on “how you should trade,” nor am I claiming this is the correct answer.
It is not about showcasing individual wins or losses, nor is it a recommendation of any particular strategy based on those results.
It is to demonstrate, at an operational level, how I repeatedly follow a consistent process based on a preplanned scenario, so you can use it as a reference for building your own strategy and for maintaining your own process consistency.
The results are solely my personal outcomes and do not guarantee your future profits.
Please keep that fully in mind and make sure you conduct your own testing and preparation, and take full responsibility for your own trading.
I trade pullback buys and rally sells on the 4h timeframe.
For my pullback buy and rally sell approach, please read my past blog posts on Dow Theory and multi-timeframe analysis.
Please see the charts below.
USDJPY 4h

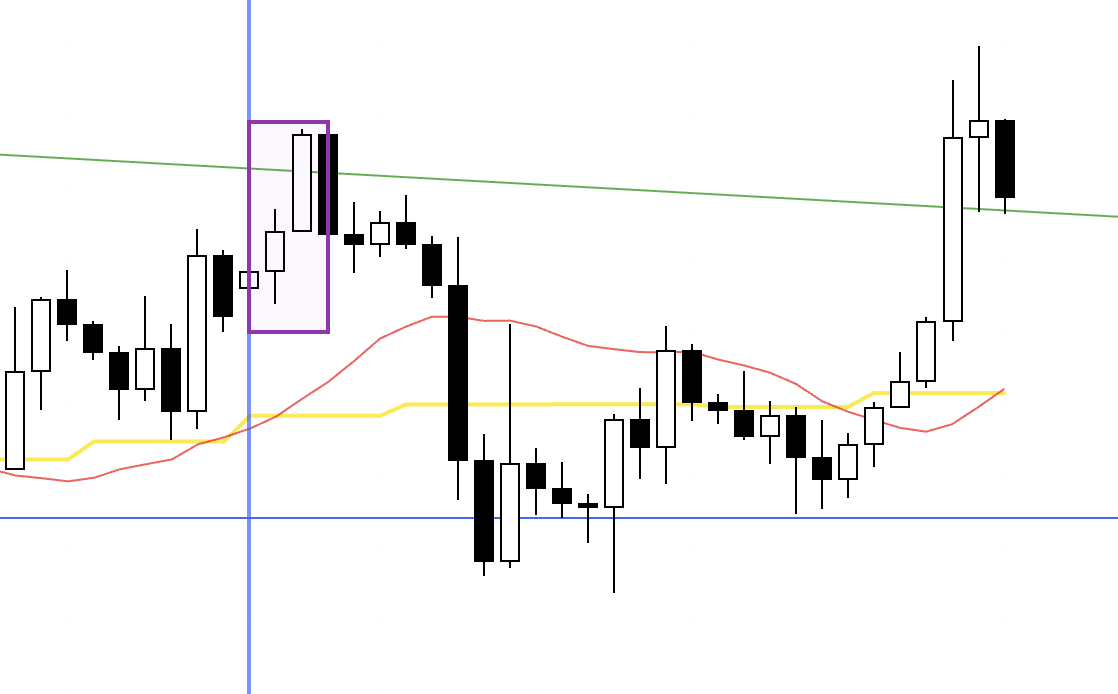
This is the USDJPY 4h chart.
This week’s action is the portion to the right of the blue vertical line shown on the chart.
As with last week, price failed to break out of the range, and there were no points in USDJPY that met my criteria to consider a trade.
Next, please see the EURUSD chart below.
EURUSD 4h
This is the EURUSD 4h chart.
There was one point this week where a trade in EURUSD was worth considering.
This point aligned with the buy scenario outlined in last Sunday’s scenario blog, but I will explain it again here.
〜・〜・〜・〜・〜・〜・〜・〜・〜・〜・〜・〜・〜・〜・
September 1 (Mon)
EURUSD
4h chart from last Sunday’s scenario blog
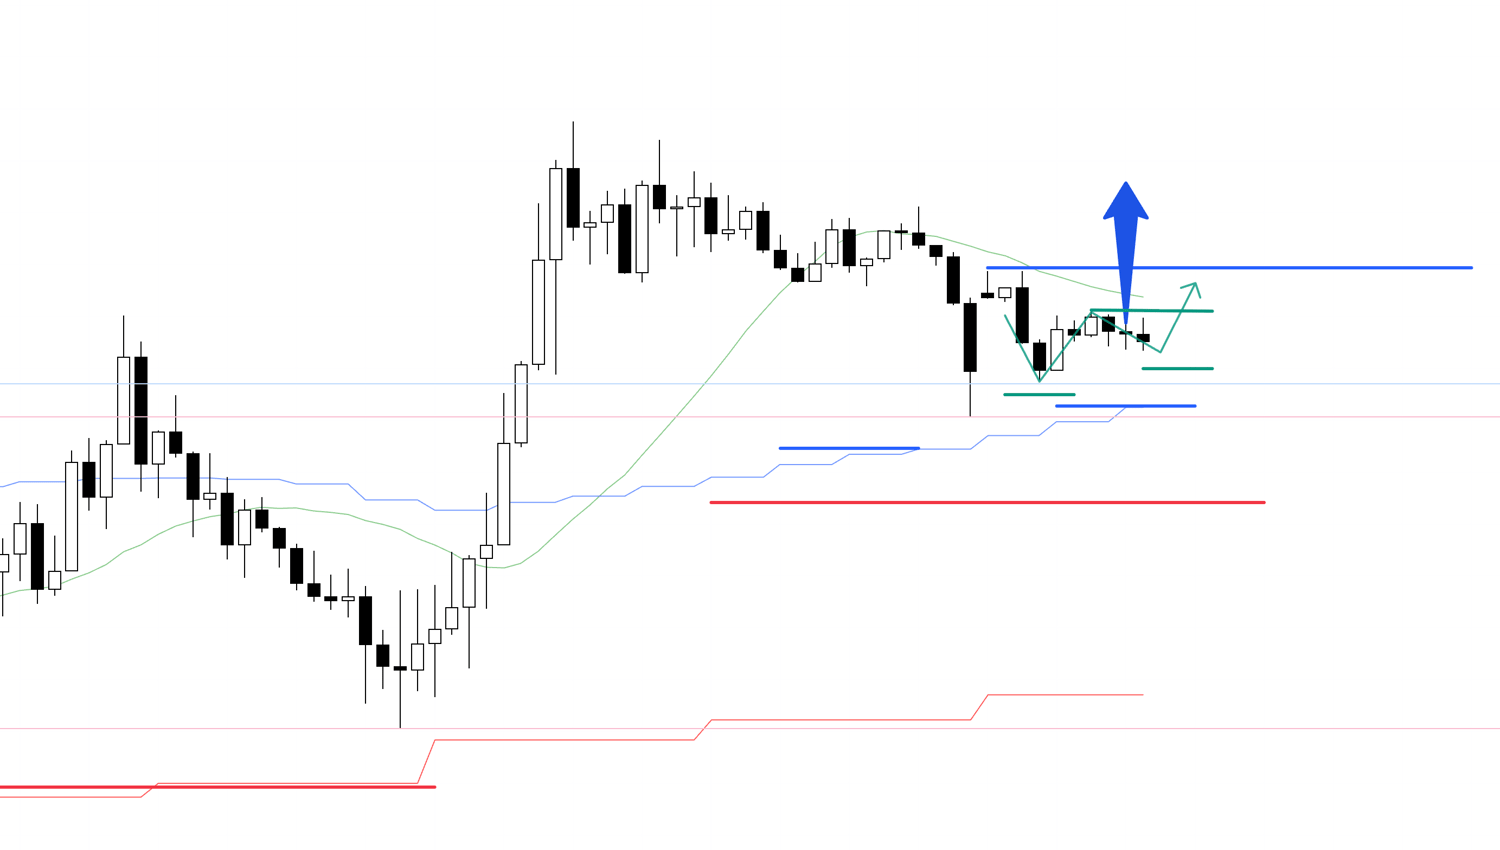
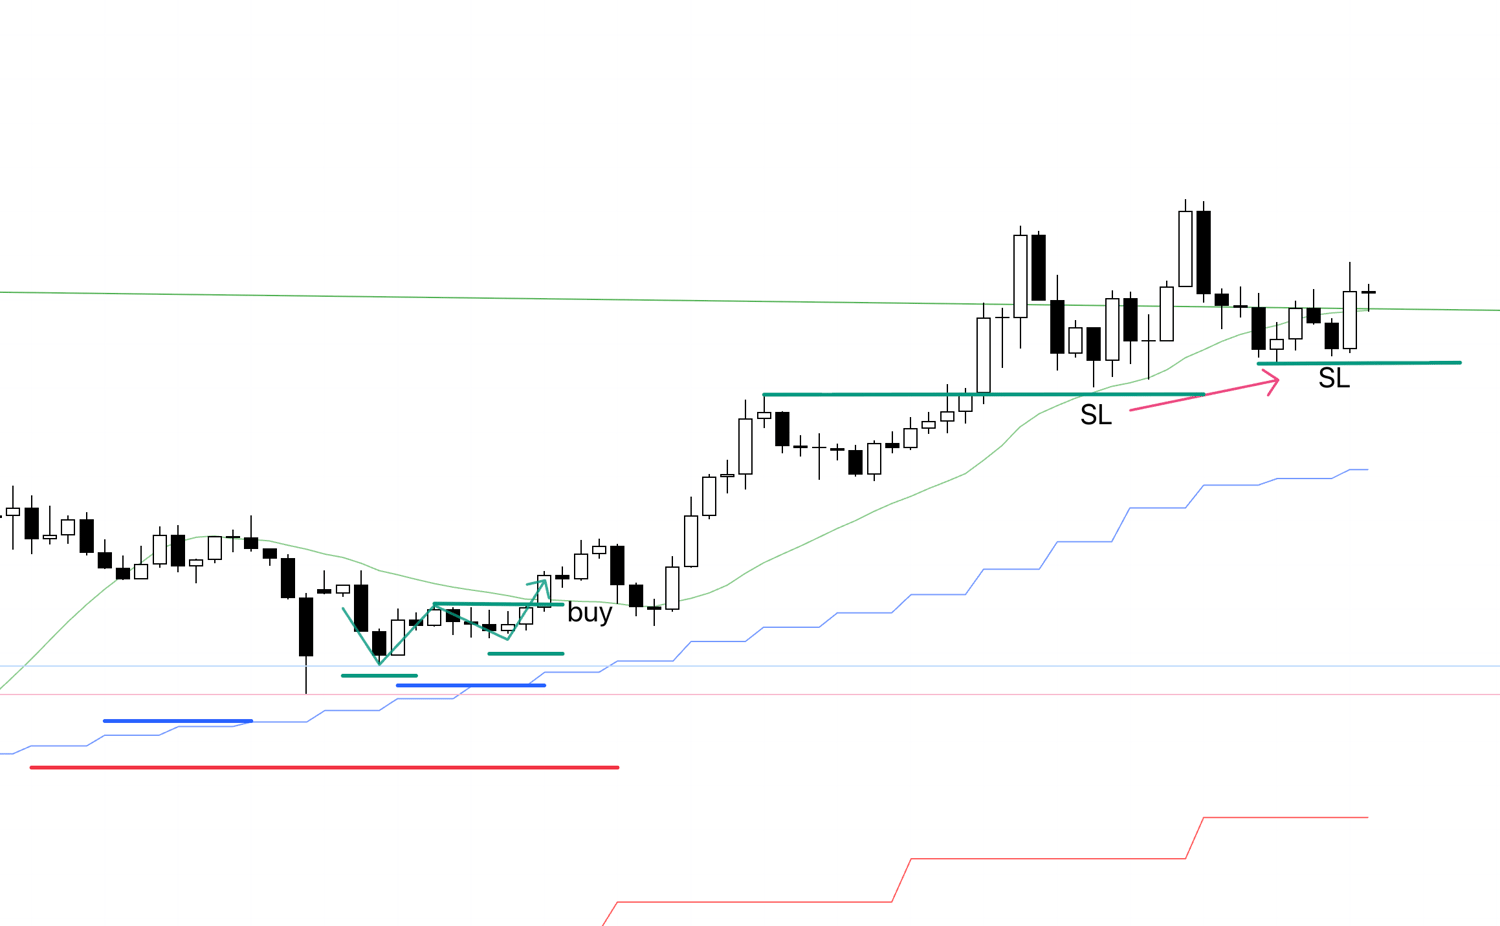
This chart shows the 4h buy scenario I had mapped out last Sunday.
I was waiting to buy where, within a higher low on the daily and within a higher low on the 4h, the lower timeframe flipped into an uptrend.
Because there was still room up to the green trendline above, there was enough range left on the lower timeframes to justify a trade.
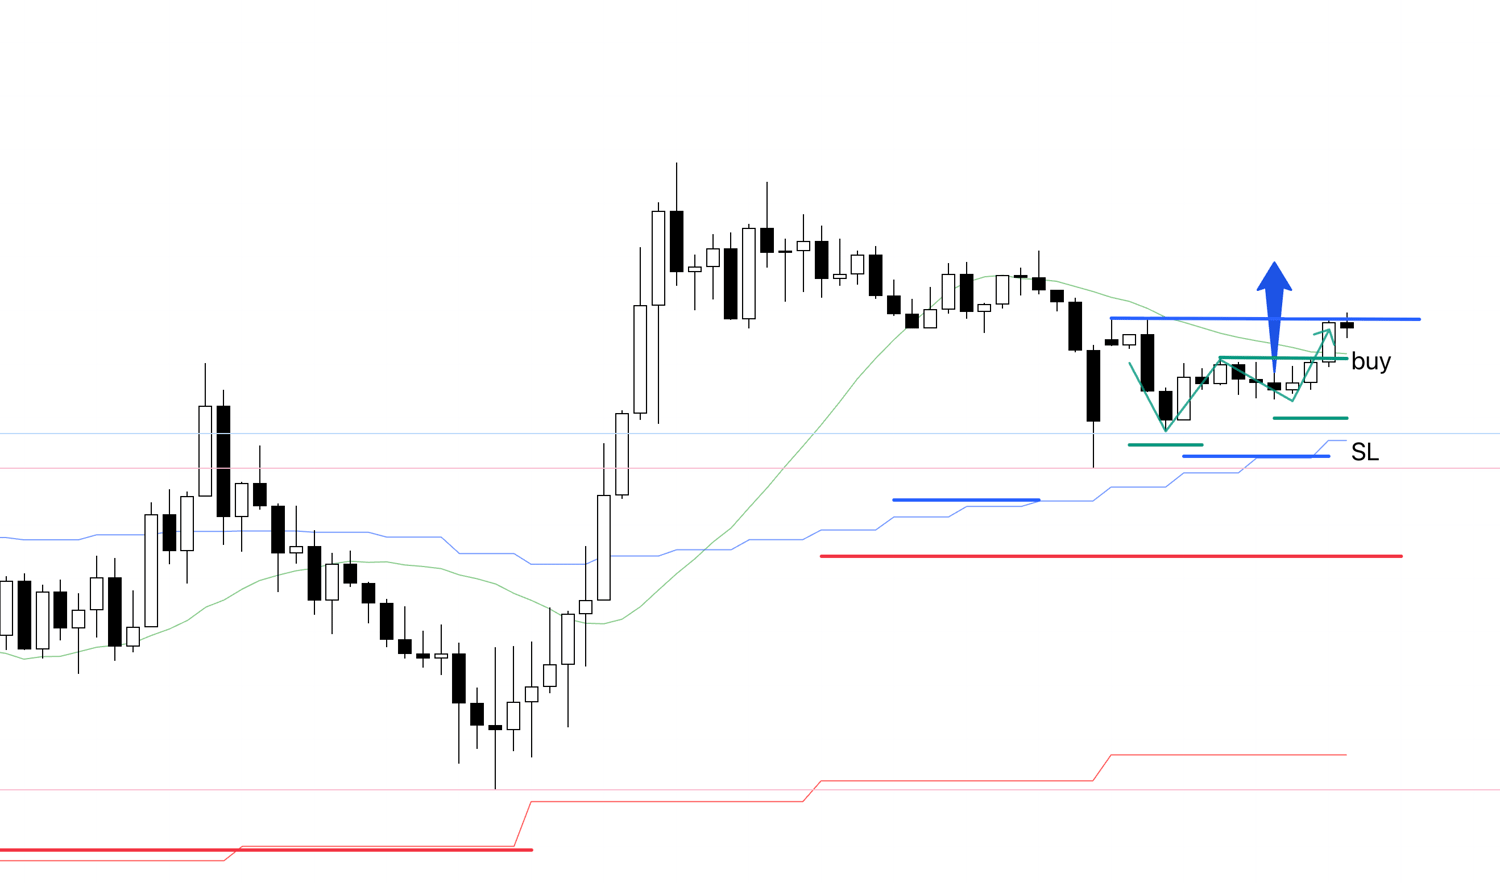
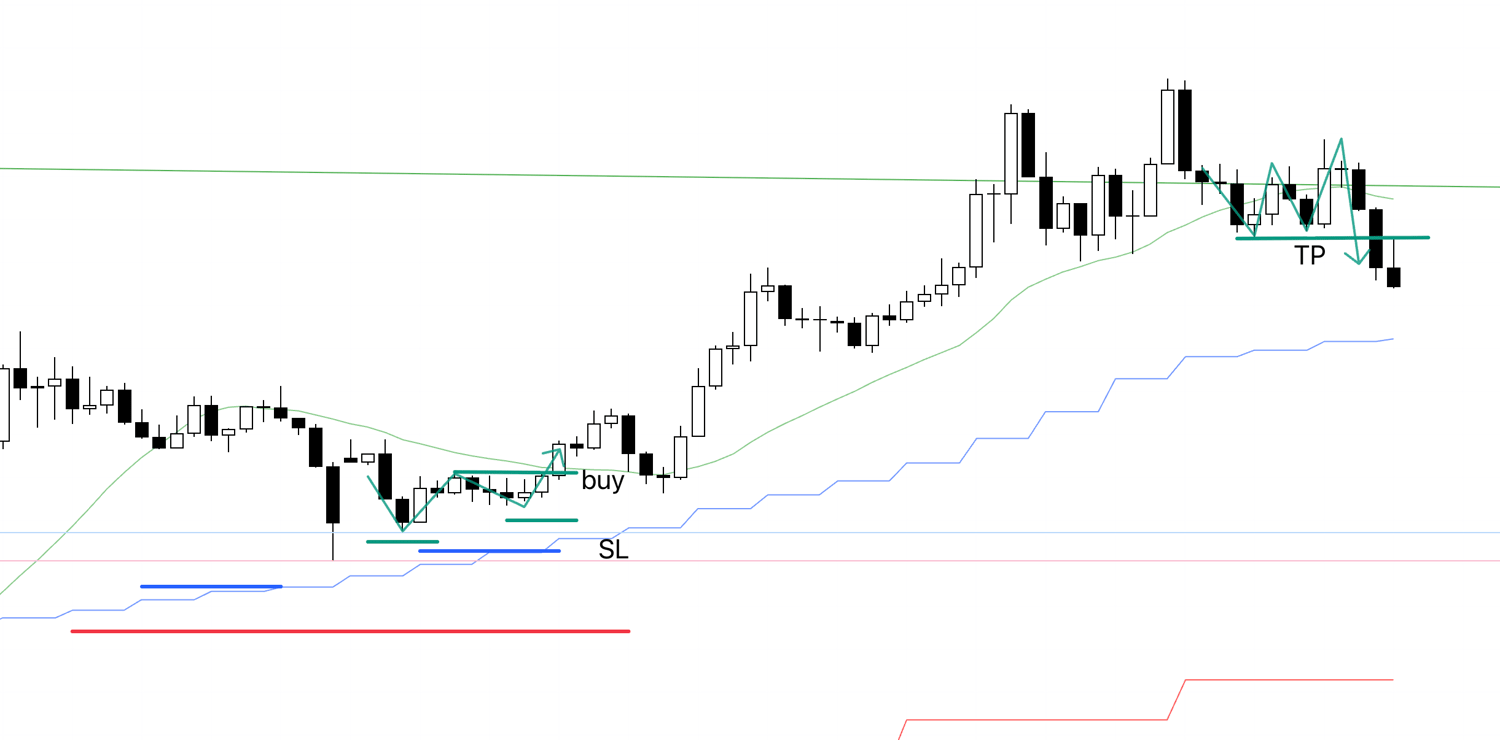
Here is the actual chart.
4h
As you can see, just as in Sunday’s scenario, the 4h was forming a higher low, so let’s look down one timeframe.
1h
On the 1h, the week opened with a gap, so the break above that gap’s high became the 1h swing high.
At the 4h higher low area, once the 1h made a higher high and a higher low, an uptrend on the 1h began.
If price then broke the most recent 4h high, it would confirm continuation of the 4h uptrend, creating a point from which the move could extend.
Now let’s check the 15m.
15m
On the 15m, as indicated by the green line on this chart, entering on the immediate break of the recent high lets you get in one step earlier than waiting for the 1h high to break.
In that case, once price clears the 1h high (blue line), the move propagates into the 1h uptrend, allowing you to target the higher-timeframe advance while using the tighter 15m stop distance, which improves the risk-reward of the trade.
This is a trade where orders cascade into the higher timeframe, and it is extremely important.
15m
The resting order was filled.
The stop loss was set below the 1h swing low.
At this moment price was about to challenge the 1h high.
If it broke through, I would ride the move as the 1h trend began.
As always, exits are taken when the trend structure breaks.
15m
I raised the stop loss.
If price broke this low, the 15m trend would be broken and I would exit.
15m
I raised the stop loss further.
15m
I nudged the stop loss a bit higher.
15m
The trend broke, the trailing stop was hit, and the trade concluded.
〜・〜・〜・〜・〜・〜・〜・〜・〜・〜・〜・〜・〜・〜・
That is the walk-through of the trade I actually executed, but since there were few trades again this week, I will next explain the setups I passed on.
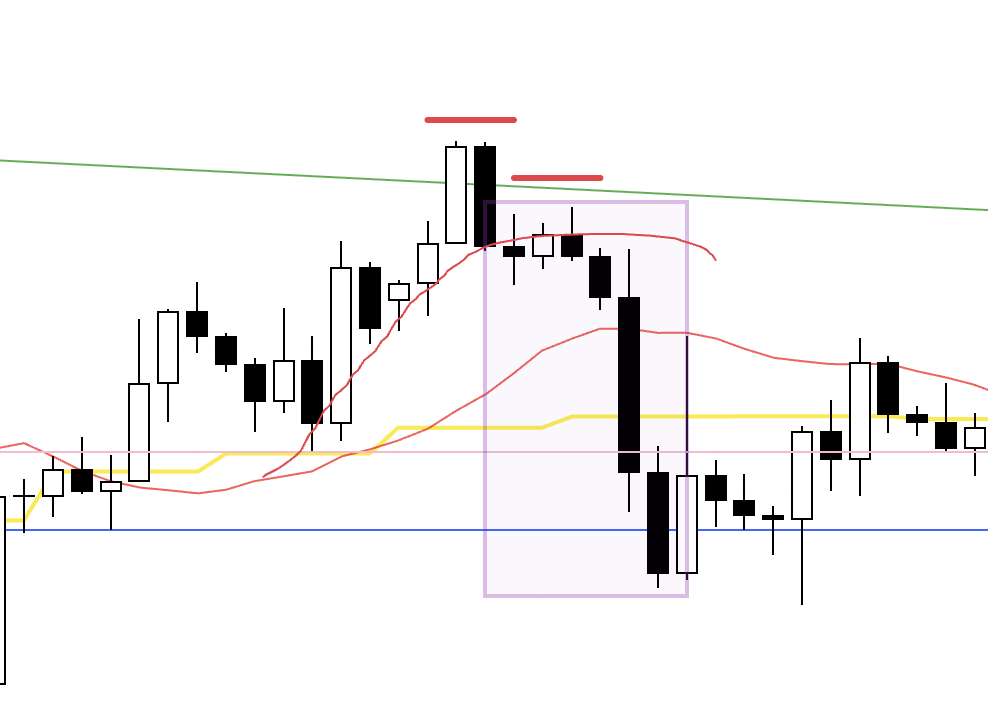
4h
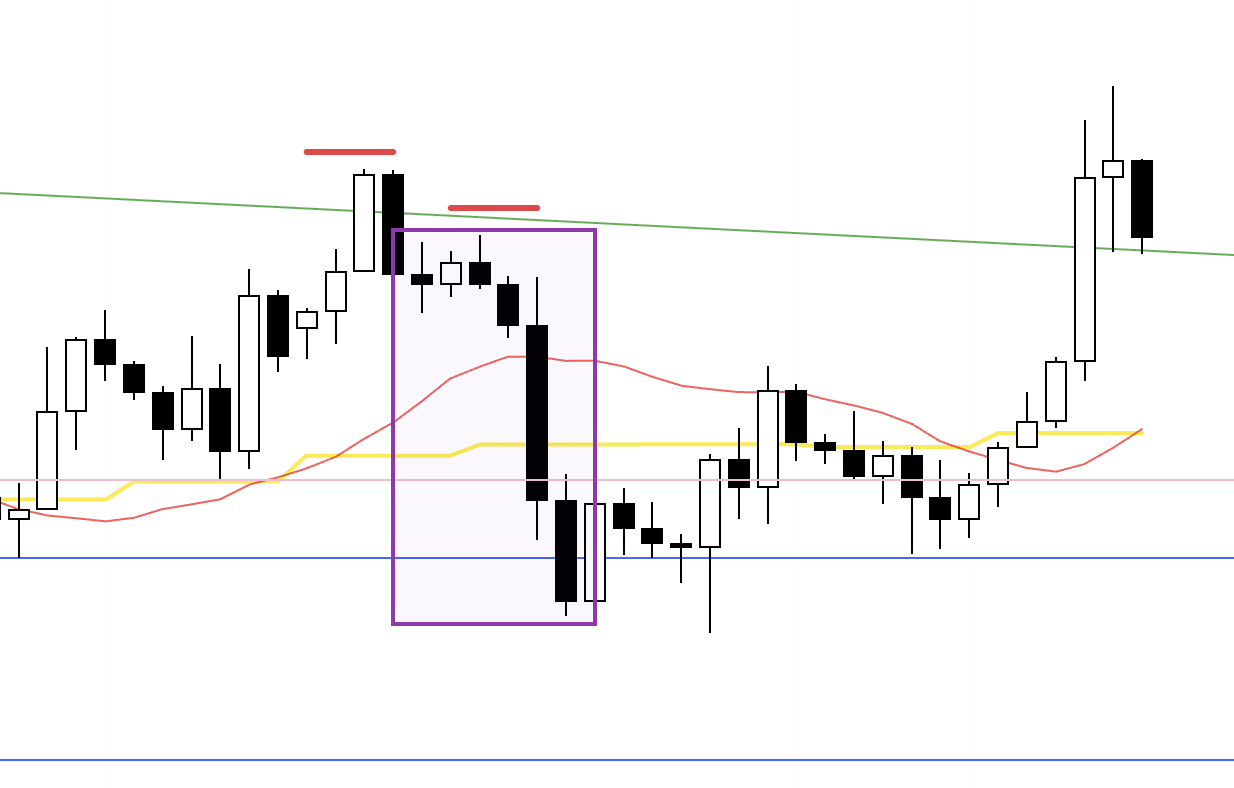
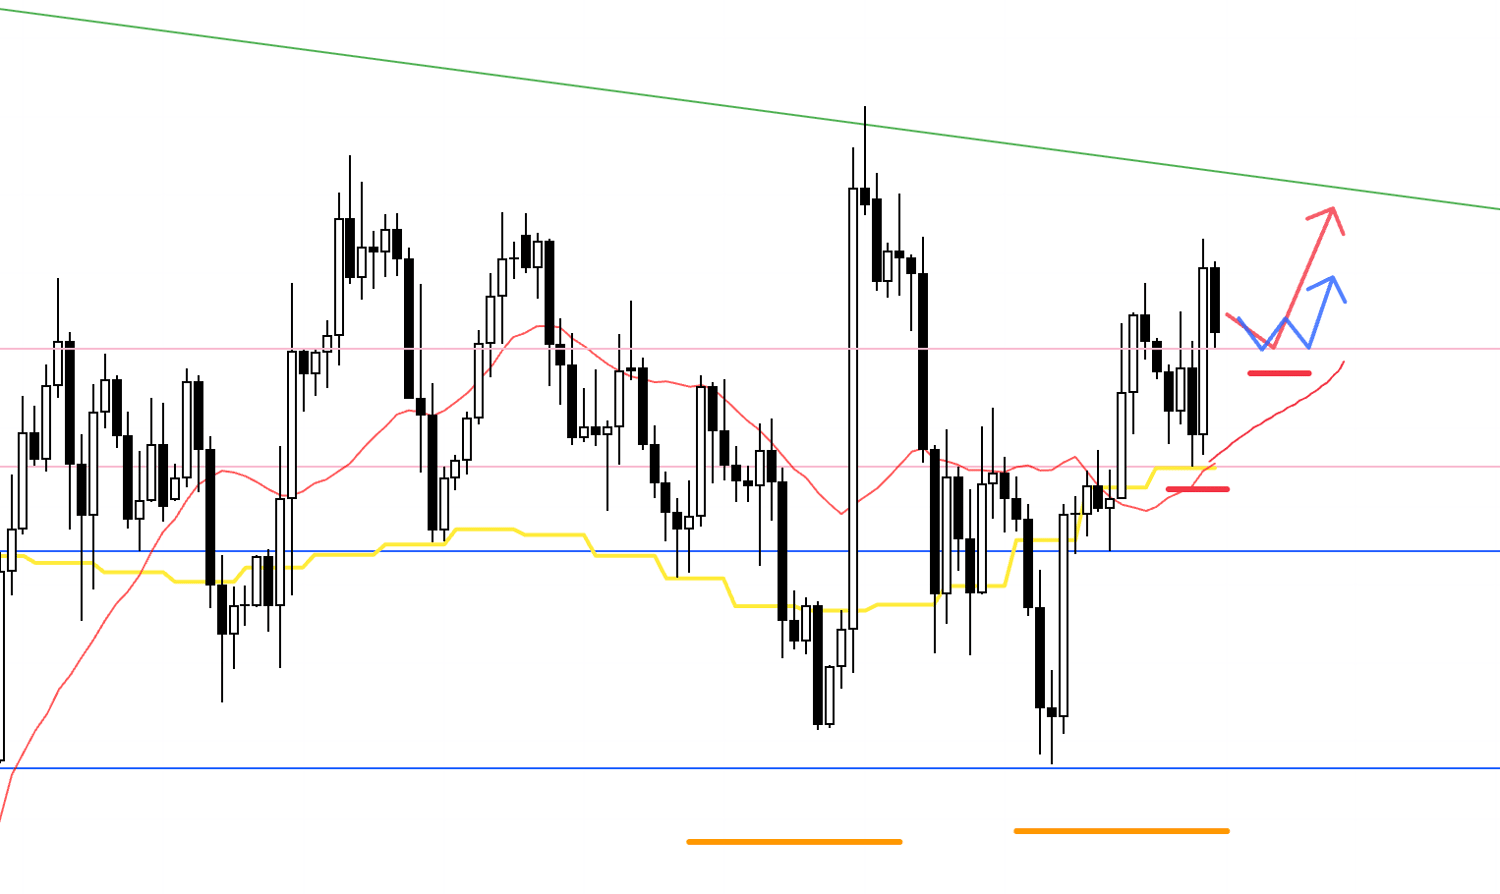
This is the EURUSD 4h chart.
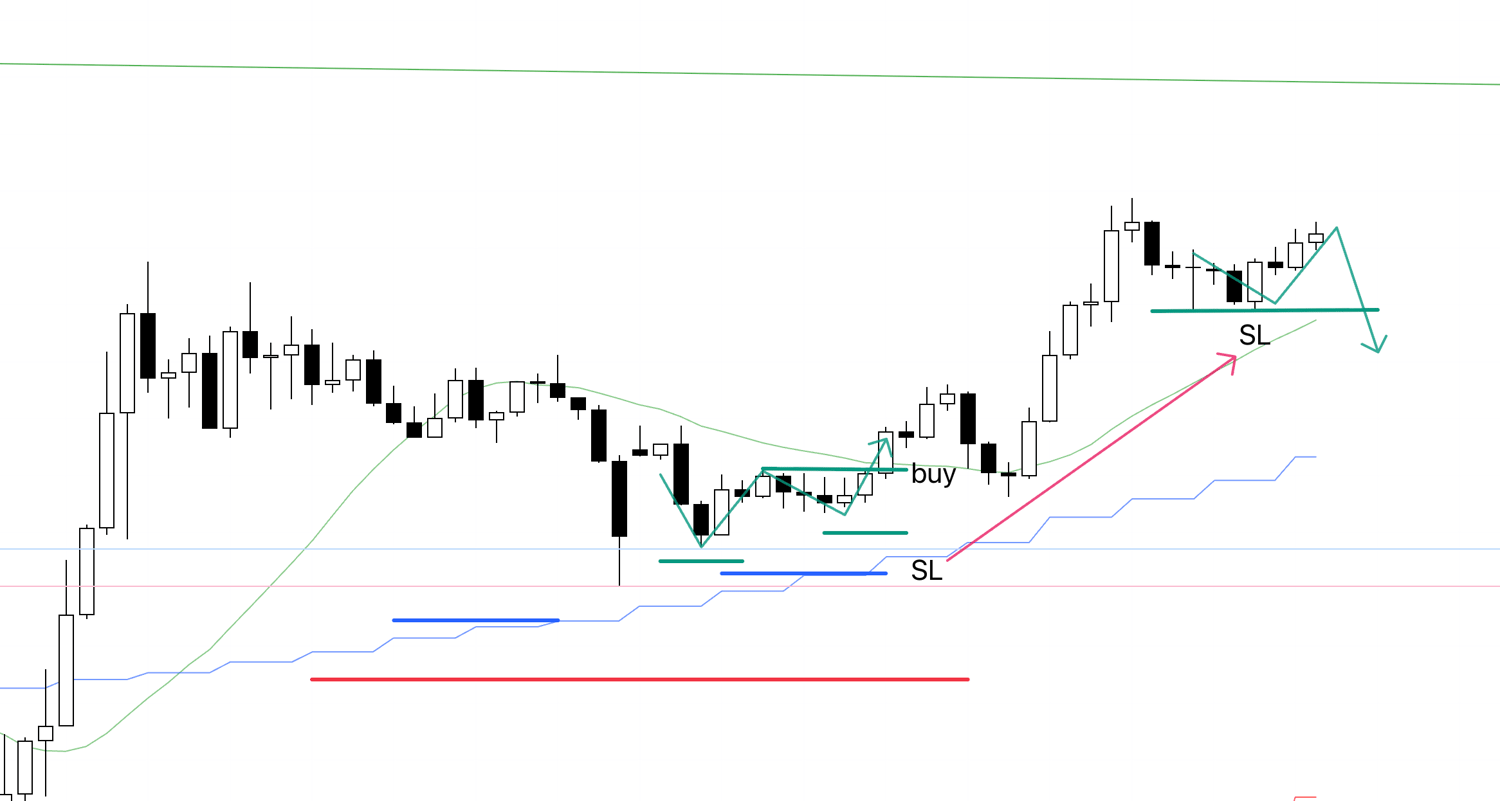
First, after Monday’s long trade, price was capped by the green trendline, formed a 4h lower high, and then broke the low and fell.
However, that is hindsight.
At that stage the 4h moving average (red) was still positioned to provide support from below, so I was waiting for the next higher low.
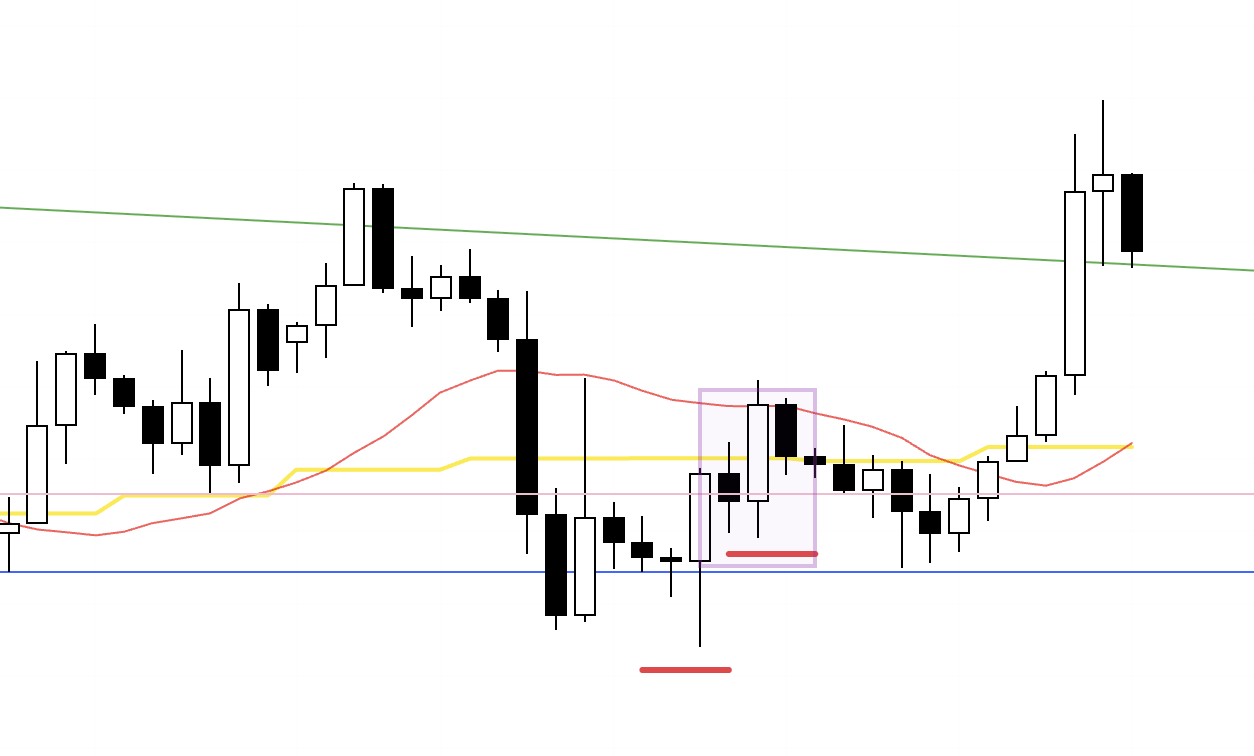
4h
In reality, price dropped straight down.
But had a higher low formed, I would have needed to take another buy entry.
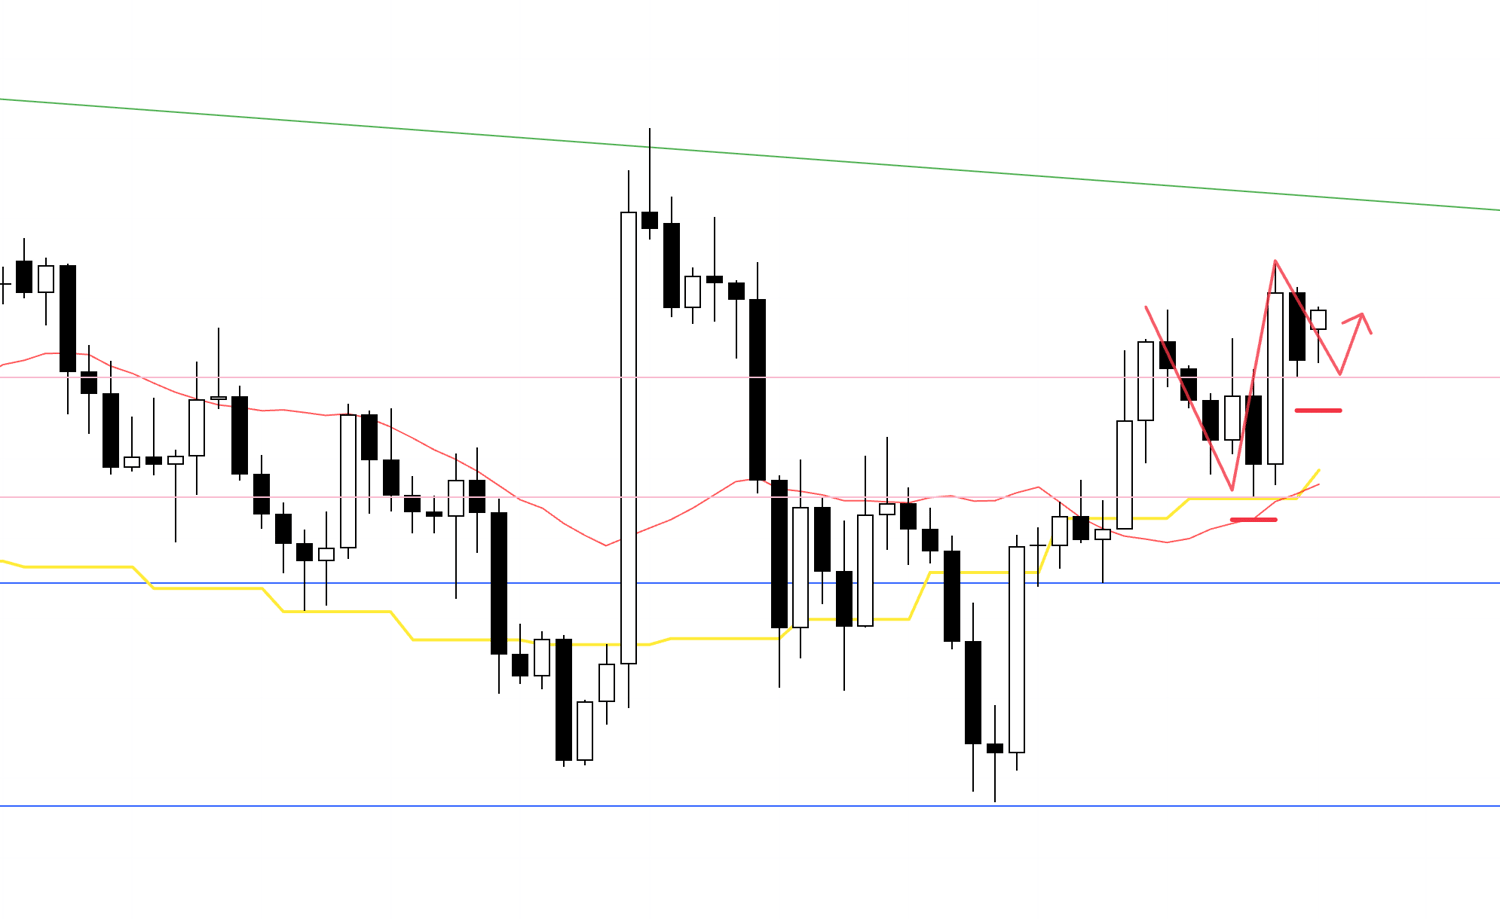
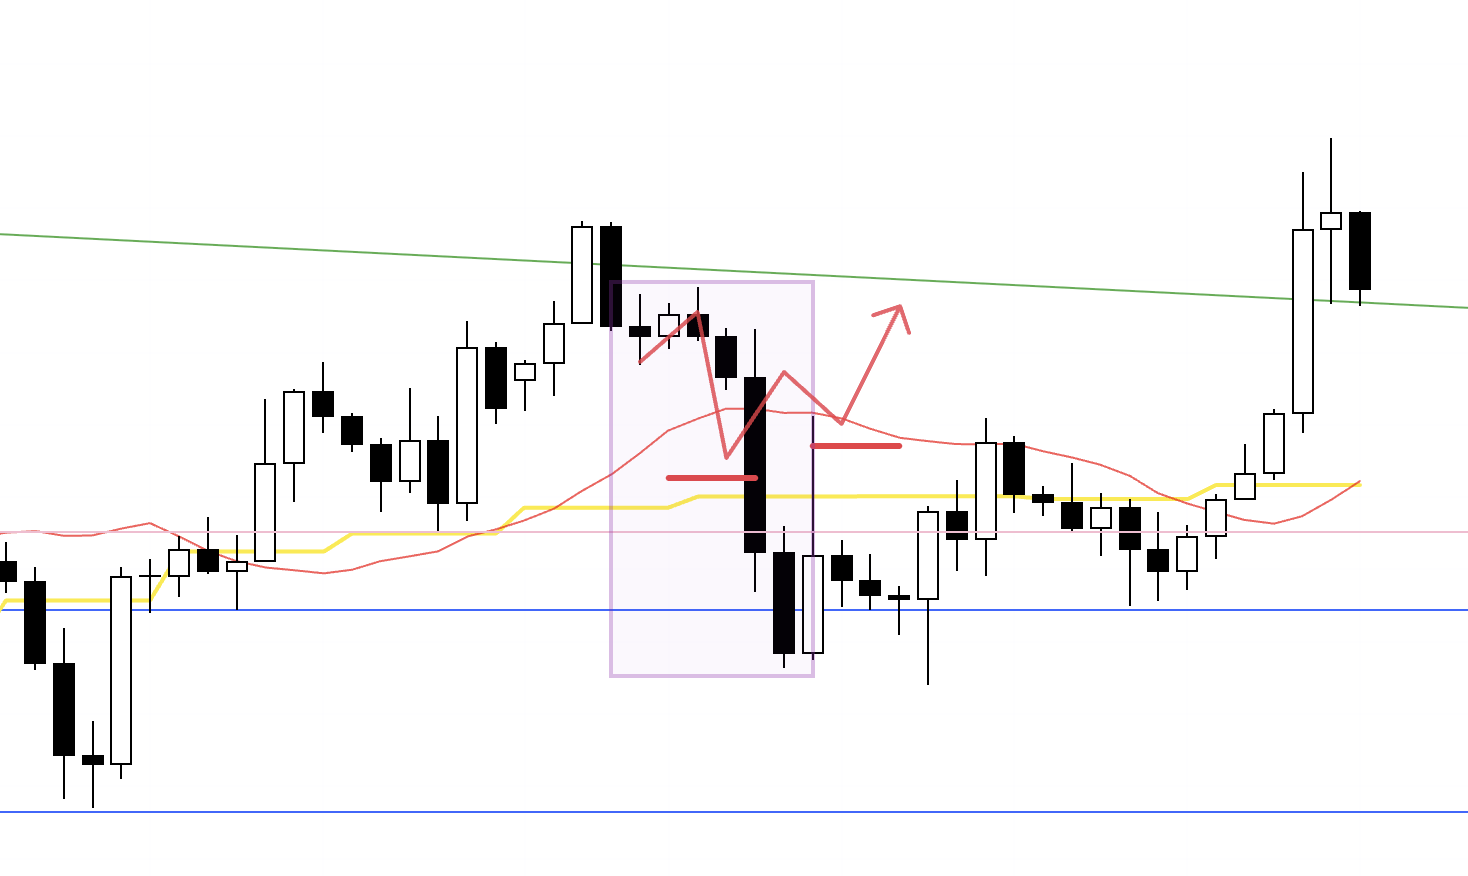
4h
If the 4h moving average (red) had rolled over and begun to cap from above, as sketched on this chart, I would have considered a short on the lower timeframes at the 4h lower high.
But that was not the case here, so under my rules there was no trade.
4h
For the same reason I also passed on the attempted higher low near the blue support line.
At that point the 4h moving average (red) was still capping from above.
4h
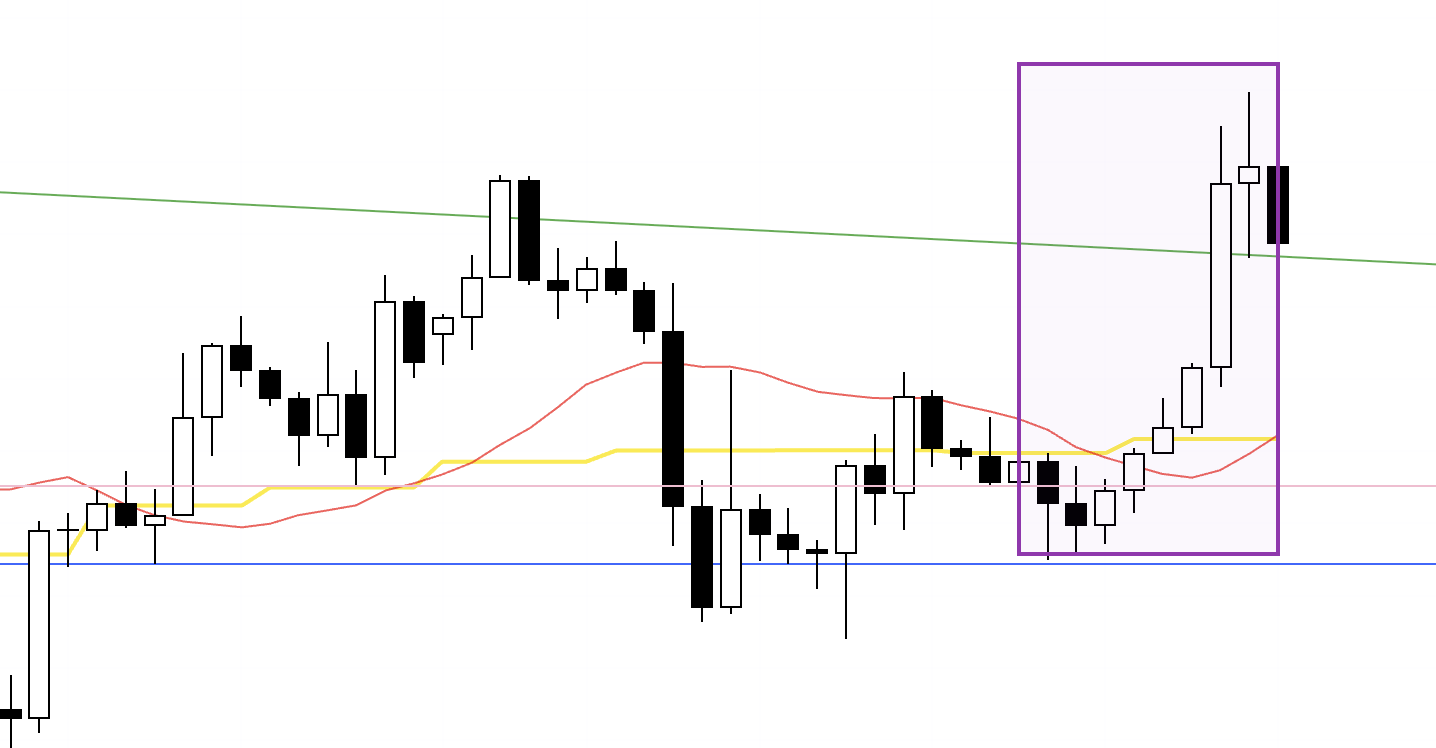
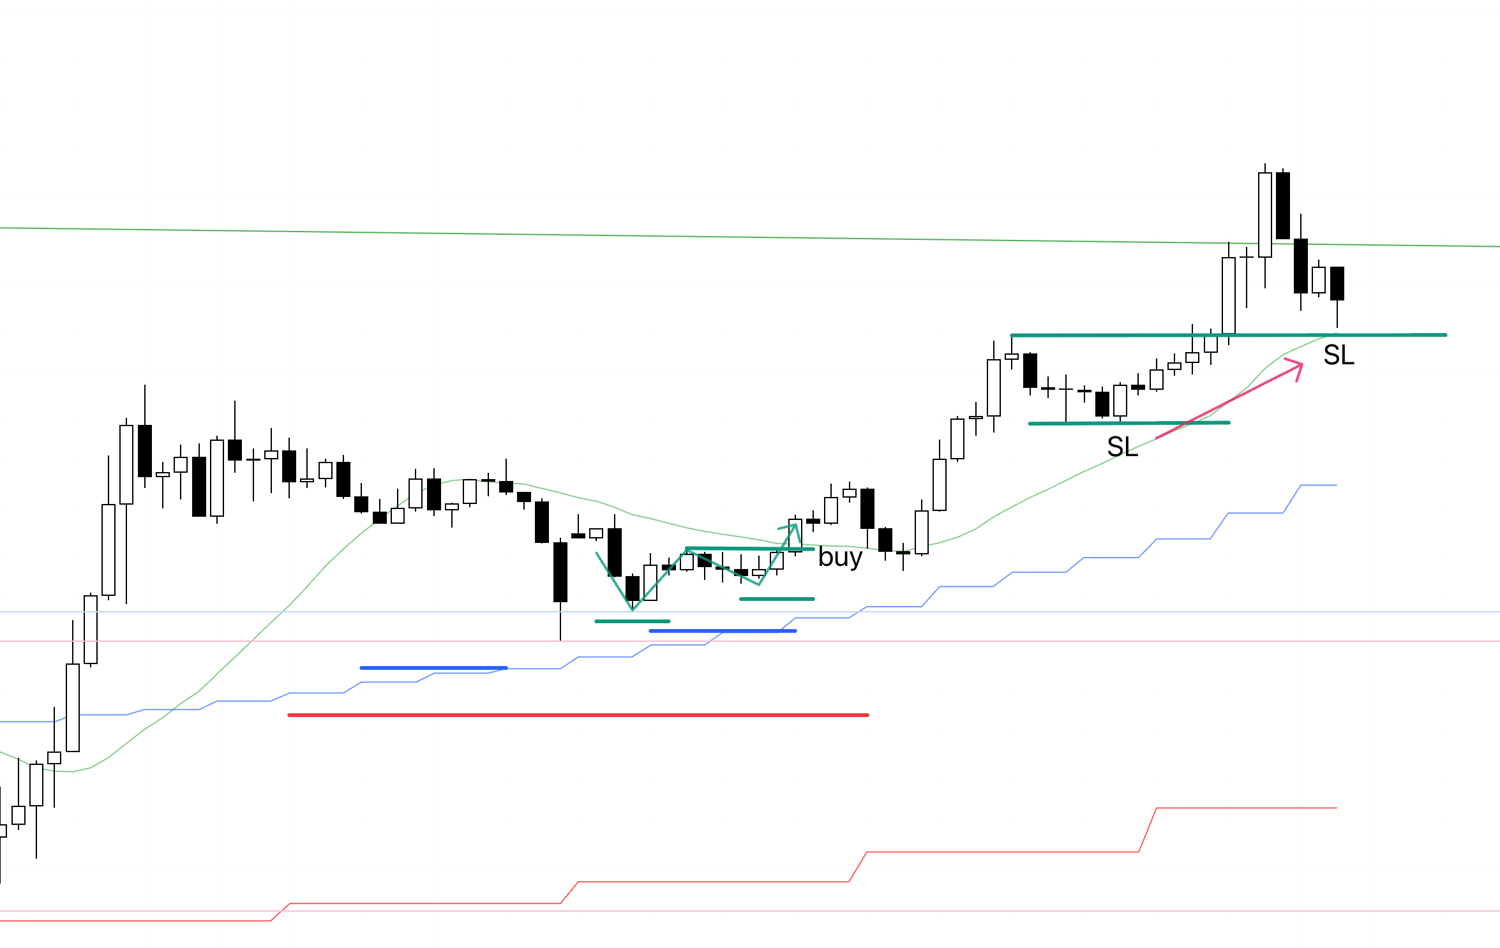
Price then rose, but it did so without forming a higher low, so there was still no trade for me.
If a higher low had formed, I could have considered an entry.
See below.
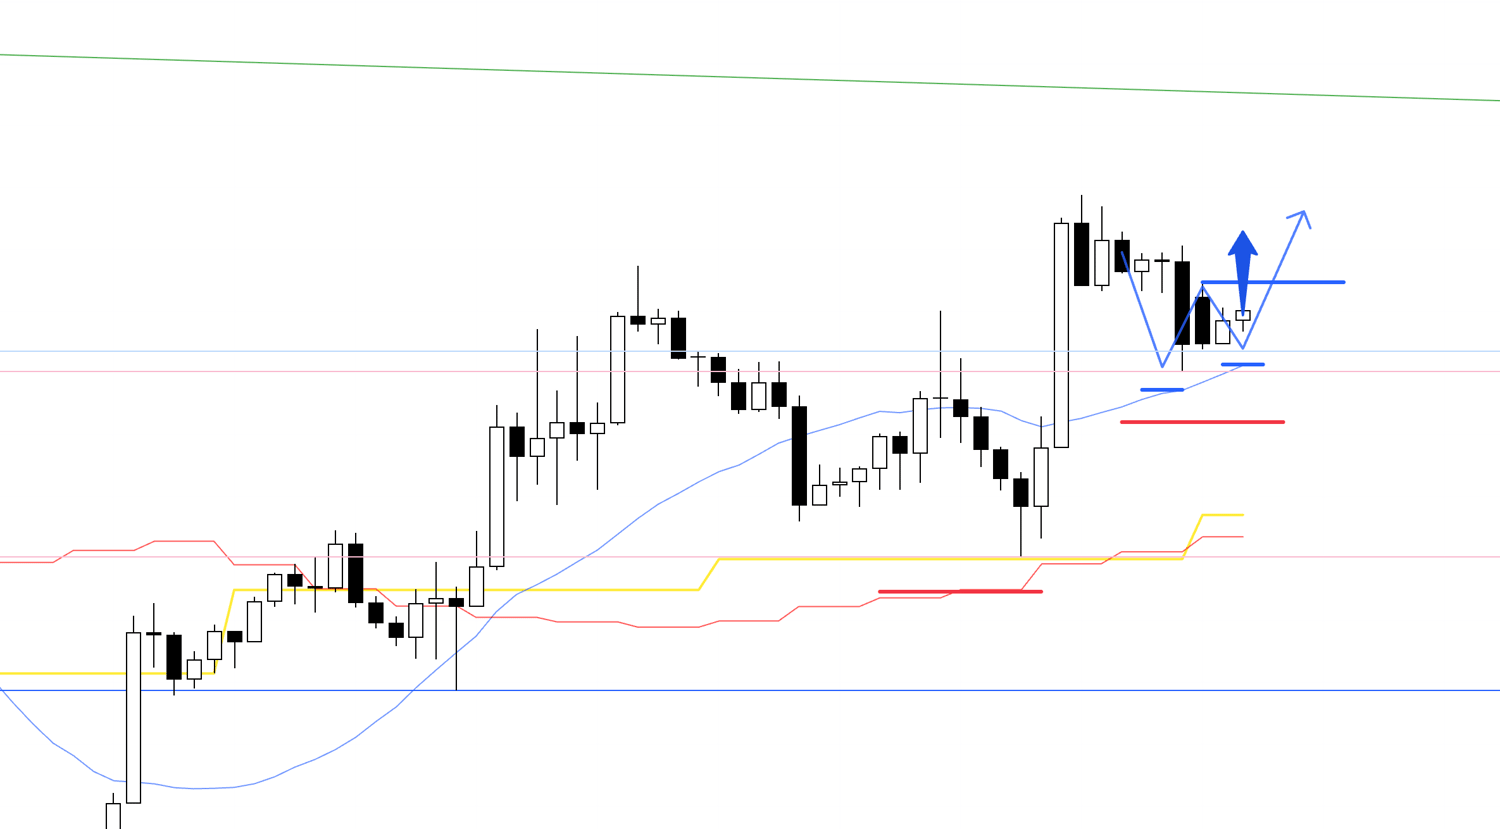
4h
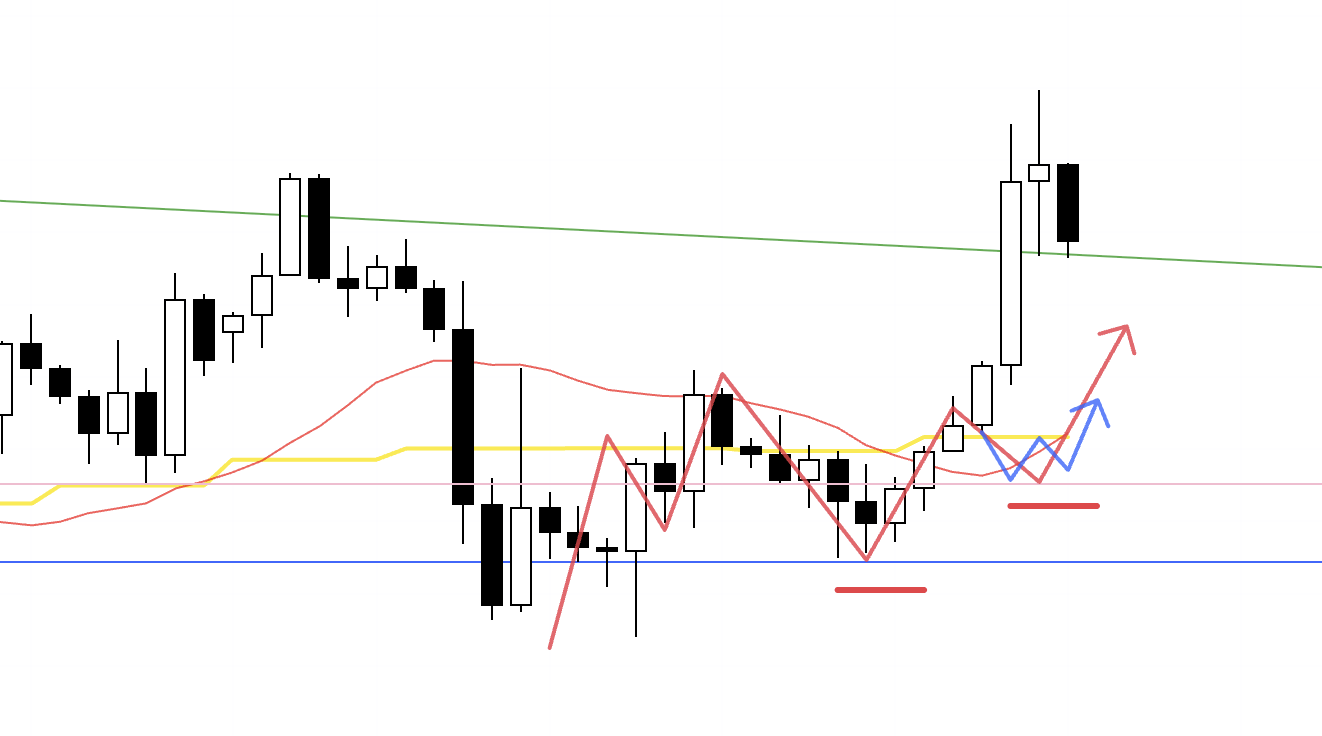
If a higher low had formed on the 4h like this, I could have looked for an entry on a lower timeframe.
In that case it would have been the first point of a fresh 4h trend reversal to the upside, and I could have aimed to follow the move up to the green trendline again.
Looking back after the fact, you might think “I could have traded it if I had looked at it this way,” but changing your view like that undermines consistency and is not advisable.
I always repeat the same process under the same conditions, and that consistency is crucial.
〜・〜・〜・〜・〜・〜・〜・〜・〜・〜・〜・〜・〜・〜・
That is all.
Trades were few again this week, and in EURUSD there were no opportunities after Monday.
USDJPY again failed to break out of its range.
As I have written many times, you must not trade in areas where risk is concentrated or where trading is inherently difficult.
Trading becomes difficult because you try to force a trade in difficult areas.
If you decide from the outset not to trade where your own rules make it difficult to act, “difficult trades” disappear.
Points on the chart where orders cluster are fairly fixed, so it is important to trade only at those favorable locations and to avoid all unfavorable areas completely.
Do not rush.
For roughly the last three weeks, the market environment has not been well aligned, so there have been few opportunities and I have not traded much, but I have avoided unnecessary losses, taken only the trades that were truly required, and incurred only the gains and losses that were truly necessary.
That is very important for leaving profits over the long run.
Trade opportunities will come without rushing.
Our purpose as traders is not to “enjoy trading,” it is to grow capital, and to do that we take only the necessary trades and repeat only the necessary gains and necessary losses.
I hope this was helpful.
In this report, published every Saturday, I summarize the trades I actually took during the week together with the thought process I recorded in real time, including entries, stop placement, and profit-taking decisions.
As noted at the beginning, this Weekly Trade Report is planned to become a paid product, but I am still preparing to upgrade it into a more comprehensive offering and need a little more time.
I am sorry for the repeated delays, but for now I will continue to publish this Weekly Trade Report for free, so please use this opportunity to experience my repeated process of consistent scenario building and execution.
These materials are provided solely for educational purposes.
They do not instruct you to buy or sell and do not guarantee future profits.
You are fully responsible for any trades you make, so take the time to build and test your strategy and approach trading at your own risk.
I hope my consistent trading can serve as a reference for your own consistency.