


Hello.
Here are the trade scenarios for the coming week.
This Trade Scenarios post is published every Sunday.
Every Saturday, I also publish a Weekly Trade Report that shows how I thought through and executed trades during the week.
Reading Trade Scenarios alongside the Weekly Trade Report will help you see, at an operational level, how I plan in advance, what I wait for, and how I execute with consistency.
For the underlying strategy, please see my posts on Dow Theory and multi‑timeframe analysis.
A scenario is not a prediction.
It is not a forecast, but a personal “if this, then I do that” plan.
I do not predict markets, and this is not intended as a forecast, so please keep that in mind.
This is not an instruction to buy or sell, nor is it a signal service.
It does not guarantee future profits, and is provided for educational purposes to illustrate how I execute a consistent process.
I cannot take responsibility for any outcomes of your trading, so please trade at your own risk.
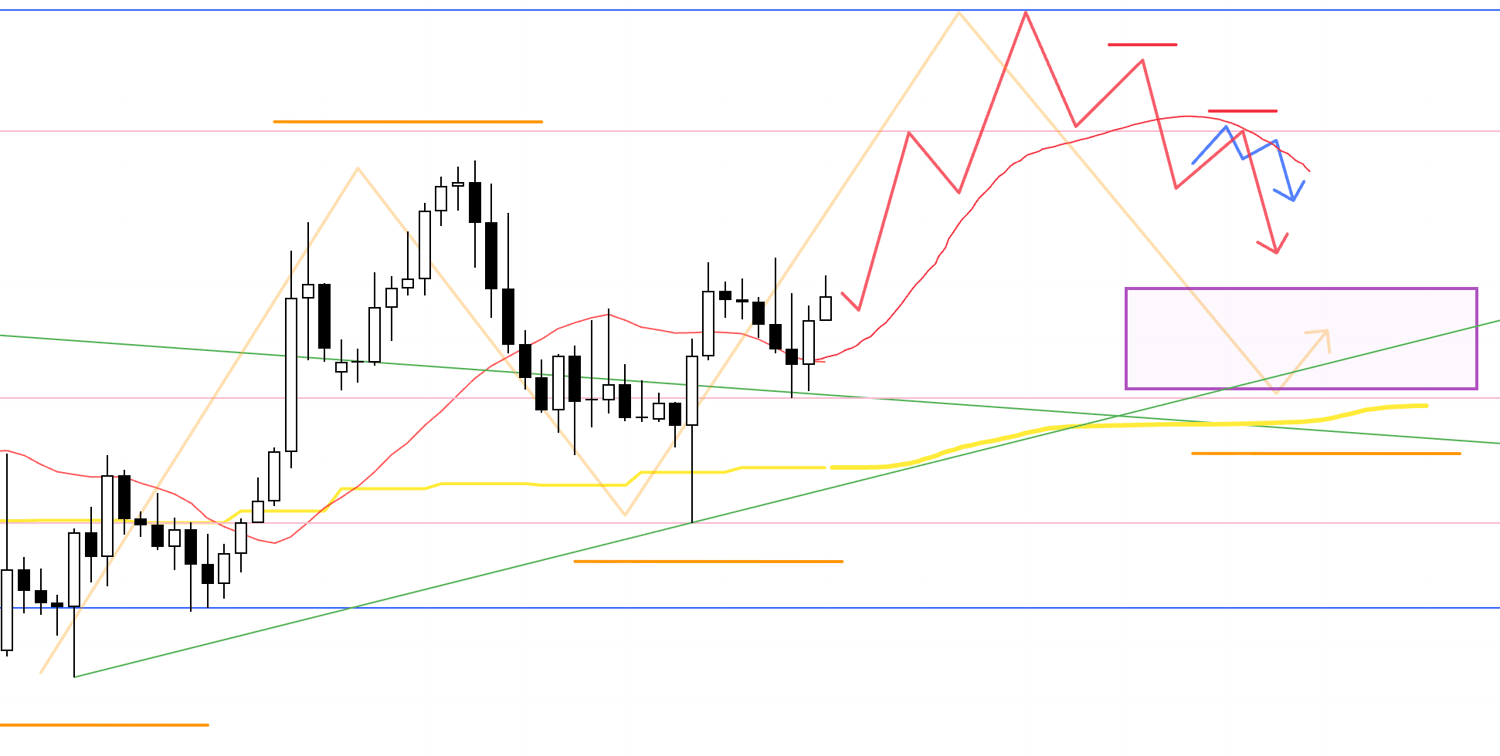
Let’s start with USDJPY.
(On my charts, line colors denote timeframe moves: orange is Daily, red is 4h, blue is 1h, and green is 15m.)
〜・〜・〜・〜・〜・〜・〜・〜・〜・〜・〜・〜・〜・〜・
USDJPY
Daily
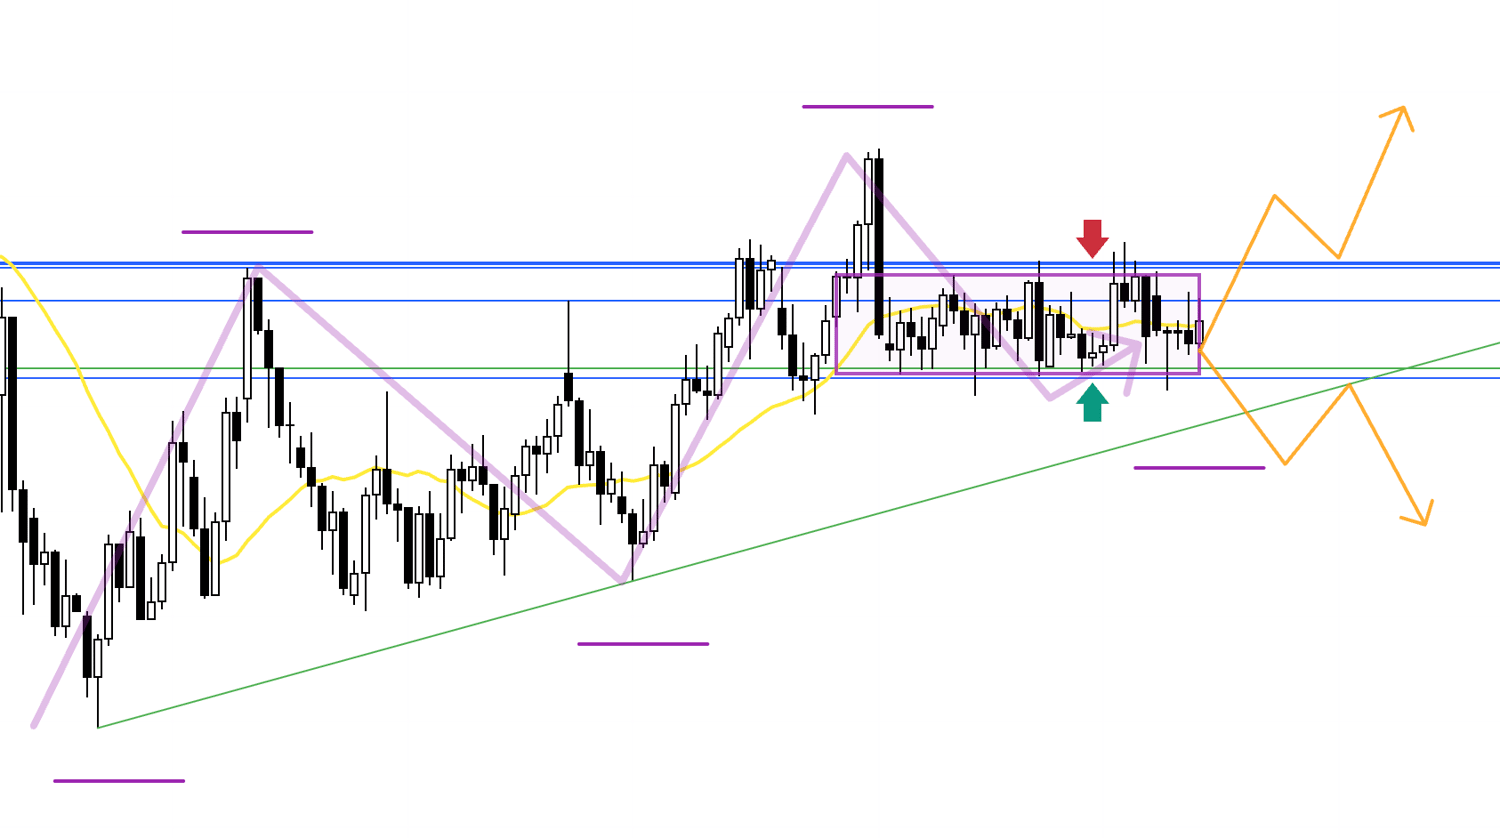
Little has changed from last week.
Highs continue to be capped by the strong resistance drawn in blue, keeping the topside heavy.
On this Daily chart, the purple arrows and lines overlay the Weekly structure from above.
The Weekly is a pullback within an uptrend with rising lows, while on the Daily we have neither managed to roll over with lower lows nor break the overhead resistance, leaving price caught between buyers and sellers without resolution.
As in last week’s scenario, when price is trapped between opposing flows like this, the base case is to wait for the range to break and settle before considering a trade.
As the orange arrows show, I want to buy after a break and subsequent support hold, or sell after a break and subsequent rejection, and will wait for those retests.
Now let’s look at EURUSD.
〜・〜・〜・〜・〜・〜・〜・〜・〜・〜・〜・〜・〜・〜・
EURUSD
Daily
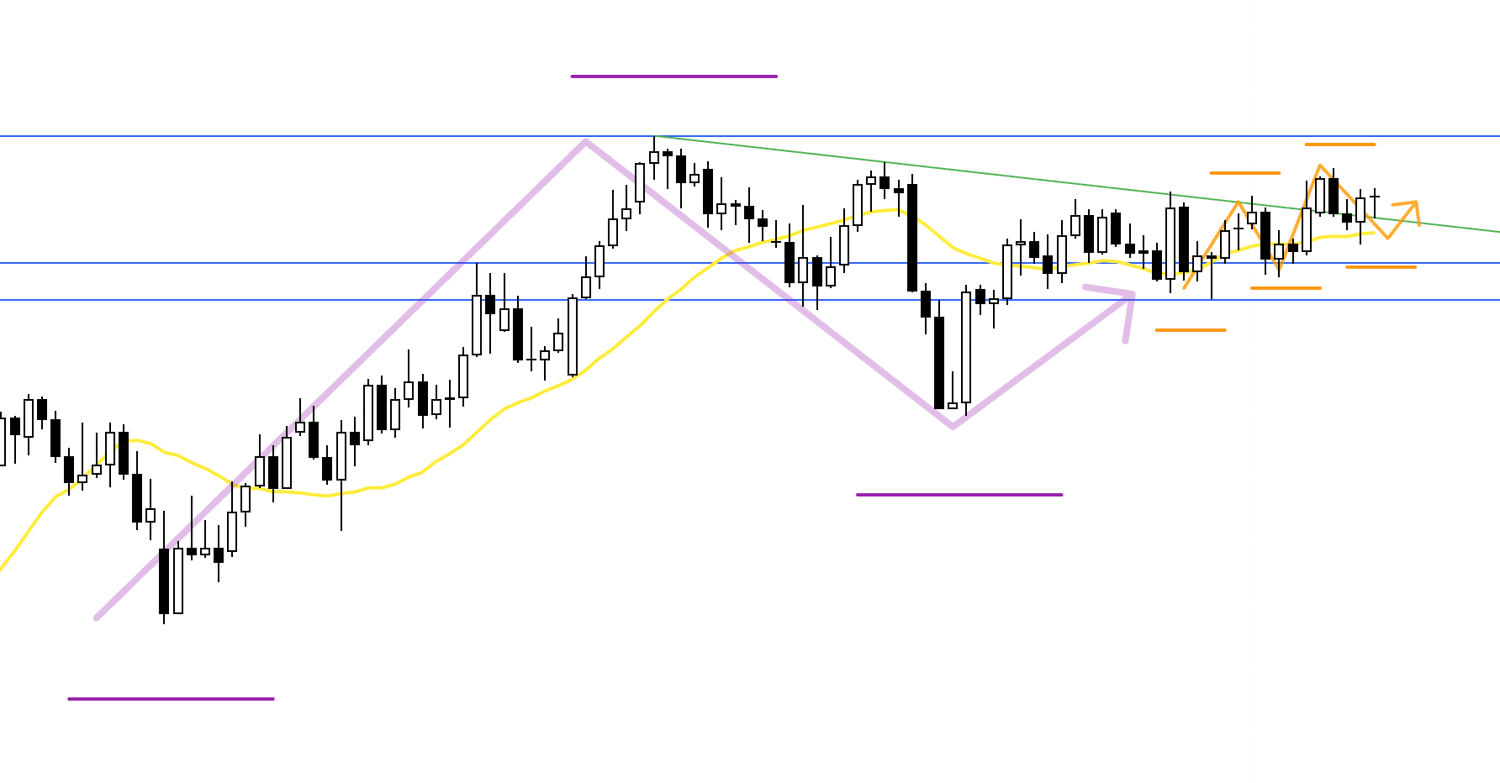
The purple overlay on this Daily chart depicts the Weekly structure from above.
On the Weekly, this is a buy‑the‑dip within an uptrend.
On the Daily, topside had been heavy, but price has finally broken the green trendline, and we are at the point of seeing whether higher lows can lead to fresh highs.
If I consider longs from here, I will look for straightforward pullback buys.
If I consider shorts, I must be mindful of supports such as the Weekly buy‑the‑dip area.
With that in mind, let’s look at the 4h.
4h
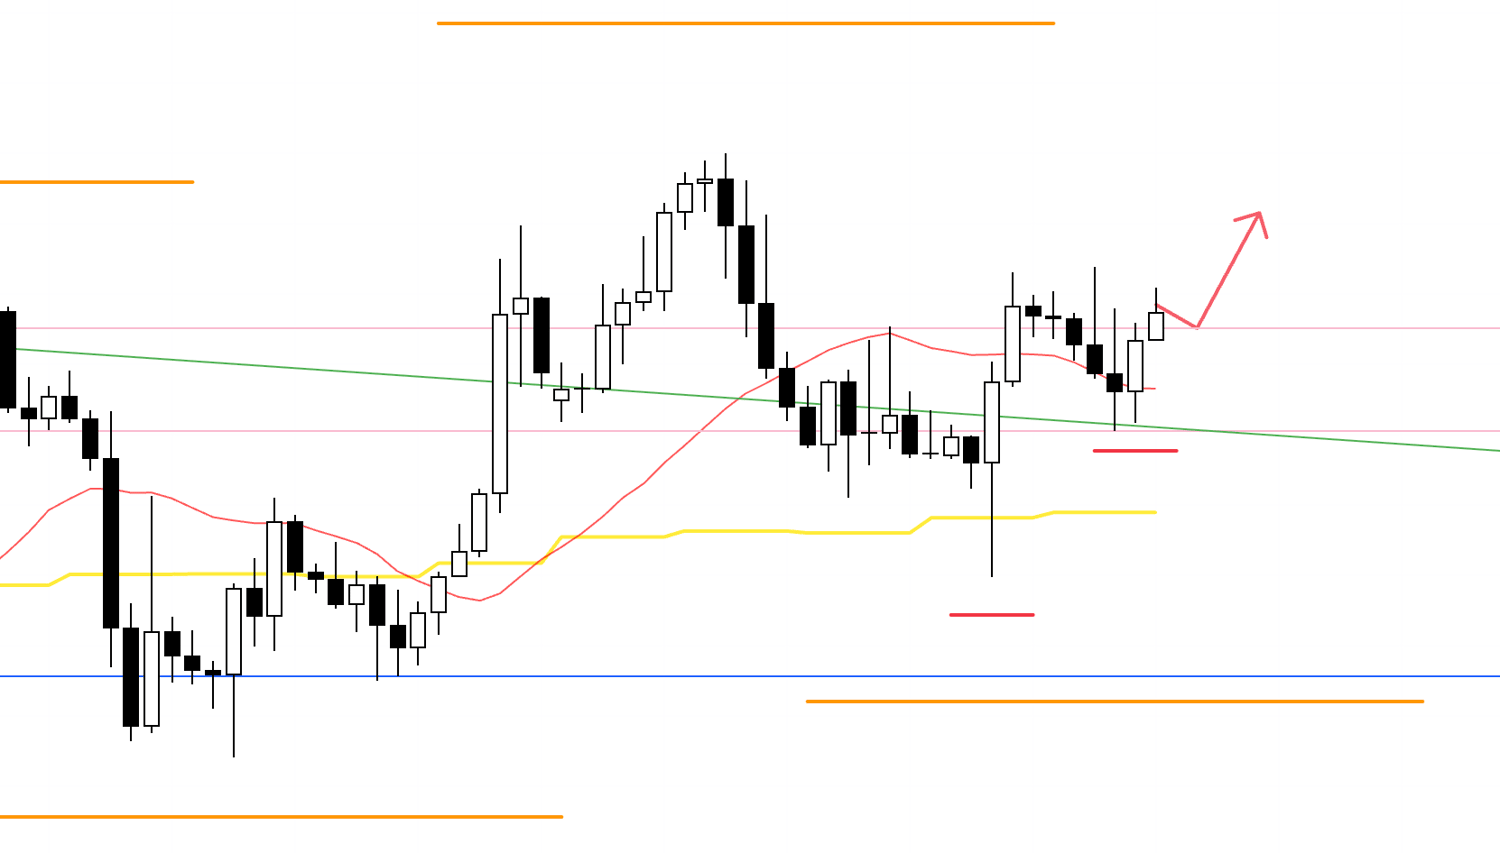
On the 4h, price has just formed a new higher‑low area, and we are watching to see whether it can take out the recent high.
If lower timeframes like the 1h also transition to an uptrend, I will consider longs.
4h
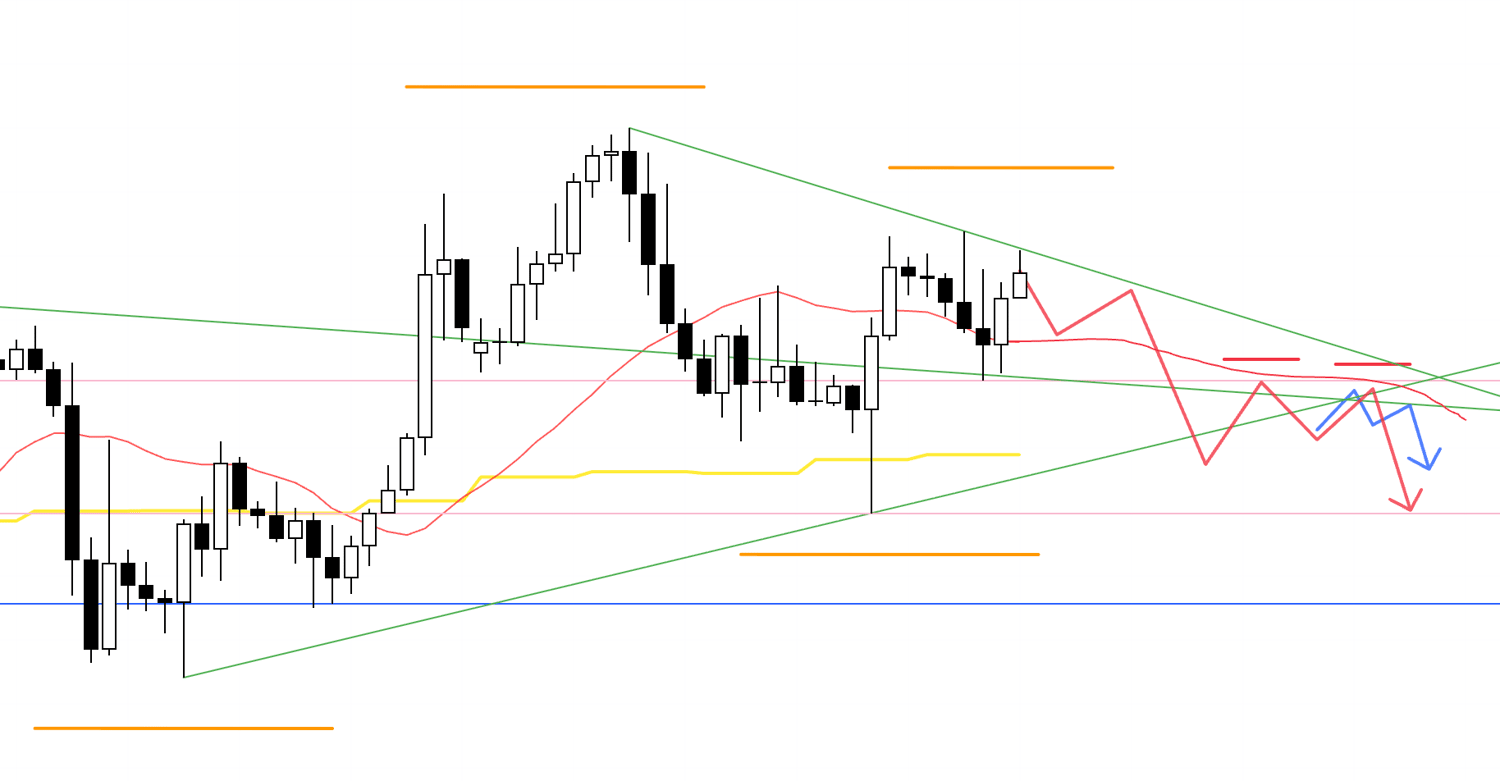
If the 4h fails to hold higher lows and instead starts printing lower highs, I would consider shorts as a 4h lower‑high inside the Daily lower‑high context.
However, even if the Daily appears to be carving a lower high, it is still holding higher lows for now, and as long as price remains above the Daily uptrend line (the lower green line), it is effectively wedged between buyers and sellers, making immediate shorts difficult.
Therefore, I would prefer to see a clean break below that trendline and then look to sell a newly formed lower‑high retest.
Even so, there are Daily lows and Weekly buy‑the‑dip support areas just below, so the key is whether an entry appears with acceptable risk‑reward.
4h
If price moves higher first and then gets capped near the Weekly highs, leading the 4h to form a lower high, I will consider shorts on a lower timeframe.
In that case, because taking out the Daily high would confirm continuation of the Daily uptrend, any dip invites “buy the dip” flows, and the deeper it falls, the more those buyers are likely to appear.
So if shorting, the key is whether a point appears as high as possible with favorable risk‑reward.
I would likely manage the risk‑reward actively, including partial profit‑taking.
〜・〜・〜・〜・〜・〜・〜・〜・〜・〜・〜・〜・〜・〜・
That is all.
These are scenarios as of now, and once the week begins I will update and build them as price action unfolds.
Week in and week out, I draw similar scenarios and repeat similar trades.
The number of places on a chart where orders from many traders across timeframes concentrate in one direction—true edge—is limited, but if you confine yourself to trading only there, both win rate and risk‑reward become highly favorable.
Win rate and risk‑reward are often said to be a trade‑off, but at points where orders concentrate, both tend to improve.
What matters is avoiding any unnecessary trades outside of areas with edge.
I understand the urge to “trade more to make more,” but even if the number of trades drops, repeatedly trading only at points with real edge is the shorter path.
Many traders get anxious with thoughts like “I didn’t make money this week” or “I didn’t make money this month,” and they force trades, and even if that turns a given week or month positive, short‑term thinking often leaves them with less capital a year later.
In the end, short‑term thinking and emotional behavior amount to consistently running a system with negative expectancy, and over a year that negative expectancy shows up in results.
Conversely, if you can accept “it’s fine not to make money this week or this month,” patiently wait only for the truly necessary spots, and trade only there, then even if capital does not grow this month, given enough time, time itself will work for you.
Trading comes down to whether you can maintain a long‑term perspective and keep repeating actions with edge.
If this underscores the importance of setting scenarios in advance and trading “only” at those spots, I’m glad.
These Trade Scenarios are my personal plan.
If your own method is not yet set, feel free to use this as a reference for building your strategy, but if your trading is already established, please stick to your rules and do not be swayed by my plan.
Thank you for reading to the end.