

Hello.
I am laying out my trading scenarios for the week ahead.
I publish this "Trade Scenarios" blog every Sunday.
And every Saturday I post a "Weekly Trade Report" detailing how I thought and traded over the prior week.
Read alongside the Trade Scenarios blog, I believe it will help you see, at an operational level, how I plan in advance, what I wait for, and how I execute.
For the underlying strategy, please see my posts on Dow Theory and multi‑timeframe analysis.
A scenario is not a prediction.
It is not a forecast but my personal plan: "if this happens, I will do that."
I do not predict the market, and this is not intended as such, so please understand that in advance.
Nor is this an instruction to buy or sell, or a signal service.
It does not guarantee future profits and is provided solely for educational purposes to illustrate how I execute a consistent process.
I cannot accept responsibility for any outcomes of your trades, so please trade at your own risk.
Let us start with USDJPY.
(On my charts, colors denote timeframes: orange for the daily, red for 4h, blue for 1h, and green for 15m.)
〜・〜・〜・〜・〜・〜・〜・〜・〜・〜・〜・〜・〜・〜・
USDJPY
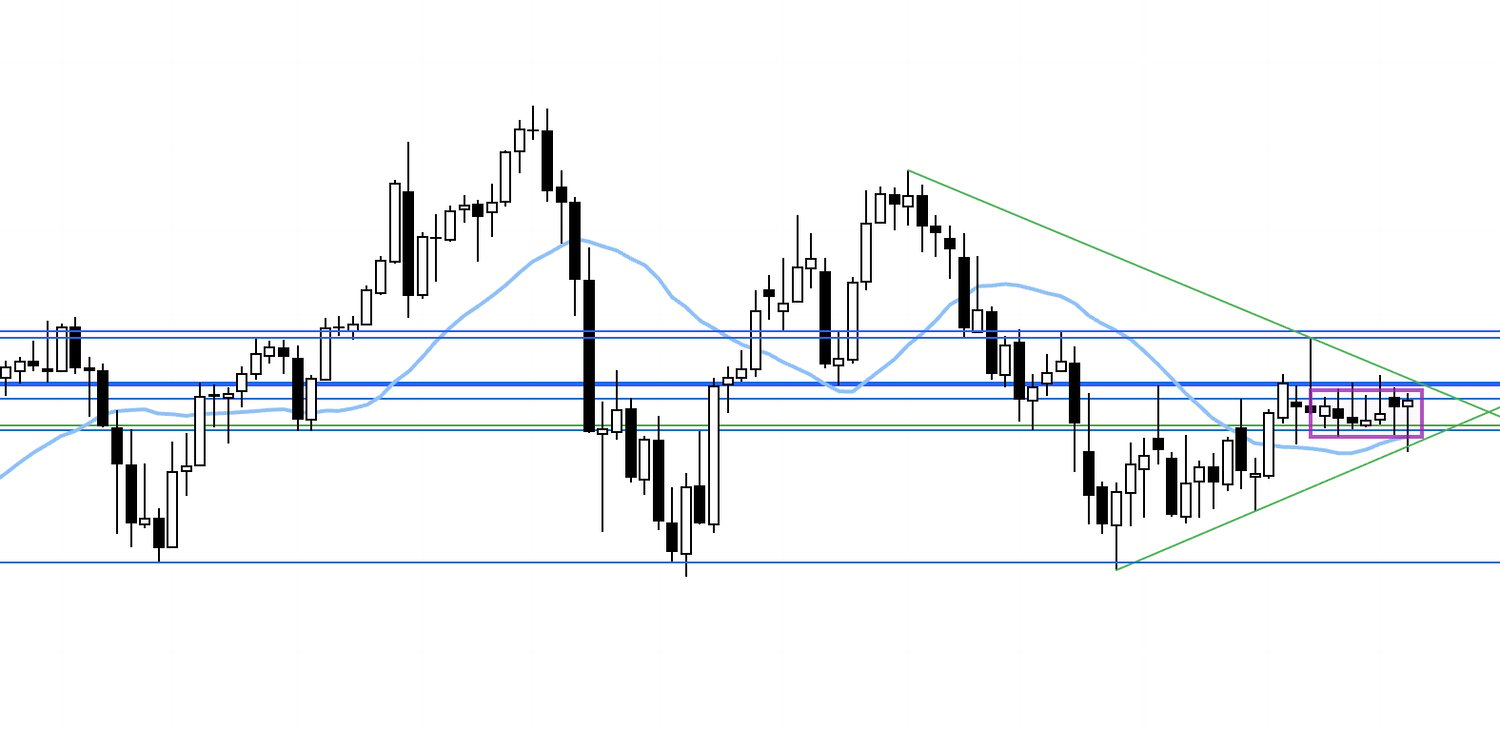
Daily
USDJPY has been range‑bound since August, and I prefer to consider trades only after a clear break either way.
Let’s also check the weekly.
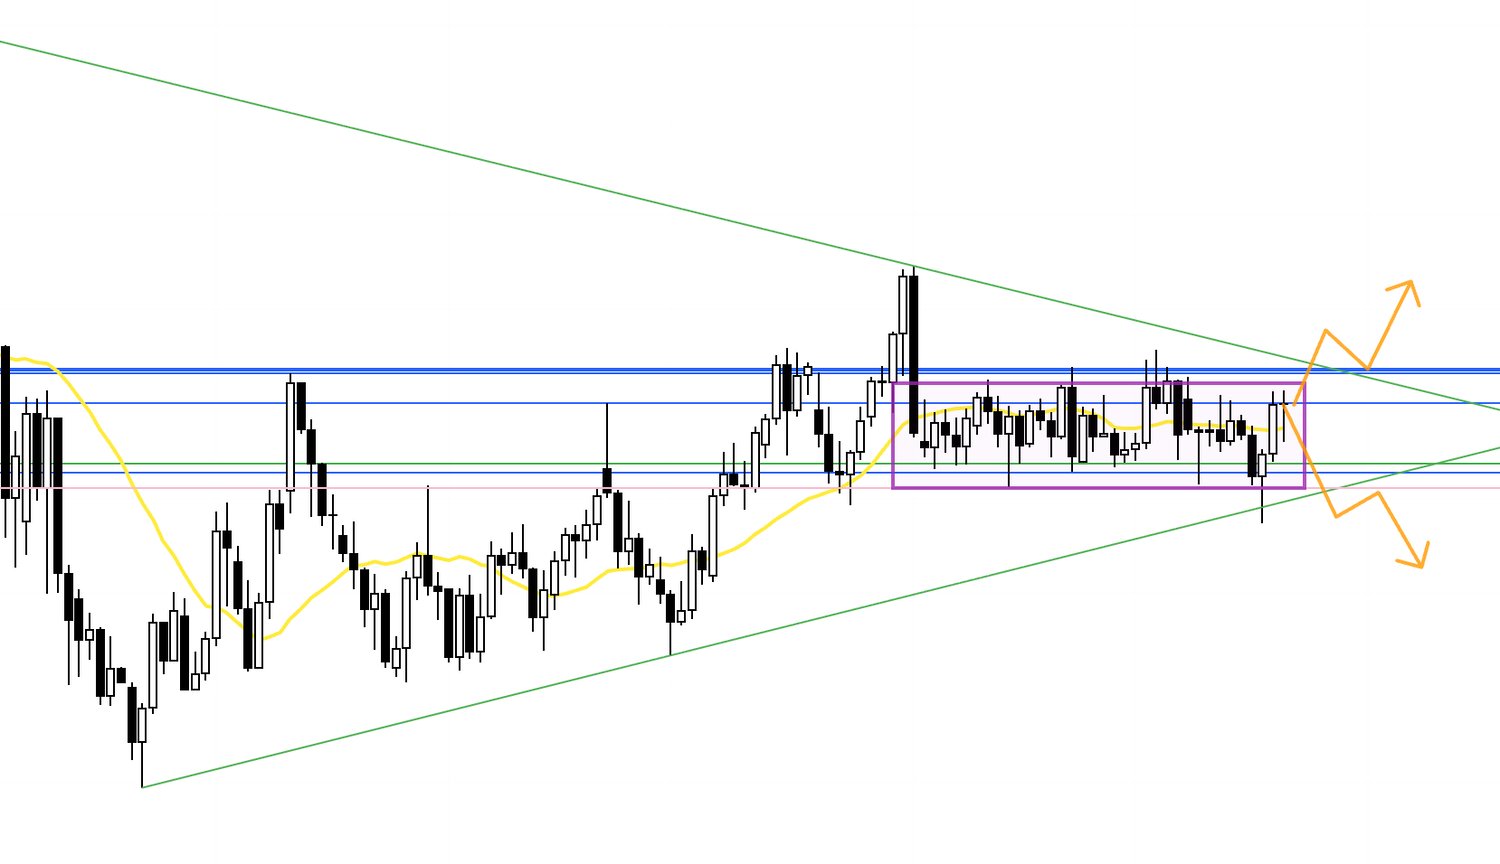
Weekly

On the weekly, it is still undecided whether price holds above the moving average and builds higher lows, or rolls over with lower highs.
As traders, we do not "predict" the direction of the break.
We wait to see how it resolves and trade in the direction that offers an edge.
If it breaks higher, we buy the dip.
If it breaks lower, we sell rallies.
What matters is not prediction but having a scenario and waiting for it.
Now let’s look at EURUSD.
〜・〜・〜・〜・〜・〜・〜・〜・〜・〜・〜・〜・〜・〜・
EURUSD
Daily
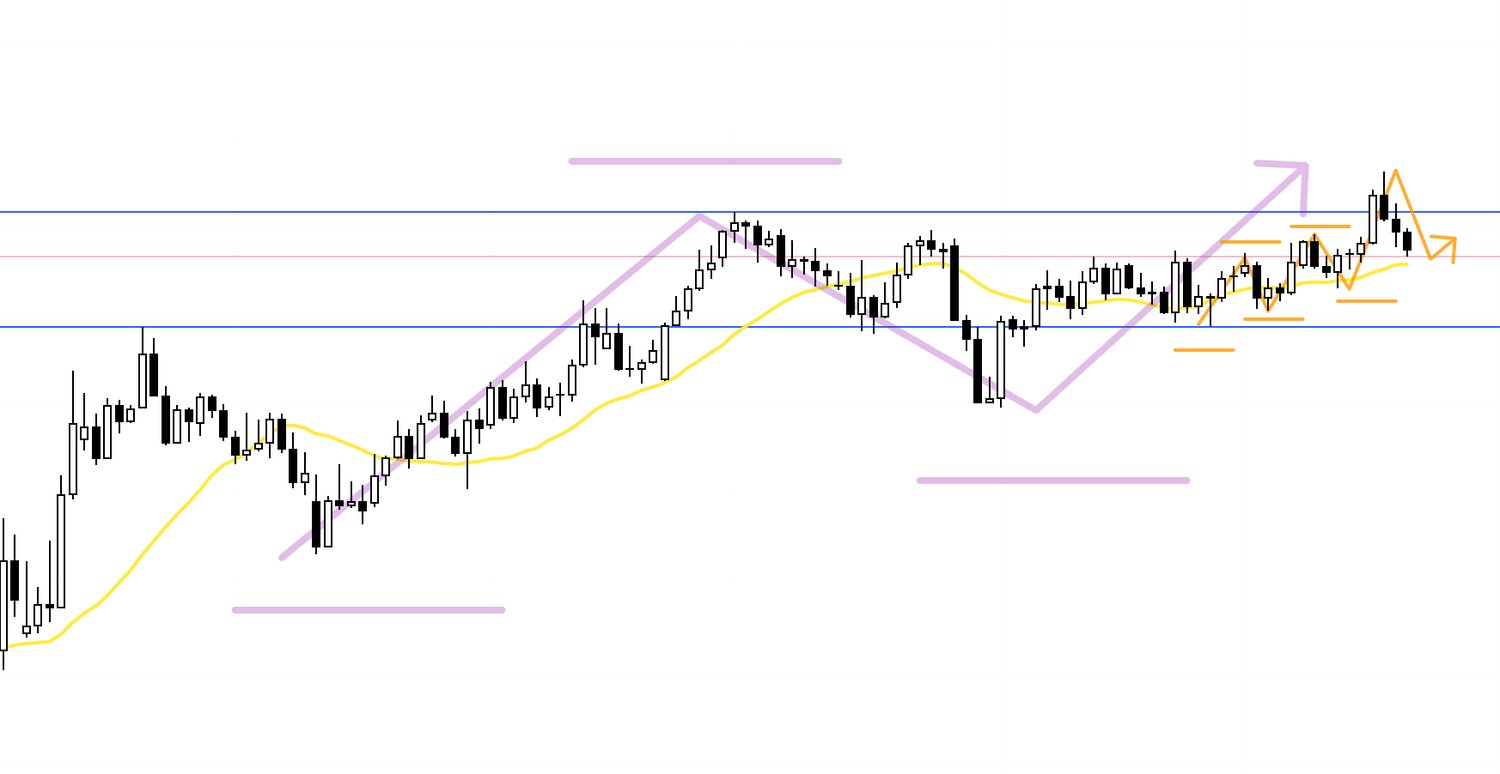
On the daily, price is making higher lows and higher highs, in an uptrend.
The pale purple overlay on the daily chart represents the weekly structure.
On the weekly, the uptrend continues with higher lows as well.
On the long side, the straightforward play is to buy the dip.
On the short side, you must be mindful of the buy‑the‑dip areas on both the daily and the weekly.
With that in mind, let’s examine the 4h.
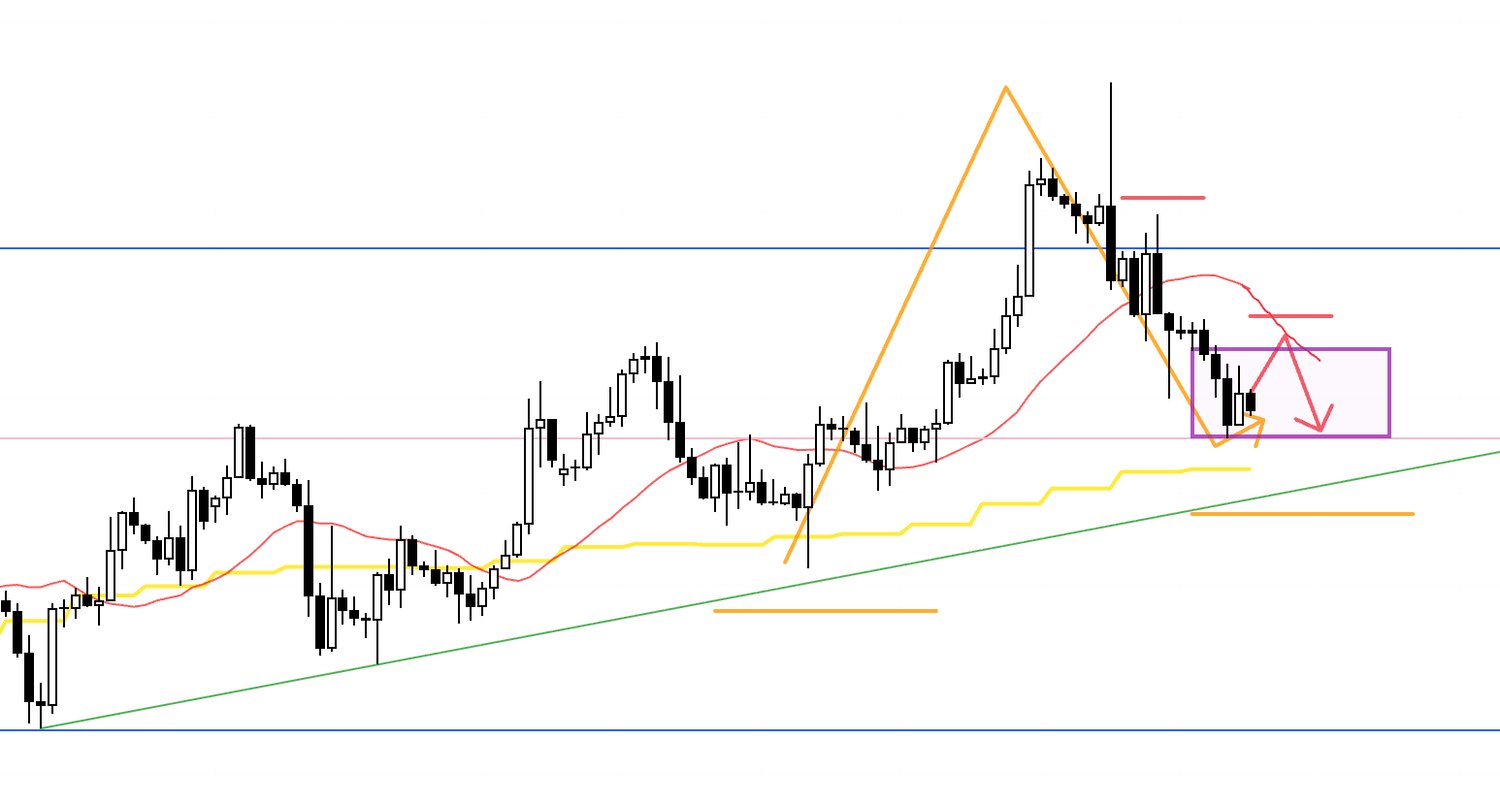
4h
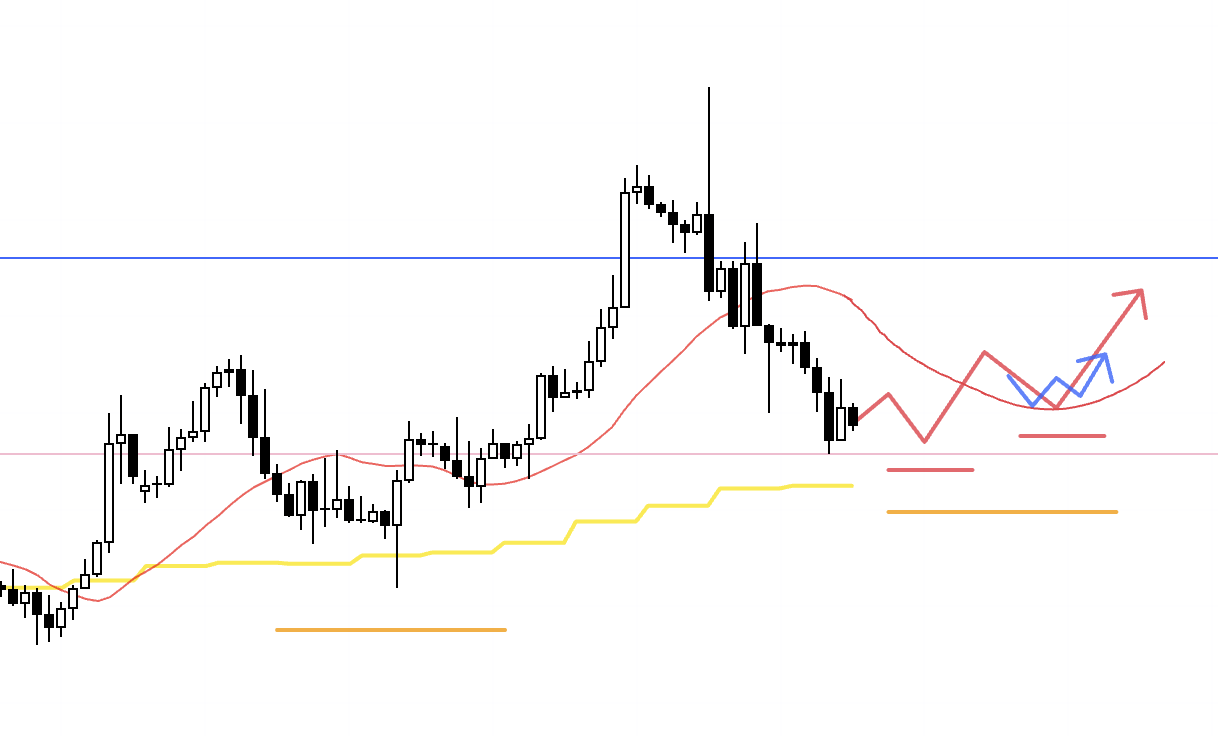
At the moment, the 4h is in a downtrend, so there is no immediate long setup.
The moving average in red is capping price from above, and even if we bounce, sellers on rallies are active.
That does not mean we can short indiscriminately, because we are also sitting in a daily buy‑the‑dip area.
The daily moving average in yellow is providing support from below, leaving us in a zone where the 4h downtrend and the daily buy‑the‑dip forces are in balance.
In this setup, I look for the 4h to end its downtrend and turn back up, and then I target the turn point on the lower timeframes.
If, as in this chart, the daily buy‑the‑dip produces a higher low and the 4h also forms a higher low at that area, I consider entries on the lower timeframes.
Ideally this coincides with price reclaiming the moving averages that had been suppressing it and then finding support from below.
4h
The daily remains in an uptrend and continues to print higher lows.
A green trendline connecting those higher lows, together with the daily moving average in yellow, sits just below.
Even if the 4h prints a lower high, shorting immediately would be high risk here.
I do not take that kind of short.
4h
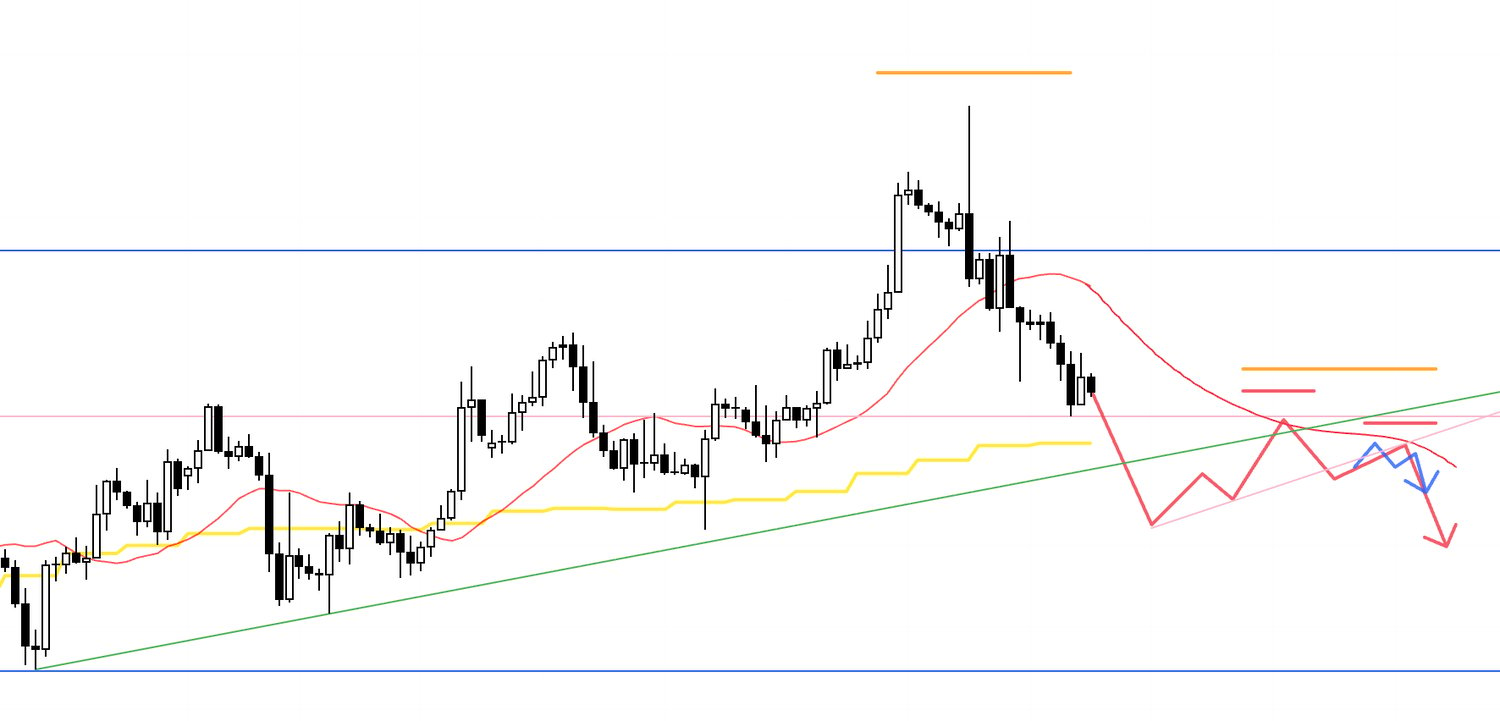
For shorts, I want to see price break below those trendlines and the daily moving average in yellow.
I also want a newly established lower high that is visible even on the daily.
If, within that structure, the 4h forms its own lower high, I will look for shorts on the lower timeframes.
Note that below that lies the weekly buy‑the‑dip area marked by blue lines, which warrants caution.
〜・〜・〜・〜・〜・〜・〜・〜・〜・〜・〜・〜・〜・〜・
That is all.
These are scenarios as of now, and I will refine or rebuild them as the week begins and price action unfolds.
Each week I size up risk the same way, map scenarios the same way, and repeat the same kinds of trades.
Whatever the chart does, I wait for spots with an edge and trade only there, so how the chart moves is not a problem.
When the market is in a range, like USDJPY recently, I don’t force myself to trade.
I also don’t feel any unnecessary sense of responsibility such as “I must do something,” nor do I change my rules or think, “How can I increase the number of trades?”
Whether my recent trade count is low, or I lost last time, or won, none of that dictates my next action.
I fully accept in advance that trade frequency can drop or spike depending on market conditions.
I do not judge results on the basis of a few months.
I keep repeating the same behavior throughout the year because I am convinced that, over time, this is what leaves profits.
Trading comes down to maintaining a long‑term perspective and repeating consistent behavior with an edge.
Build scenarios in advance and trade only there, absolutely.
I hope the importance of that repetition comes through.
These trade scenarios are my personal plan.
If you have not yet settled on a trading approach, feel free to use them as reference points for building your own strategy.
If you already have a defined approach, do not let my plan distract you from following your rules.
Thank you for reading.