


I will recap this week’s trading with a focus on the key setups I worked through.
This “Weekly Trade Report” is published every Saturday.
If you read it alongside the “Trade Scenarios” I post every Sunday, you can see how I frame markets in advance and then execute in line with those scenarios.
This is not advice on “how you should trade,” nor am I claiming this is the right answer.
It is not about showcasing wins and losses, nor about recommending a specific strategy based on those results.
My goal is to demonstrate, at a practical level, the “consistency of process” in how I repeatedly execute a scenario-driven playbook, so you can use it as a reference for building your own strategy and process consistency.
The results are solely my own and do not guarantee your future profits.
With that firmly in mind, conduct thorough testing and preparation for your own trading, and act solely at your own risk and responsibility.
I trade buy-the-dip and sell-the-rally setups on the 4h timeframe.
For my pullback-buy and rally-sell methodology, please refer to my prior blog posts on Dow Theory and multi-timeframe analysis.
Let’s turn to the charts.
USDJPY 4h
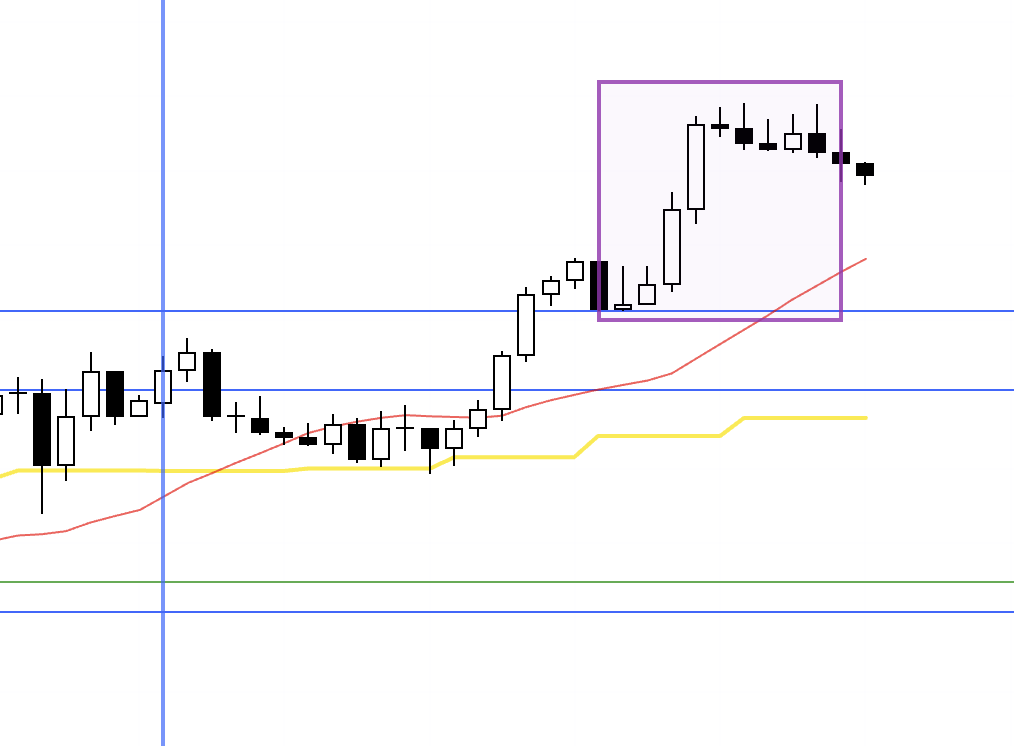
This is the USDJPY 4h chart.
This week’s action is shown to the right of the blue vertical line on the chart.
USDJPY finally broke out of a prolonged range.
The area I considered for a trade this week is boxed on the chart.
It was the pullback I had been waiting for after the range break, but a macro data release hit immediately afterward, so I did not enter.
While the subsequent rally certainly rode the event impulse, this level also carried a clear technical edge to the upside.
With the range now resolved, I will wait for the next pullback.
Next, please see the EURUSD chart below.
EURUSD 4h

This is the EURUSD 4h chart.
There was one spot this week where I considered a trade in EURUSD.
However, as with USDJPY, the setup came right before the event, so I did not take it.
As a result, I did not place trades in either USDJPY or EURUSD this week.
That said, both zones printed as very clean, high-quality entry locations on the charts, and absent the event timing, these would be must‑take trades for me.
Here is the breakdown for each.
〜・〜・〜・〜・〜・〜・〜・〜・〜・〜・〜・〜・〜・〜・
First, let’s look at the USDJPY 1h chart.
1h
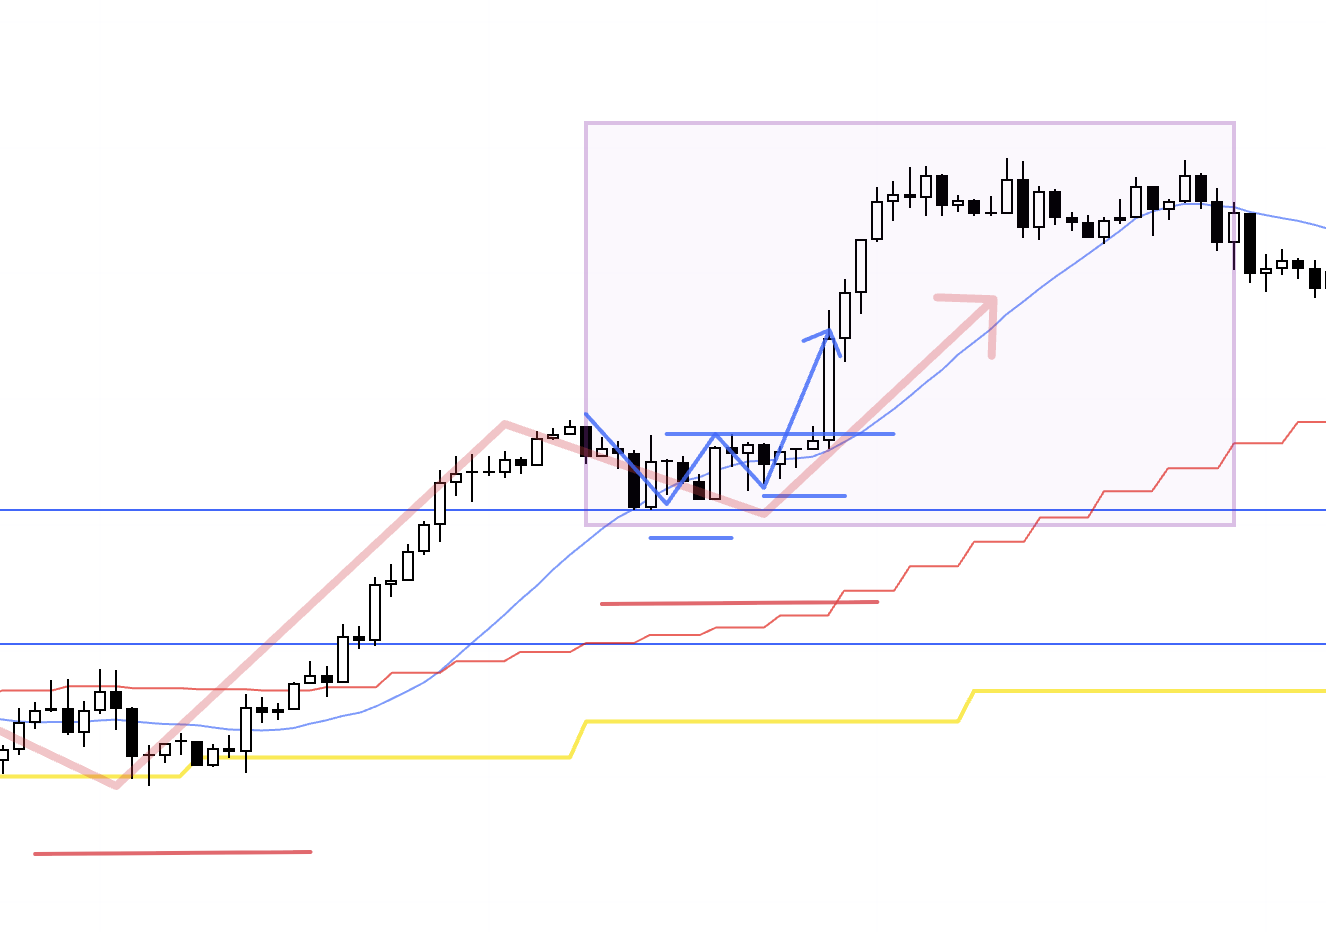
On the 1h, after the range break, price formed the first 4h pullback with a higher‑low pivot (in red), and within that structure the 1h also printed higher lows and a higher high (in blue), so the entry would be on the 1h breakout.
1h
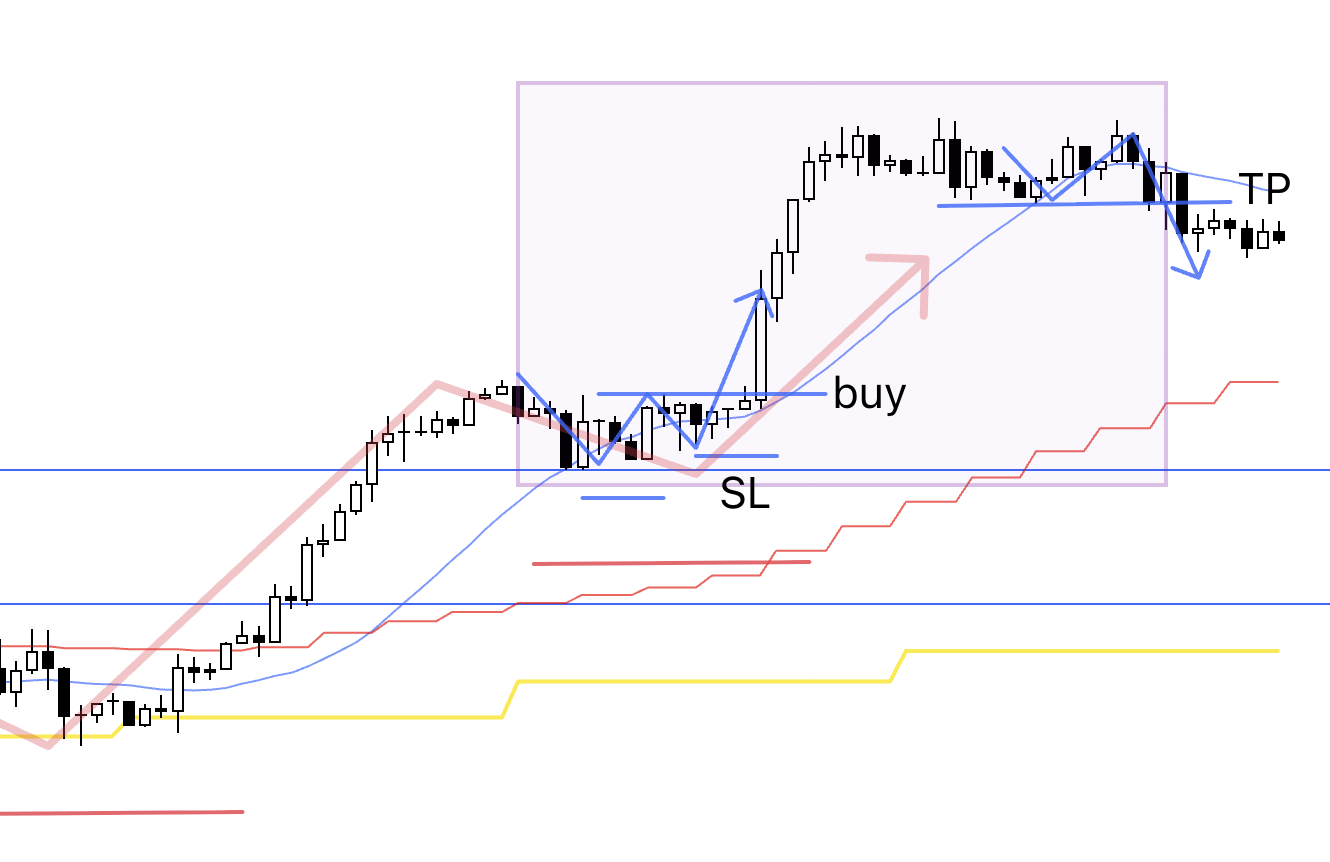
Per my rules, I would then trail the stop up to each higher‑low pivot and exit on a trend break, so had I taken the trade, I would likely have closed it around the points marked on the chart.
When this pattern appears, I am obliged to take it.
My trading is the repetition of this pattern and nothing else.
Now let’s turn to EURUSD.
1h
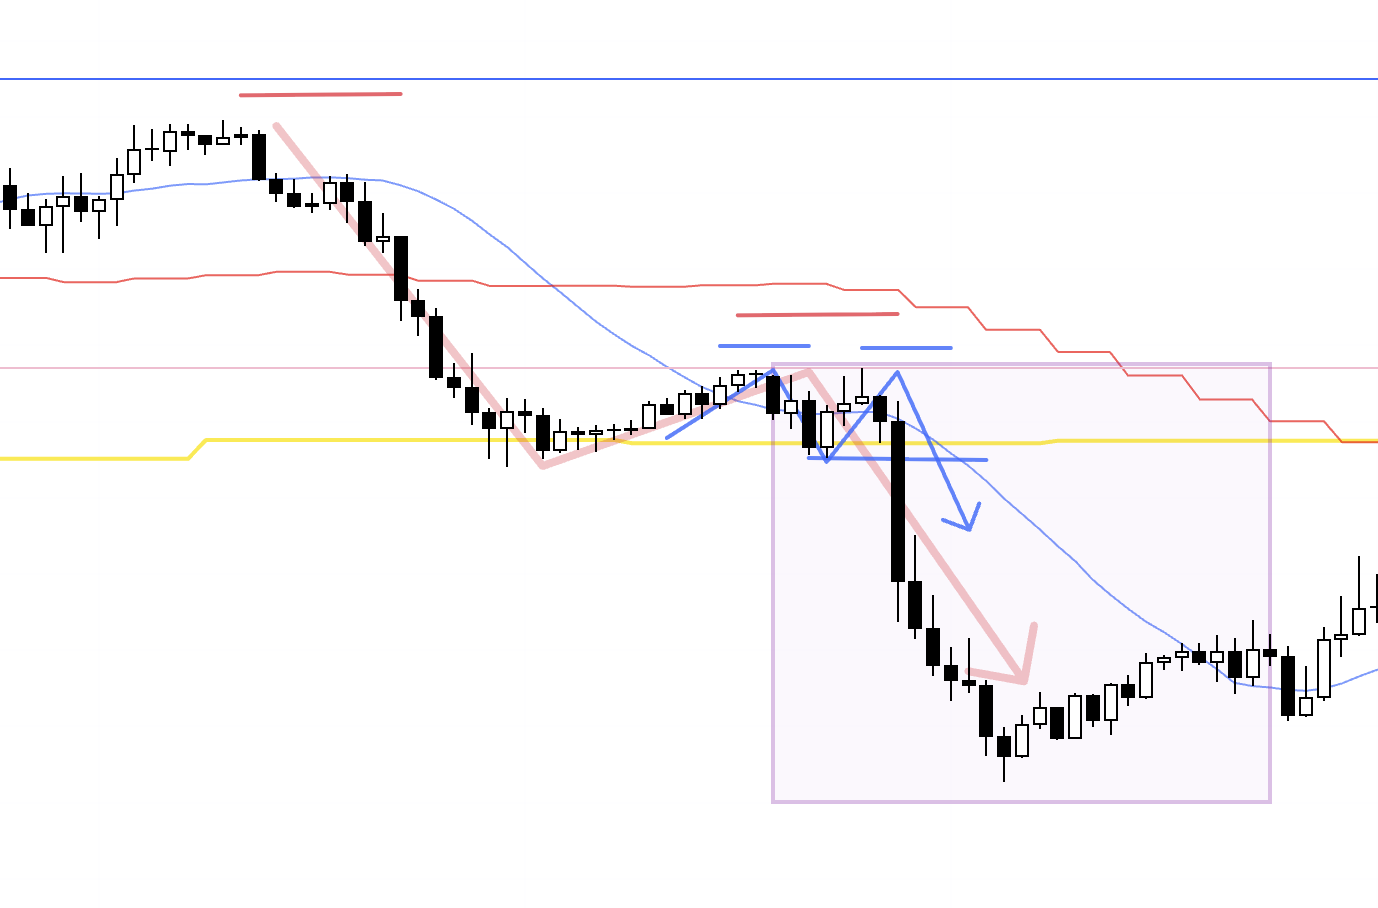
This is essentially the mirror image of the earlier USDJPY chart.
EURUSD printed a clear double top on the daily while the weekly high (blue line) capped price.
Within that, the 4h carved out a lower‑high pivot (in red), and the lower timeframe 1h made lower highs and a lower low (in blue), which in principle makes this a textbook entry.
1h
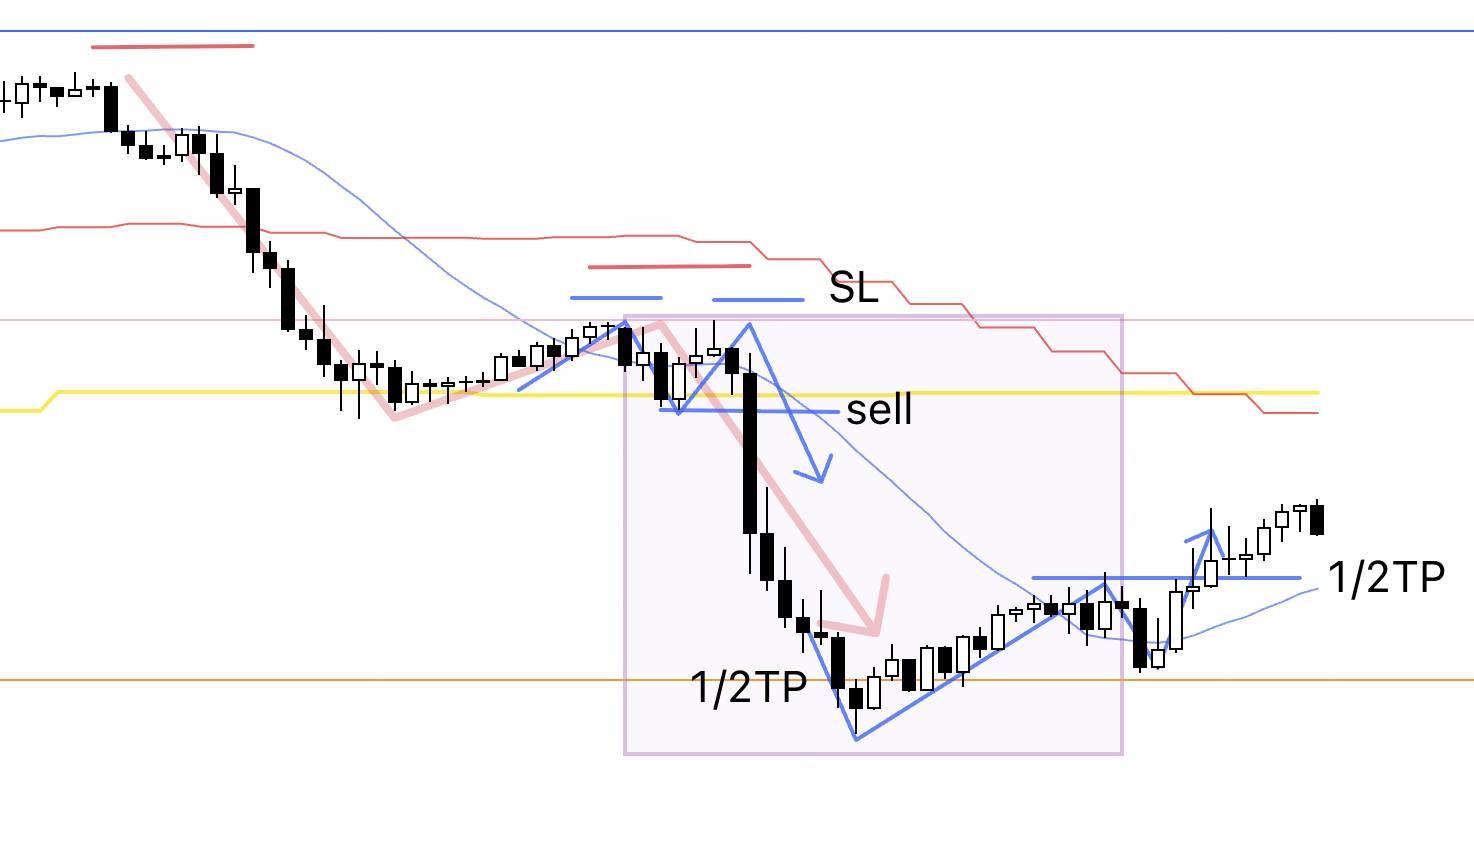
However, as outlined in last week’s scenarios, this downswing required caution around the weekly buy‑the‑dip area.
Accordingly, had I entered, I would have taken half off at the daily low (orange line), then closed the remaining half when the trend broke.
While it is easy to say this after the fact given I did not execute, this is the same trade I run every time under a consistent decision framework.
〜・〜・〜・〜・〜・〜・〜・〜・〜・〜・〜・〜・〜・〜・
That’s all for this week.
Although there were no executed trades to dissect, this blog emphasizes the consistency of the scenario‑first process I follow, and “not trading” is an equally important decision within that framework.
It is by adhering to our rules and repeating consistent actions over time that the law of large numbers works in our favor and allows our edge to emerge.
Stay patient and keep executing the same process.
I hope this was helpful.