
Proportional or Non-Proportional Relationships Digital Sorting Activity | Graphs | Google Slides
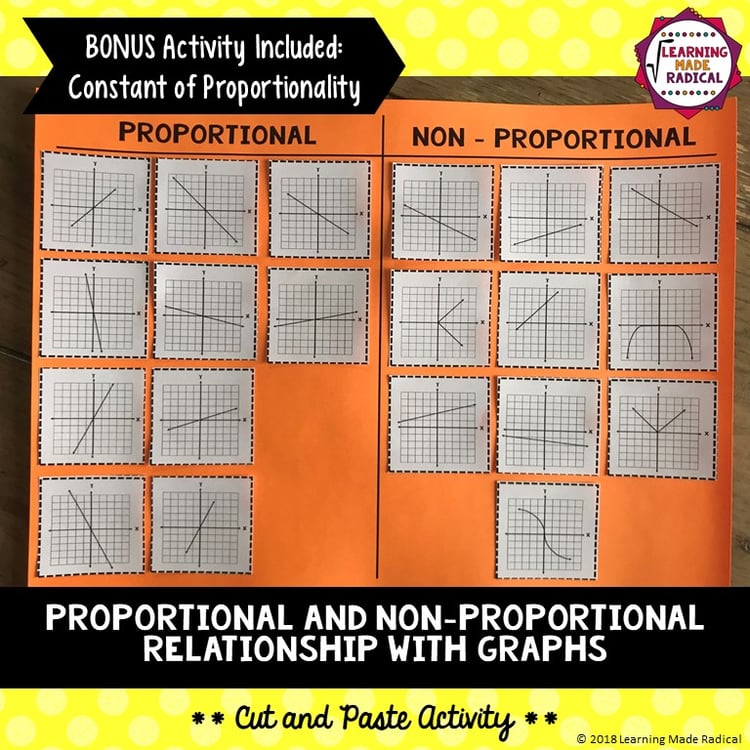
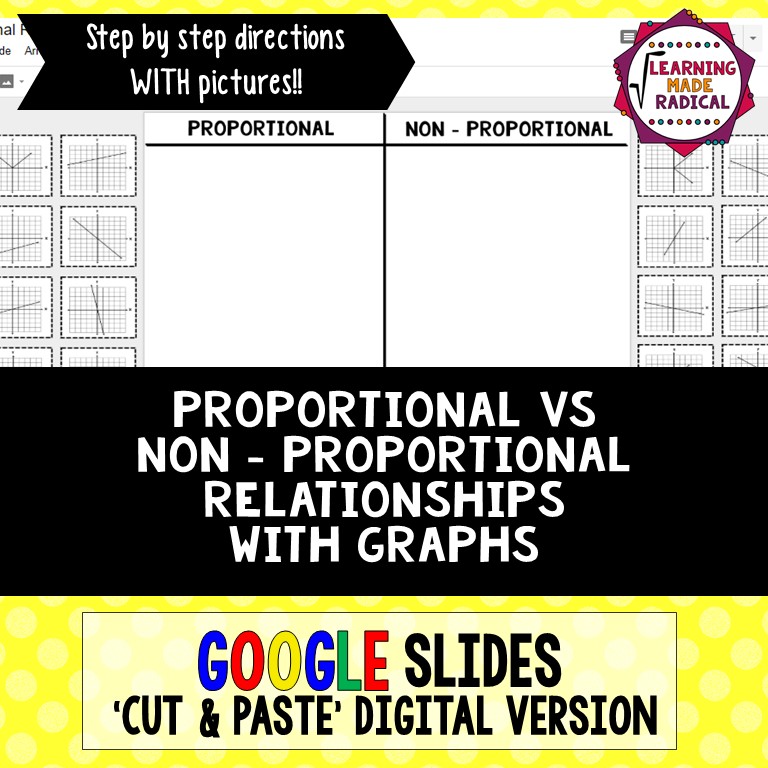
Practice sorting proportional and non-proportional relationships with this Proportional and Non-Proportional Graphs Google Slides Activity. Students look at each graph and move the digital pieces into the correct category: proportional or non-proportional.
This activity includes 20 graph cards total, with 10 proportional relationships and 10 non-proportional relationships. Students can complete the activity independently, with partners, during centers, or as a digital review activity.
The digital format is a great option for adding technology to your classroom and can be used on a laptop, PC, tablet, or phone with access to a free Google account.
Please note: Teachers and students will need a free Google account to access and use this Google Slides activity. A sign-up link is included in the document if needed.
Teacher directions with pictures are included to help you access and assign the Google product. Please note that the slides are not editable and are set to “Can View” only.
A bonus activity is also included. Students can use the blank slide with the proportional relationships to find the constant of proportionality. Text boxes are included so students can type their answers directly on the slide.
What’s Included:
• Teacher directions for accessing the Google Slides activity
• Picture directions for setup
• 10 proportional relationship graph cards
• 10 non-proportional relationship graph cards
• Digital sorting activity
• Blank student answer sheet
• Completed teacher answer key in teacher notes
• Bonus constant of proportionality activity
• Student answer text boxes on the bonus slide
• Google Slides link included
Perfect for:
• Proportional relationships
• Non-proportional relationships
• Sorting graphs
• Constant of proportionality
• Digital math activities
• Google Slides math practice
• 7th grade ratios and proportional relationships
• CCSS 7.RP.A.2
• Partner practice
• Independent practice
• Math centers
• Review
Sorting graphs helps students recognize that proportional relationships pass through the origin and show a constant ratio, while non-proportional relationships do not.
Join my mailing list and you’ll also get access to my FREE Resource Library filled with resources you can use right away.
Sign up here → Click Here to Sign Up
Stay Connected
You can also connect with me here:
Click here to Follow me on Facebook
Click here to Follow me on Instagram
Click here to Follow me on Pinterest
Terms of Use
This resource is for one teacher only. Additional teachers will need to purchase their own license. You may use this resource with your own students in your classroom or password-protected learning platform.
Please do not share, post, copy, sell, or upload this resource anywhere that others can access it.
If you need additional licenses or have questions, please contact me at learningmaderadical@gmail.com.
© 2026 Kara Holland. All rights reserved.