Kitson Risk-of-Ruin Simulator: Losing Streaks, Drawdowns and Ruin on Your Own Assumptions (Opus 5.5)
Simulate your own assumed win rate, payoff and risk per trade: losing streaks, drawdowns, time under water and how often runs reach your ruin level.
Type your own assumed figures: a win rate with an average win and an average loss in R, or a list of your own past results in R. Add the risk per trade from your own plan, the number of trades, your ruin level and the drawdown levels you care about.
Risk-of-Ruin Simulator runs thousands of simulated sequences of trades in code on your own computer, with seeded random numbers so the same figures always give the same results:
- the share of simulated runs that reached your ruin level and each drawdown level;
- the spread of the largest drawdown, the longest losing streak and the time spent under water, and a percentile fan of the balance;
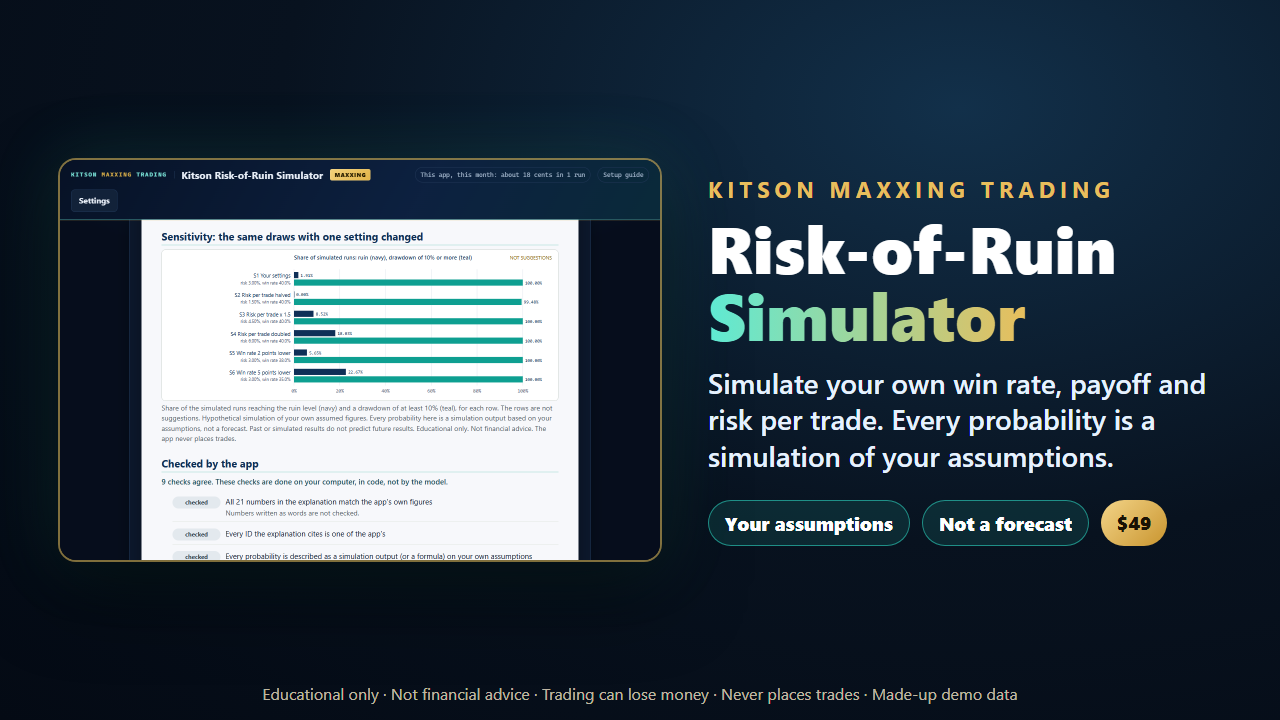
- the same draws again with the risk halved, x 1.5 and doubled, and with the win rate 2 and 5 points lower, to show how fragile your assumptions are;
- checks of the simulation against exact formulas where they exist: the expectancy, the exact ruin probability, the long-run ruin bound and the exact losing-streak probabilities.
Claude Opus 5.5 then explains in plain words what drives the risk in your figures, how fragile they are and how the simulation compares with the formulas, and asks you questions.
What makes it different
- Every probability is a simulation output on your own assumptions, never a forecast. It is labelled that way everywhere, and the app asks for a rewrite if the explanation gives a chance without saying it comes from the simulation of your figures, or speaks of it as the future.
- Your risk, your numbers. It never recommends a risk per trade, a size or a sizing method, and the "what if" rows are labelled as not suggestions. If the explanation drifts into advice, forecasts or promises, the app catches it and asks for a rewrite.
- The simulation is checked against the maths, and every number in the explanation is checked in code against the app's own figures. The result of both checks is shown to you.
- Nothing leaves your computer but the app's figures and your question. A list of past results stays here, and you can see exactly what will be sent before anything goes.
- The cost is shown before every run, and you set a limit. In our own test on the made-up sample, a run cost about 18 cents on our own Anthropic account, and one change about 7 cents more. That run included one automatic rewording request caused by a false alarm in the app's wording check, since fixed; the cost has not been measured again. The simulation itself is free.
- A Word report and an Excel file of your assumptions, the results, losing streaks, the balance fan, the sensitivity rows, the formula checks and the first 500 runs, with three charts.
What you need
- Free Node.js 18+ (Windows, Mac or Linux).
- Your own Anthropic account and API key, with a little credit. A Claude chat subscription does not include API access.
- No files and no market data: you type your own figures, or use the made-up samples.
You pay Anthropic directly for what you use, on top of the price of the app.
Educational only. Hypothetical simulation of your own assumed figures. Every probability here is a simulation output based on your assumptions, not a forecast: real trades are not independent draws with a fixed win rate, and real results can be worse than any simulated run. Past or simulated results do not predict future results. Not financial advice. It does not recommend any risk, size or trade. The app never places trades. Trading involves risk of loss. If we can't get the app running for you, email kit376351@gmail.com within 14 days for a refund of the app price. Kitson Workshop is not affiliated with or endorsed by Anthropic.