Kitson Chart and Indicator Tutor: What Indicators Show, How They Lag and How They Are Misread (Opus 5.5)
Learn what chart indicators really show, how much they lag and how they are misread, worked out on your own price file.
Add your own historical price file (CSV: date, open, high, low, close; volume too if you have it) or use the made-up sample. The market is always shown under a made-up name. Tick the indicators you want to learn: SMA, EMA, RSI, MACD, Bollinger Bands, ATR, the stochastic oscillator, VWAP and support and resistance from swing points.
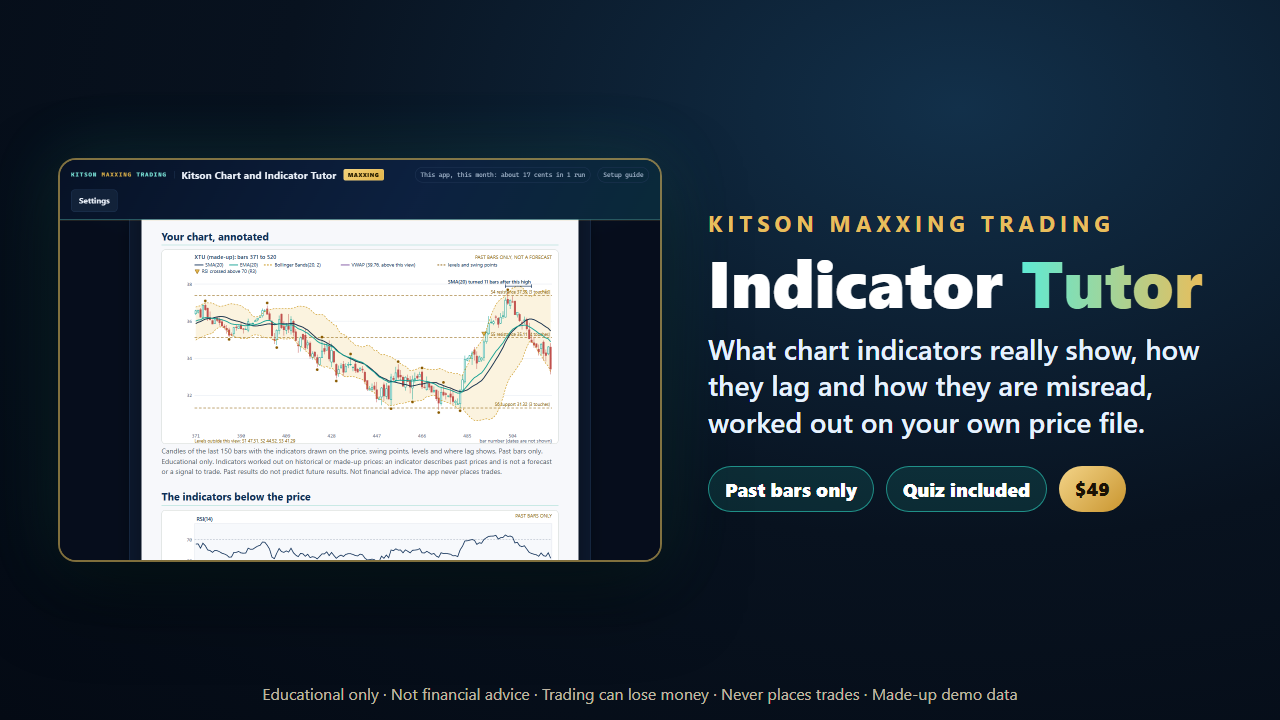
Chart and Indicator Tutor works every one of them out in code on your own computer, with each formula and its source stated, and draws an annotated chart. Then it teaches, on your own file:
- what each indicator measures, and what it shows on this chart;
- how much it lags, measured: how many bars it took to turn after the price turned;
- how its setting changes it: half, as set and double, side by side;
- twelve common misreadings, such as "RSI over 70 means the price must fall", with a count of how often the move each one expects did and did not follow on your file's past bars, set beside all bars of the file.
A short quiz made from your file's own figures, marked by the app, and a glossary help it stick. Claude Opus 5.5 then explains what the indicators show on this chart, takes up every misreading and asks you questions to reflect on.
What makes it different
- The historical counts describe the past only. They are counts of what followed on your file's past bars, not odds and not a test of a strategy: the windows overlap, the counts are often small, and every line, table and explanation says so.
- It never calls anything a buy or sell signal, never says an indicator works, and never says what happens next. If the explanation drifts into advice, forecasts or promises, the app catches it and asks for a rewrite.
- The maths is done in code, not by the AI, checked in our tests against a published worked example of Wilder's RSI, with a check that no indicator reads later bars.
- Every number in the explanation is checked in code against the app's own figures, and the result of that check is shown to you.
- Your price file stays on your computer. No date or row is sent: Anthropic is sent the app's own figures (which include some price levels) and your question, and you can see exactly what will be sent before anything goes.
- The cost is shown before every run, and you set a limit. In our own test on the made-up sample with all nine indicators ticked, a run cost about 17 cents on our own Anthropic account, and one change about 14 cents more. The quiz is free.
- A Word report and an Excel file of every indicator, lag, setting, misreading count, level, the quiz and every bar with its indicator values, with three charts.
What you need
- Free Node.js 18+ (Windows, Mac or Linux).
- Your own Anthropic account and API key, with a little credit. A Claude chat subscription does not include API access.
- Your own historical price file (date, open, high, low, close; volume optional; 100 to 5,000 bars), or use the made-up sample in the zip.
You pay Anthropic directly for what you use, on top of the price of the app.
Educational only. Indicators worked out on historical or made-up prices: an indicator describes past prices and is not a forecast or a signal to trade. The historical counts describe the past only. Past or simulated results do not predict future results. Not financial advice. It does not recommend any trade. The app never places trades. Trading involves risk of loss. If we can't get the app running for you, email kit376351@gmail.com within 14 days for a refund of the app price. Kitson Workshop is not affiliated with or endorsed by Anthropic.