Event Budget & Ticket Break-Even Calculator: Event Budget Spreadsheet with Ticket Pricing
Full description
For event organisers, conference and festival producers, venues and associations who sell tickets and need to know the break-even point before they commit money. You list your costs, ticket tiers and sponsors once. The workbook calculates the average net revenue per attendee after fees and tax, the break-even attendance, the profit at every sales level and how far your weekly sales are ahead of or behind target.
Save with a bundle: this template is also in the Events & Weddings Bundle, 10 templates for $29 instead of $67. All 141 templates are in the All-Access Hospitality Template Library for $79.
What is inside
- Event_Budget_Ticket_Break_Even_Calculator.xlsx: 9 tabs, 1,147 formulas, 5 native charts, 12 drop-down or number rules. No macros.
- Settings: event and report dates, capacity, forecast attendance, ticket processing fee, sales tax, contingency, other income per attendee, sponsorship rule, warning levels, 12 cost categories and a sponsor status probability table.
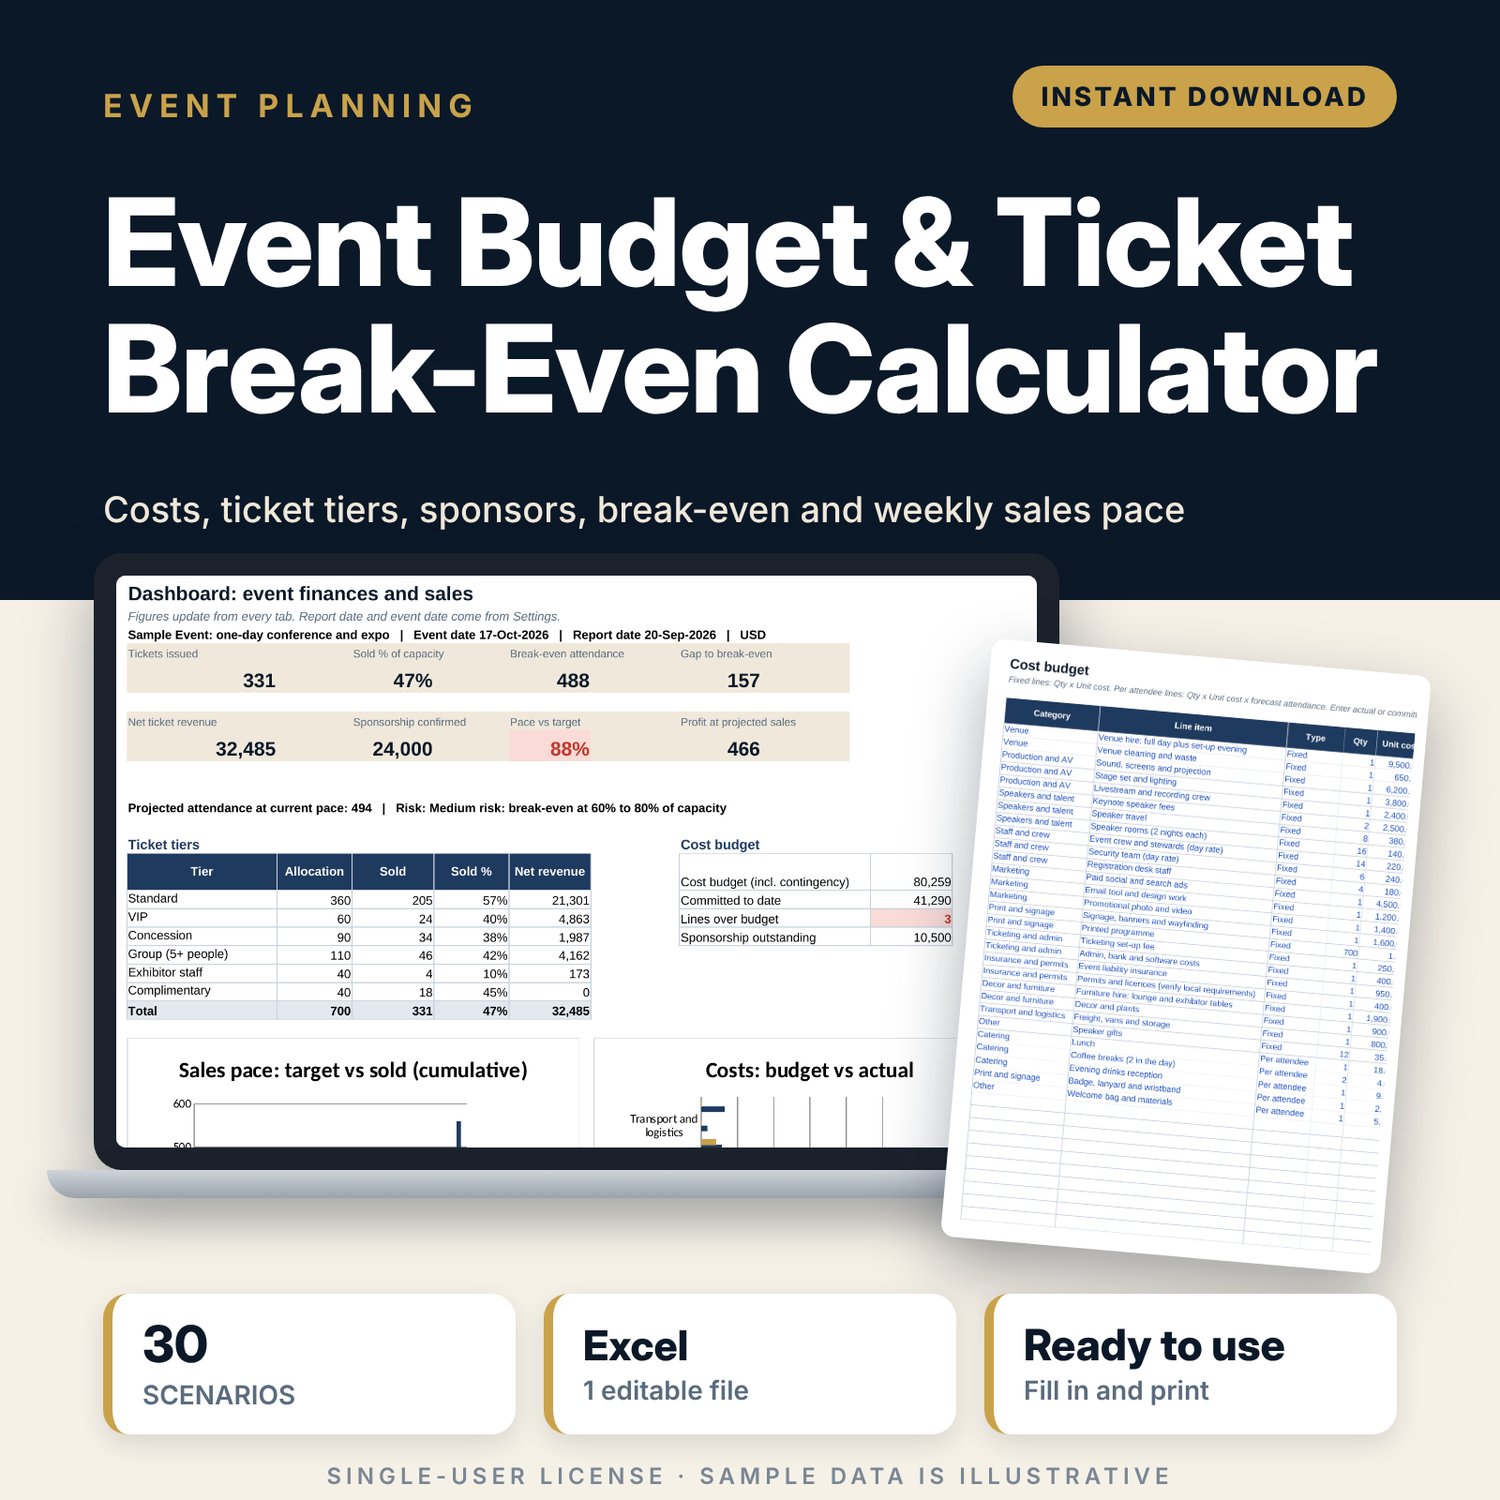
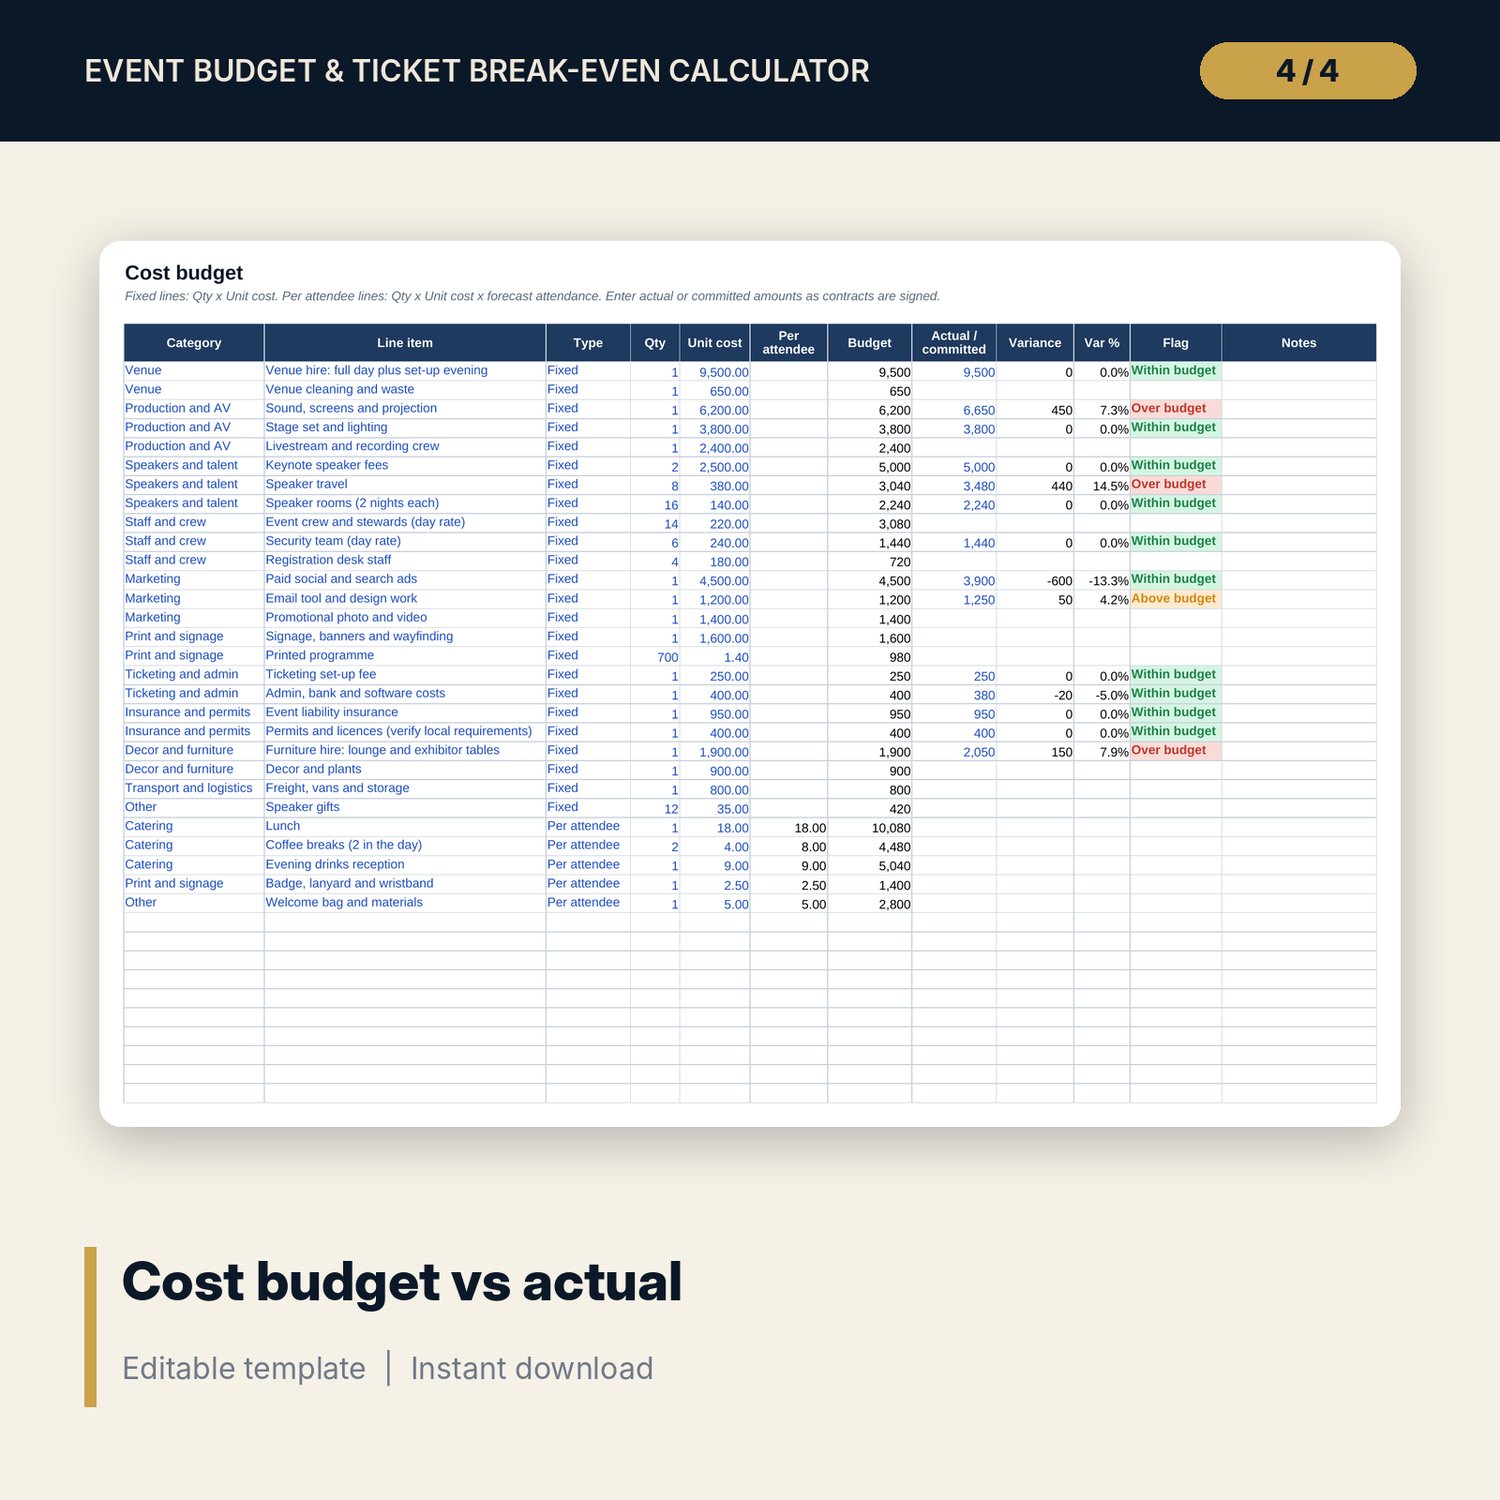
- Costs: room for 80 cost lines (29 sample lines), each fixed or per attendee, with budget, actual or committed amount, variance and an over-budget flag.
- Tickets: 6 ticket tiers with full price, early-bird price and end date, allocation and planned mix. Early-bird and full-price sales, net revenue and sold % fill in from Sales_Pace.
- Sponsors: room for 30 sponsors (10 sample rows) with package, cash and in-kind value, status, probability, weighted value, payments and flags.
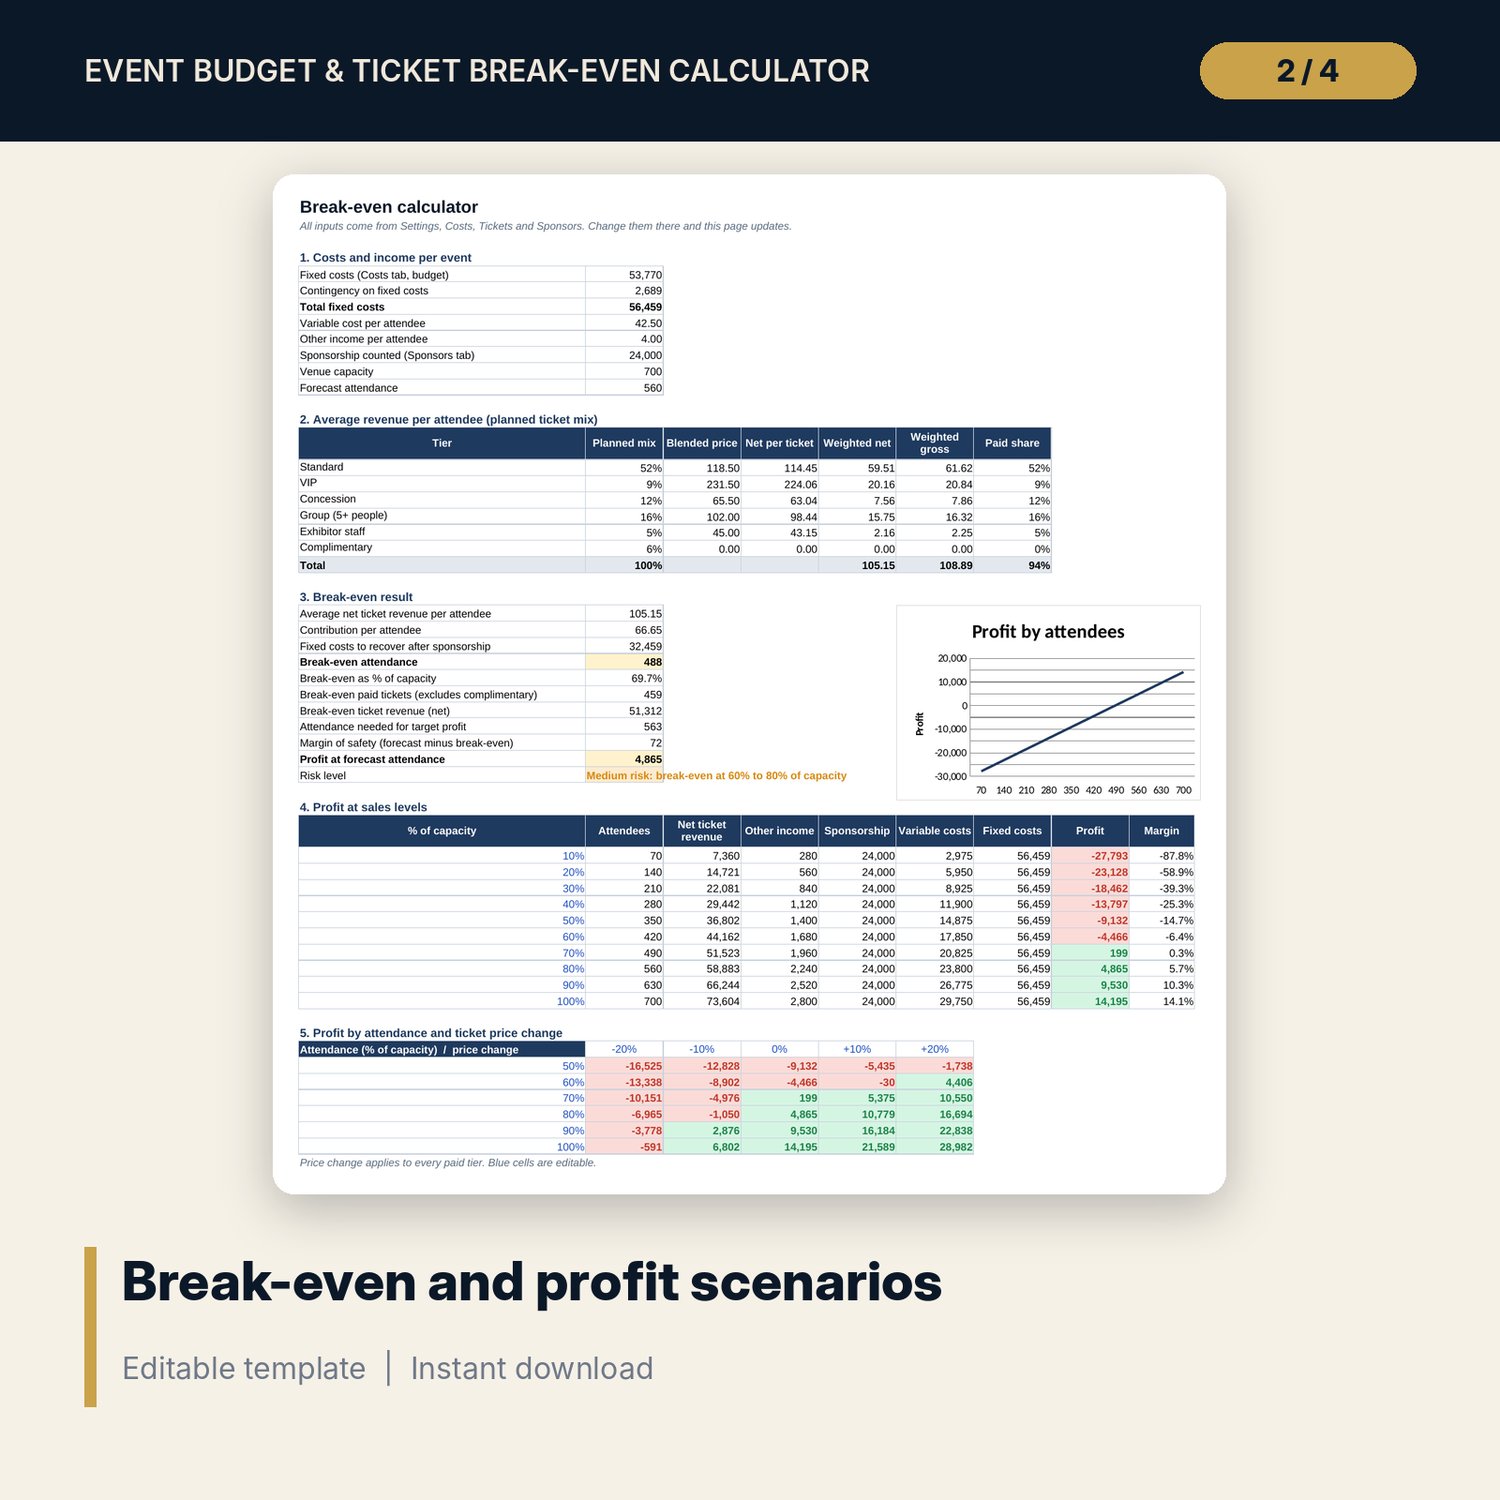
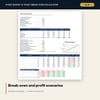
- Break_Even: average net revenue per attendee, contribution, break-even attendance and paid tickets, attendance for a target profit, a risk level, profit at 10 sales levels and a 30-scenario grid of attendance against price change.
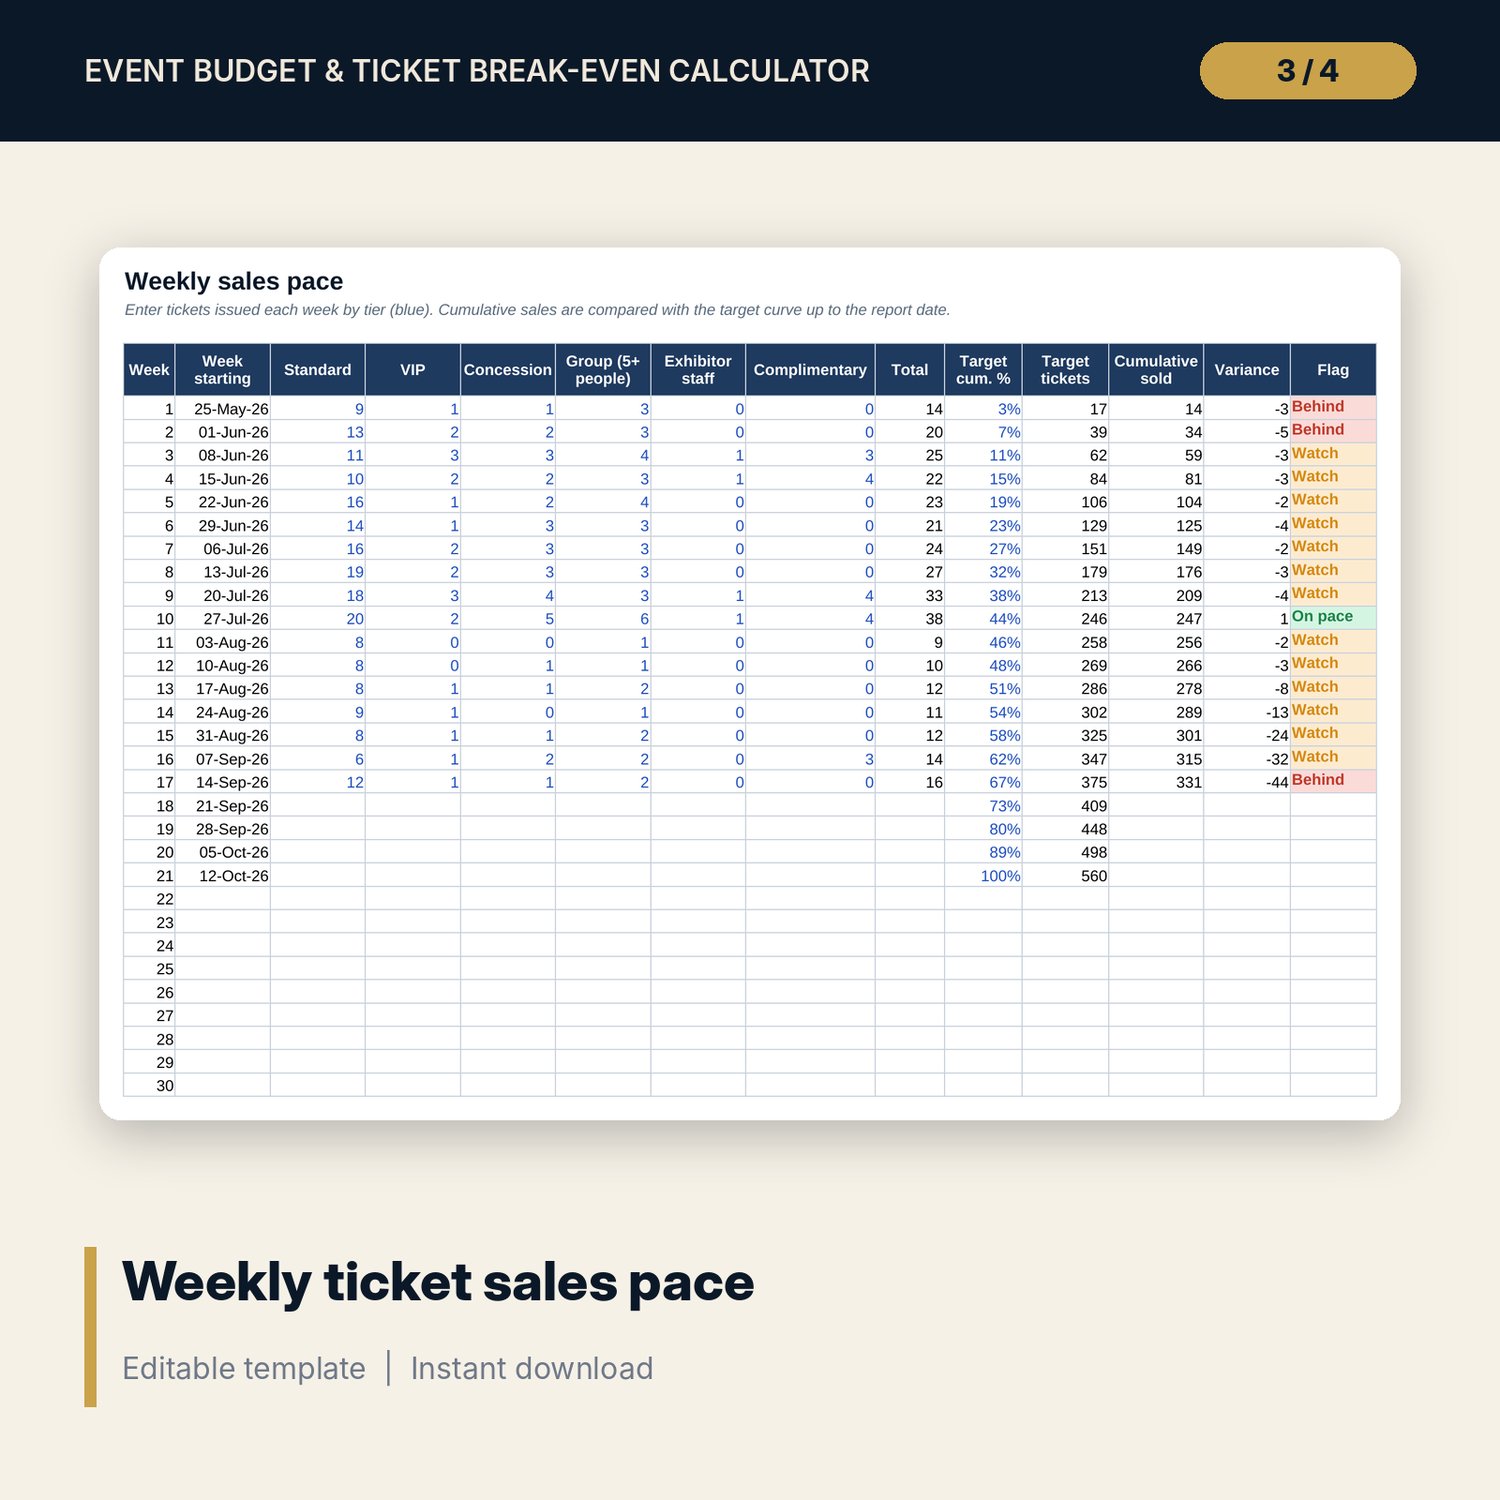
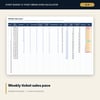
- Sales_Pace: 30 weekly rows with tickets by tier, a cumulative target curve (21 sample weeks, 17 weeks of sample sales), variance and a pace flag.
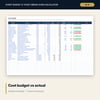
- Budget_vs_Actual: costs by category and income lines against budget, with a chart.
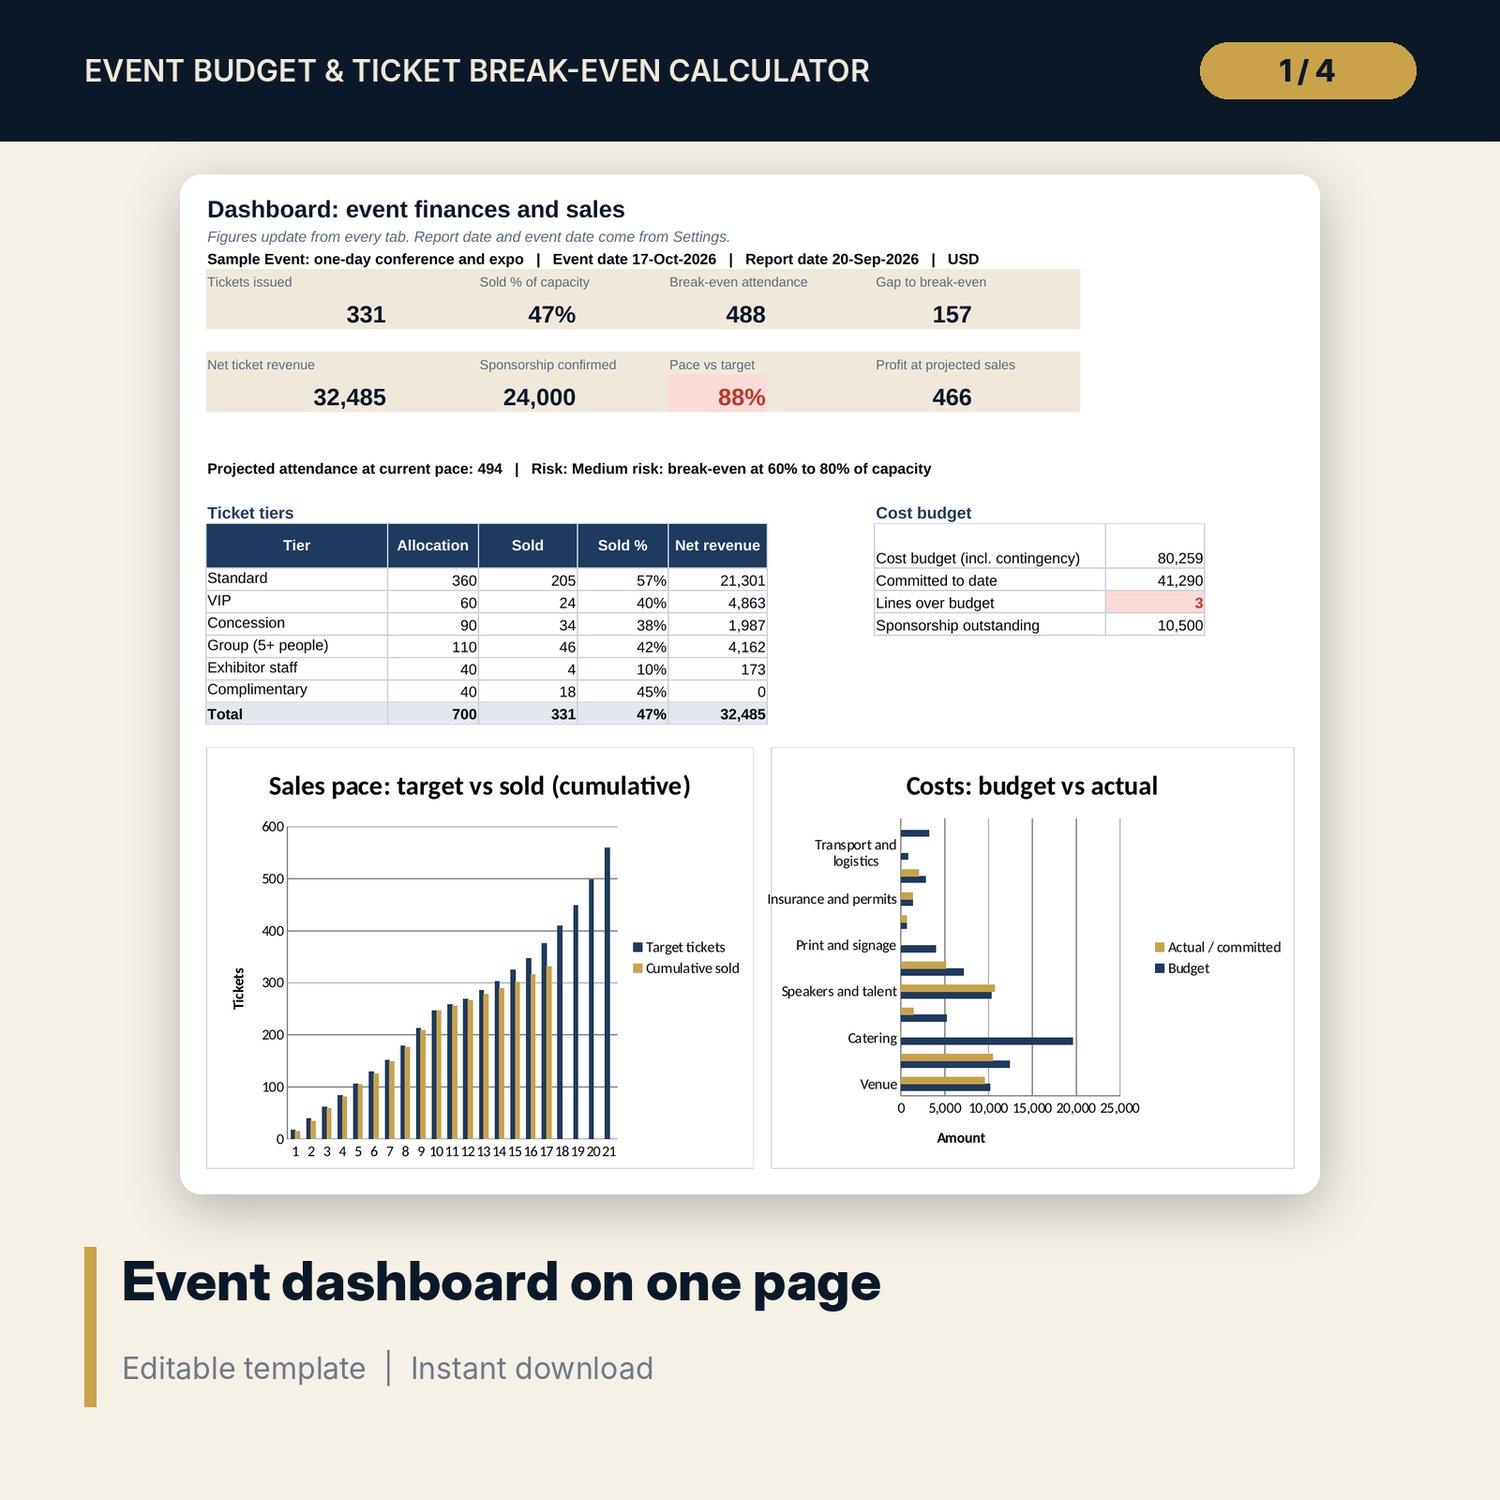
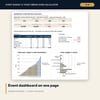
- Dashboard: 8 KPI tiles, ticket tier summary, cost summary and 2 charts.
- README.txt and LICENSE-and-Terms.txt.
How it works
- Enter the event date, capacity, forecast attendance and your fee and tax rates on Settings.
- List your costs on Costs and mark each line Fixed or Per attendee.
- Set ticket tiers, prices and planned mix on Tickets, and add sponsors on Sponsors.
- Read Break_Even and adjust prices, costs or sponsorship until the risk level suits you.
- Each week, enter tickets sold by tier on Sales_Pace, move the report date and check the Dashboard.
Details
- Format: Excel workbook (.xlsx). No macros.
- Language: English. Currency is a label you choose.
- Software: Excel 2016 or later, or a spreadsheet program that opens .xlsx files.
- Delivery: instant digital download. Nothing is shipped.
Good to know
- All costs, prices, sponsors and sales figures are illustrative. Replace them with your own data.
- Fee, sales tax and permit rates are editable examples. Verify local requirements and your provider's rates.
- The workbook is a planning tool, not financial or tax advice.
- Single-user license. Do not share or resell the files.
FAQ
Does it handle complimentary tickets?
Yes. Complimentary passes count as attendees for per-attendee costs but bring no ticket revenue.
Can I count sponsors who have not signed yet?
Choose on Settings: confirmed sponsors only, or confirmed plus the weighted value of the pipeline.
How does early-bird pricing work?
Each tier has an early-bird price and end date. Sales in weeks that start on or before that date count at the early-bird price.
Does it work in Google Sheets?
It opens in Google Sheets and the formulas calculate. Check the drop-downs and charts after import.
Is this a physical product?
No. It is a digital download. Refund terms follow the store policy at the time of purchase.