


In this report I will review the key aspects of my trading this week, focusing on the actual trades I executed.
I publish this “Weekly Trade Report” every Saturday.
If you read it together with “Trade Scenarios,” which I post every Sunday, I believe it will help you see how I think in advance and how I actually execute trades based on those scenarios.
This is not advice telling you “this is how you should trade,” nor am I claiming that this is the correct answer.
It is not about showcasing individual wins or losses, nor about recommending a specific strategy based on those results.
My aim is to show, at an operational level, how I repeatedly run the same process based on my pre-defined scenarios, and to illustrate “process consistency” in a way that you can use as a reference for building your own strategy and maintaining your own process consistency.
The results are nothing more than one individual outcome of mine, and they do not guarantee your future profits.
With that firmly in mind, please make sure you thoroughly test and prepare your own approach, and trade solely at your own responsibility.
My trading is focused on buying pullbacks and selling rallies on the 4H timeframe.
For details of my pullback-buy and rally-sell strategies, please refer to my past blog posts on Dow Theory and multi-timeframe analysis.
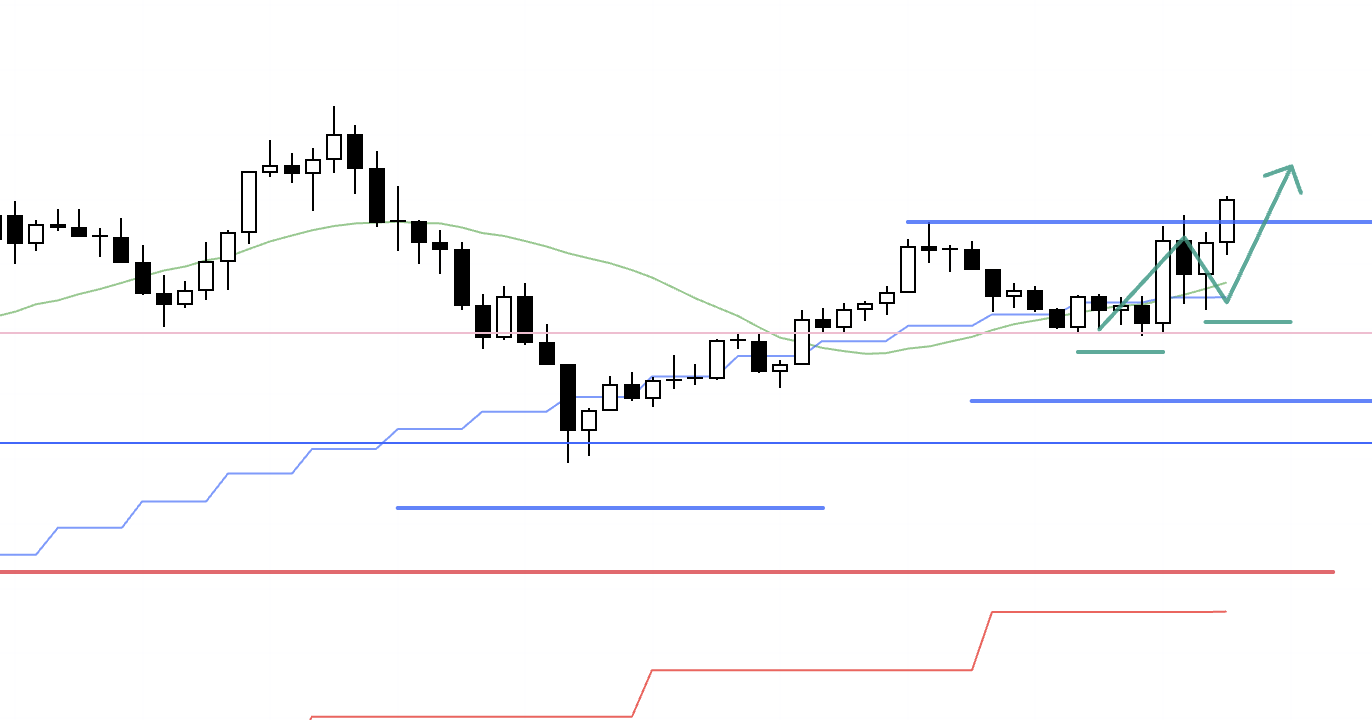
With that in mind, let us look at the following charts.
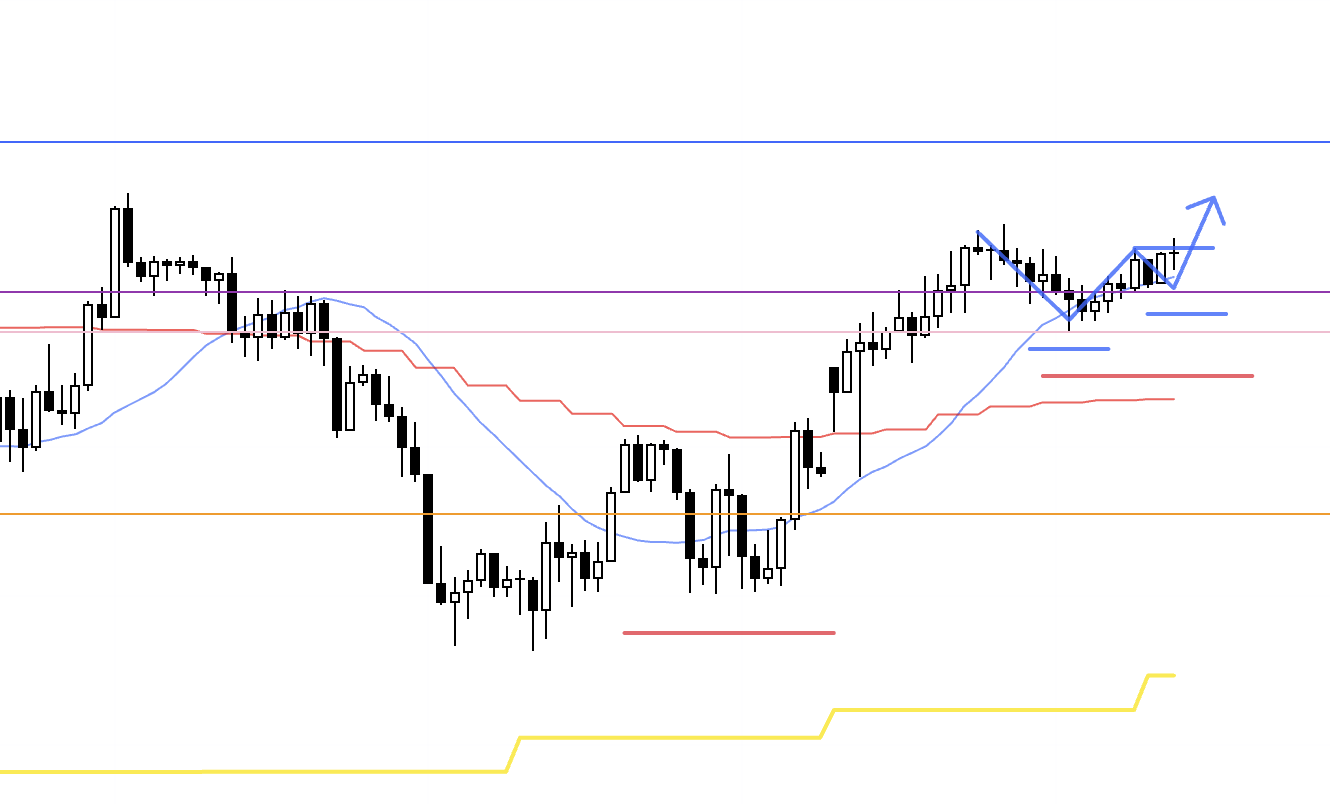
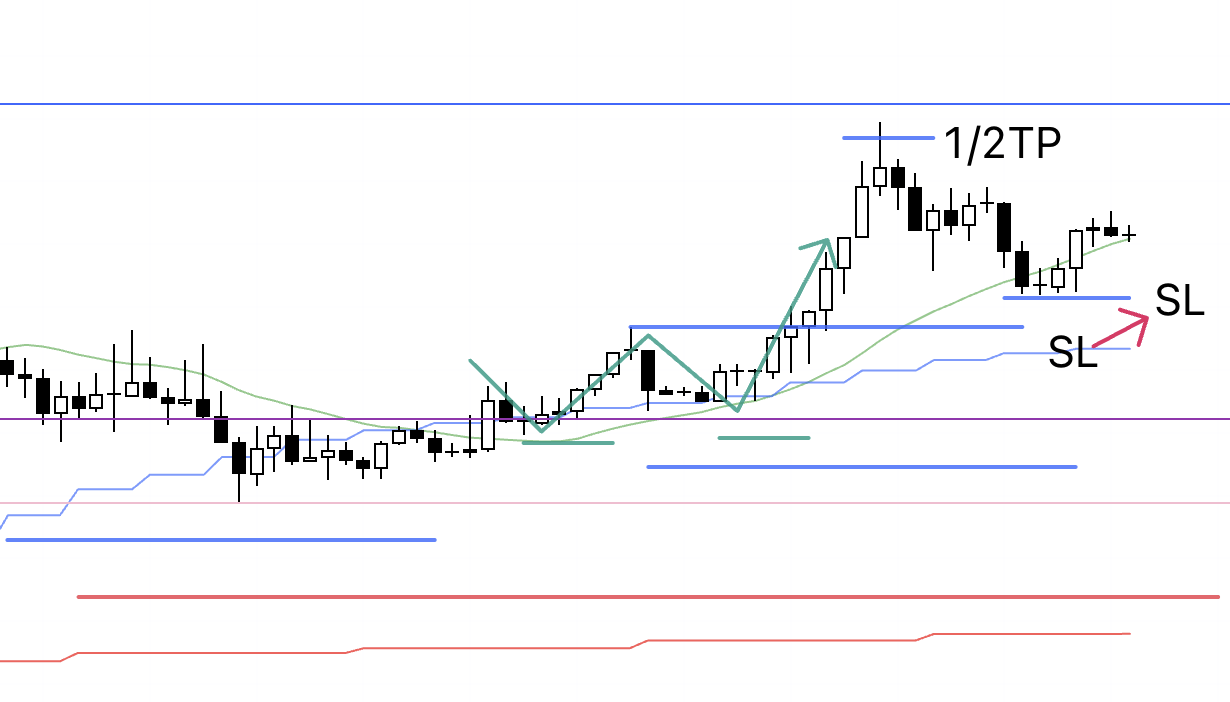
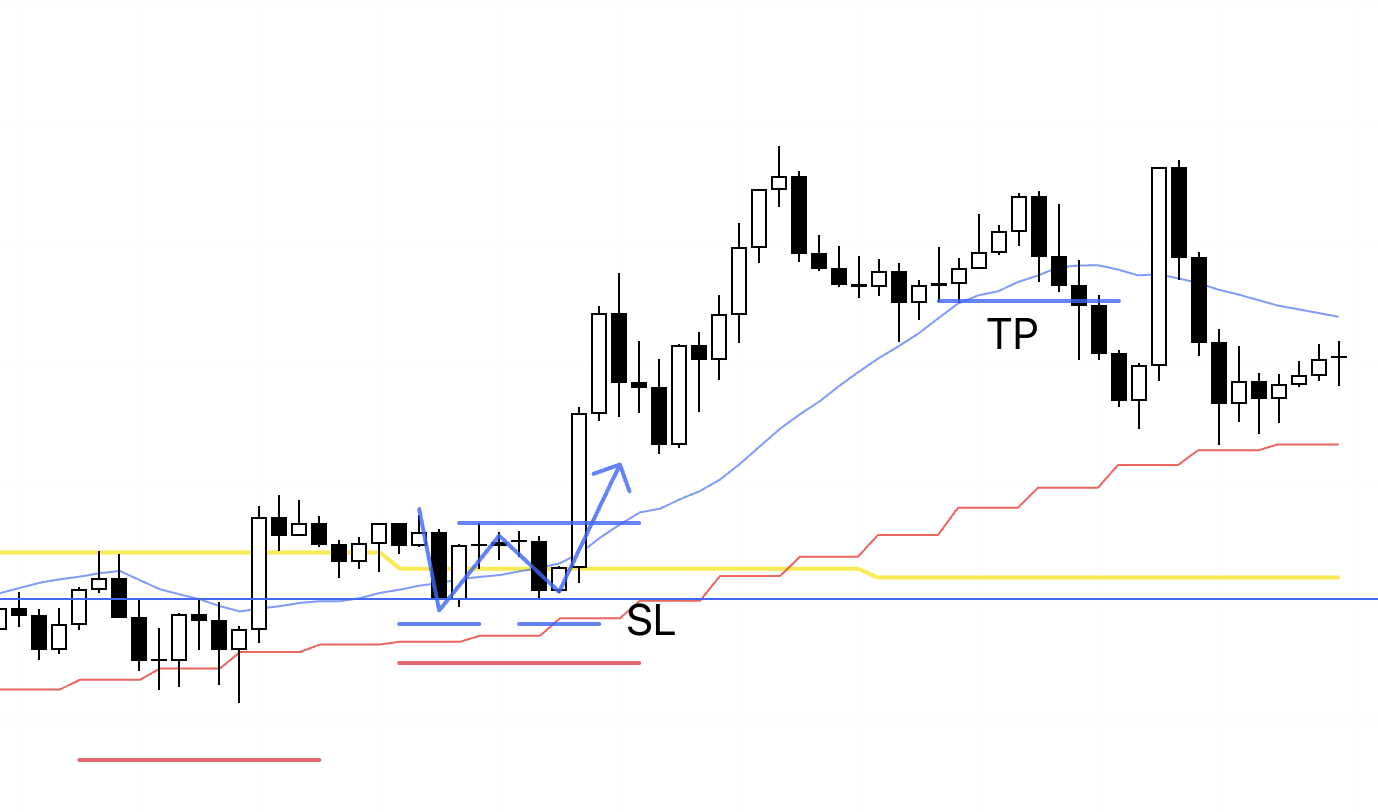
USDJPY 4H
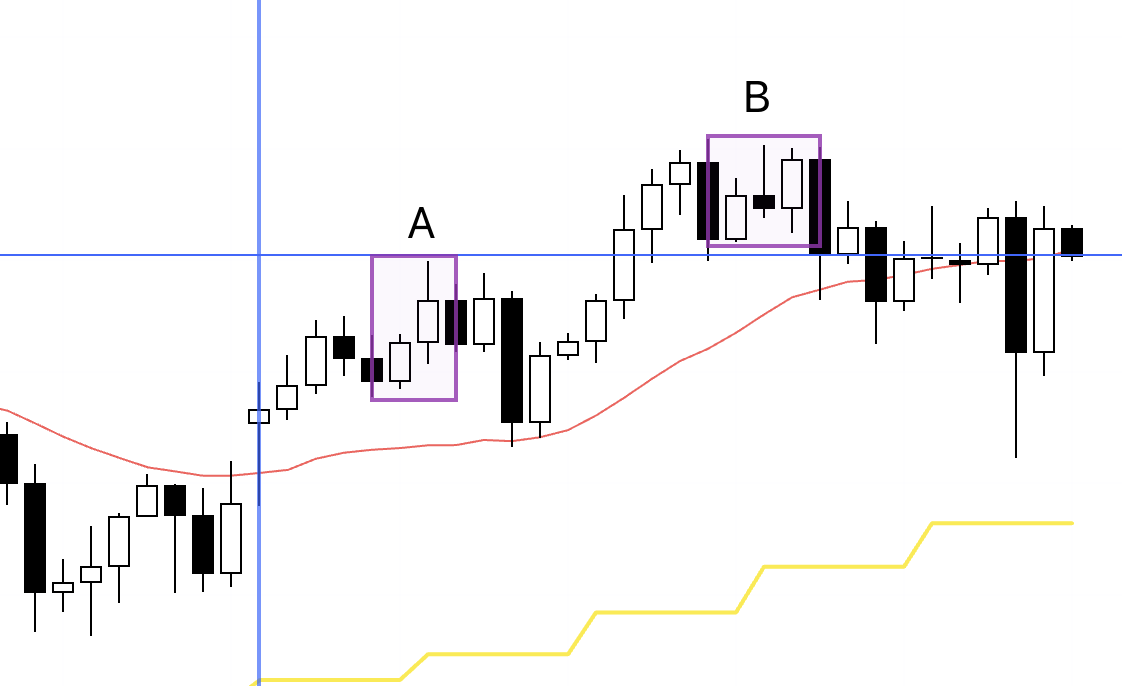
This is the 4H chart for USDJPY.
The price action for this week is everything from the blue vertical line onward.
This week I traded USDJPY at the two points marked by the rectangles.
As discussed in Sunday’s scenario, I was watching how price would behave around this blue line during the week.
In the latter half of the week, price kept chopping around this blue line without committing in either direction, so I did not trade.
For the two points where I did trade, I took screenshots in real time and recorded what I was thinking while I was in the trades, so I will show those later.
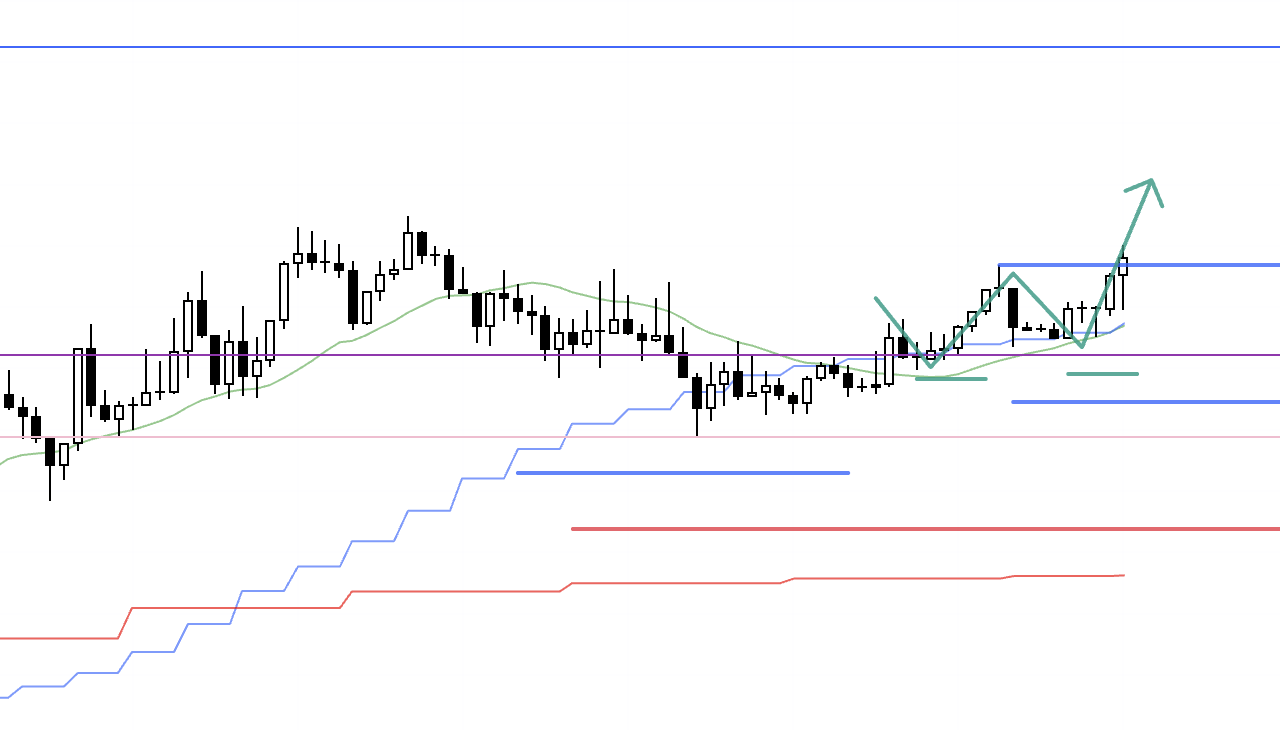
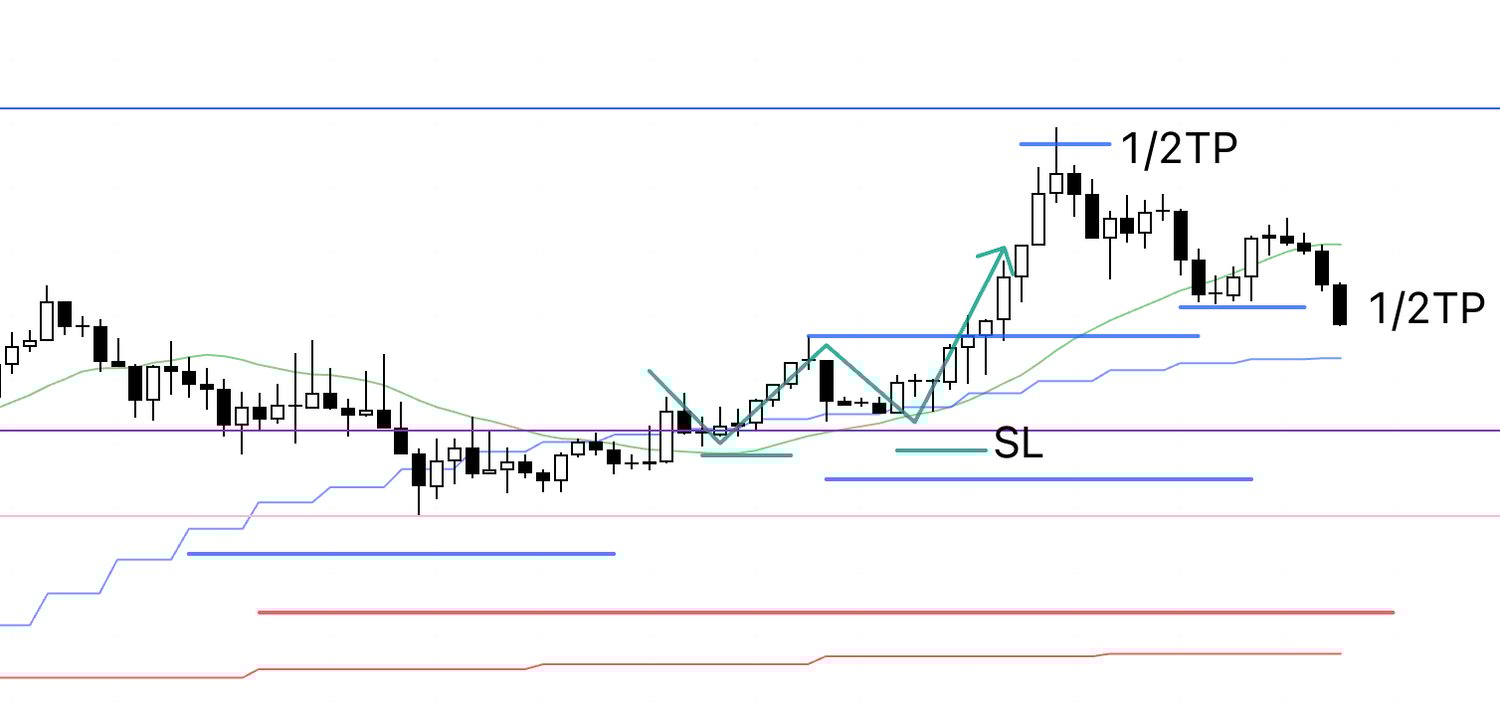
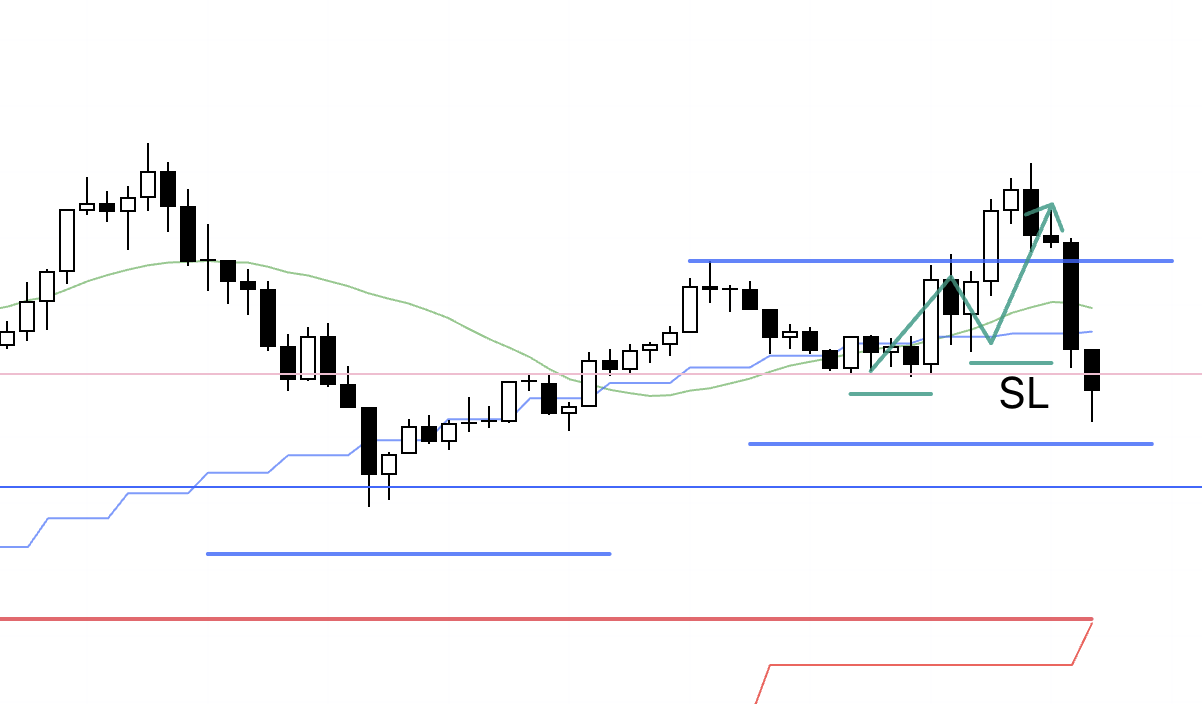
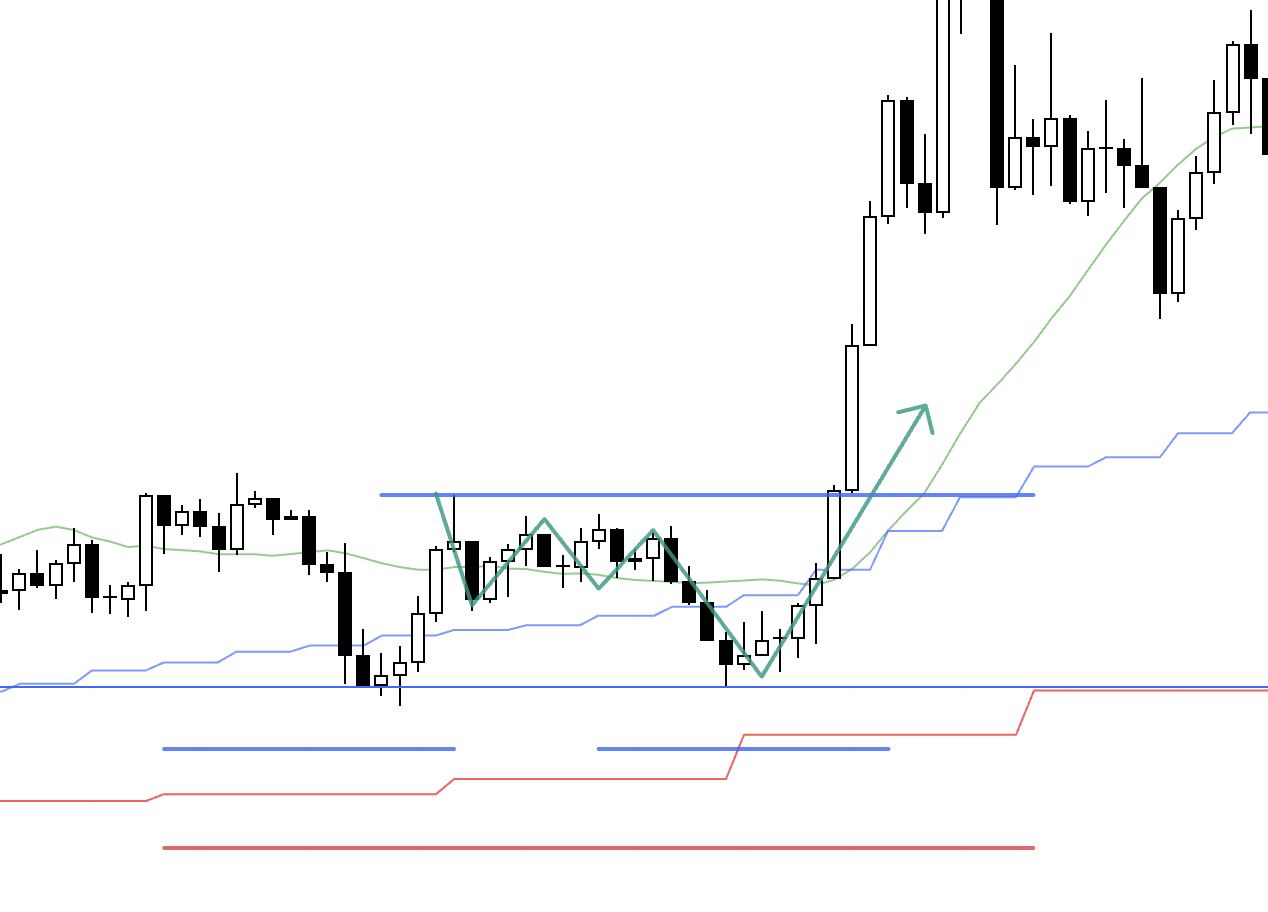
Next, please look at the EURUSD chart below.
EURUSD 4H
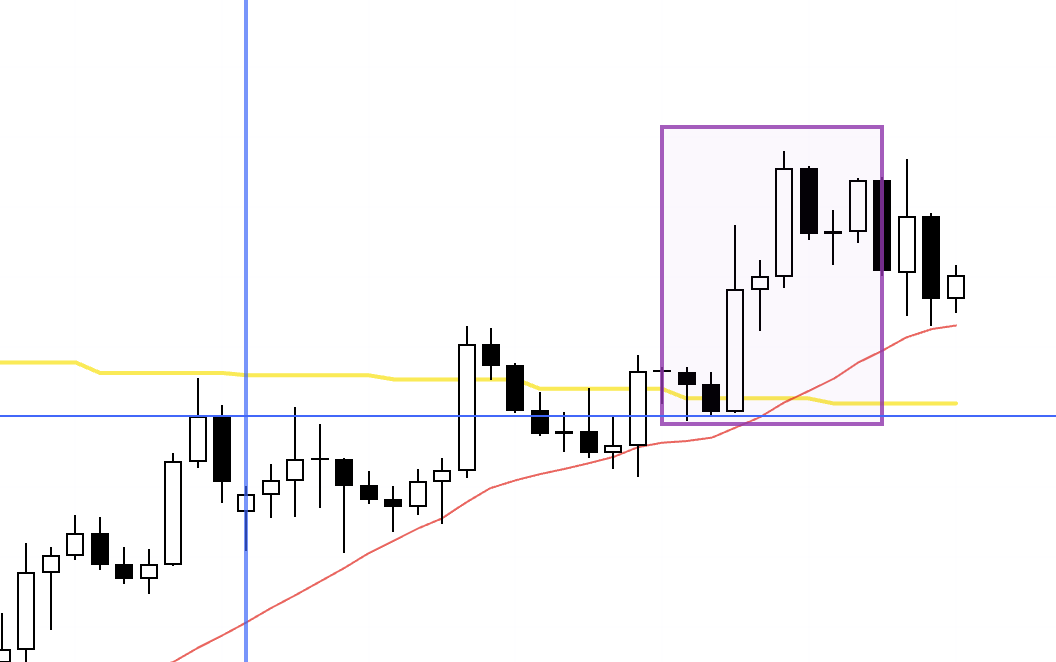
This is the 4H chart for EURUSD.
The area inside this rectangle is, from a technical standpoint, a 4H pullback buy that I would very much like to trade.
However, because it coincided with an economic data release, I chose not to take the trade.
I will break this point down in detail later.
First, I will walk through the trades I actually took this week, using the real-time notes from those moments as I explain them.
〜・〜・〜・〜・〜・〜・〜・
November 11 (Tuesday)
USDJPY
4H chart from Sunday’s scenario blog
In last Sunday’s scenario blog, I laid out a buy scenario at a higher low acting as a pullback after the 4H had shifted from a downtrend to an uptrend.
When the 4H transitions from a downtrend to an uptrend, that move effectively becomes a leg that joins the daily pullback buy to the upside.
4H
This is the actual 4H chart, and I have just placed my order and entered the position here.
This 4H higher low is also supported by the previous low (pink line), which creates a point where there is a strong edge to the upside.
However, as I wrote in Sunday’s scenario blog, the area around the blue line above is where selling pressure is likely to increase, so when entering on the lower timeframes, the key is whether the trade still makes sense from a risk-reward perspective.
Let us look at the 1h.
1H
Within the 4H higher low area, the 1h also formed a higher low and broke to new highs.
I entered on this break of the previous high.
This 1h higher low (purple line) is also supported by a line that can be drawn from the previous low and high, which makes it an excellent place to set an SL.
Let us also look at the 15m.
15m
Even on the 15m chart, this purple line appears to be holding very well, so I placed my SL just below this line and entered the trade.
Within the 4H higher-high higher-low structure that functions as a daily pullback buy, the 1h also makes a higher low and breaks to new highs, and inside that the 15m does the same.
When that happens, buy orders concentrate and the edge in favor of an upward move increases, so for me there is no choice but to go long.
That said, as I also mentioned on Sunday, this buy scenario carries the risk that selling pressure will increase in the area around the blue line above.
On the 15m timeframe there is still room up to this blue line, so my plan is to take partial profits when price reaches that area and then hold the remainder until the trend breaks.
15m
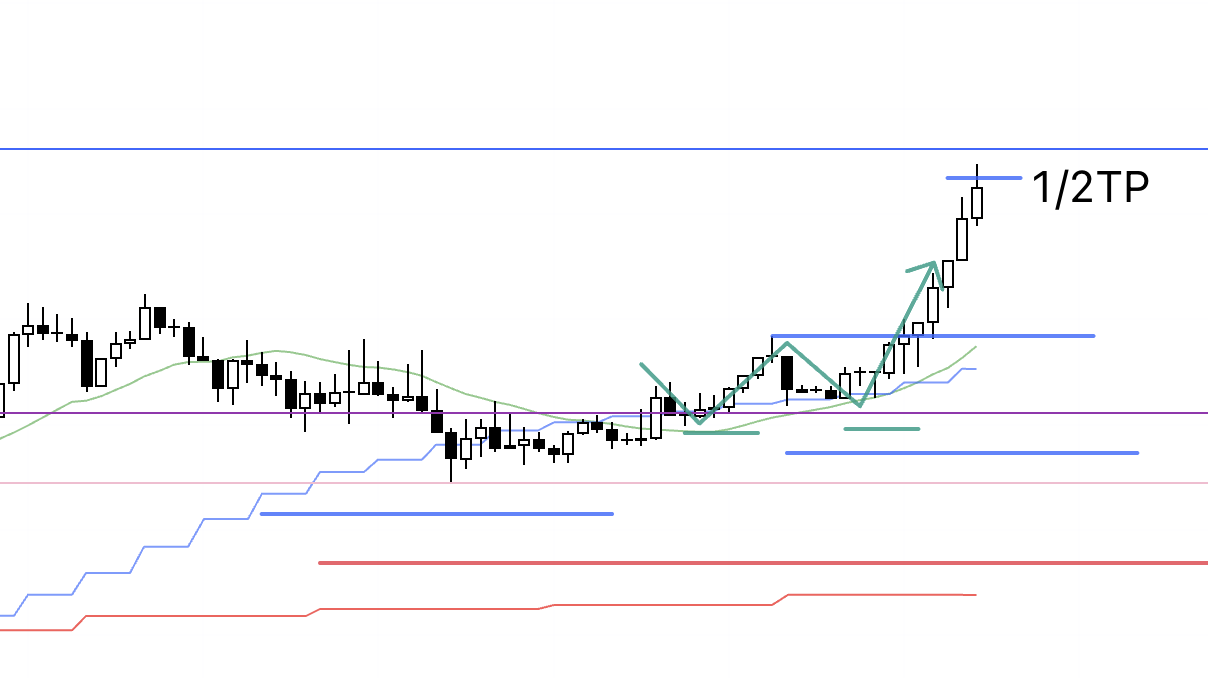
As concentrated buy orders pushed price upward, it quickly rallied all the way to the blue line, so I took profits on half the position.
I will continue to hold the remaining half until the trend breaks on the 15m.
15m
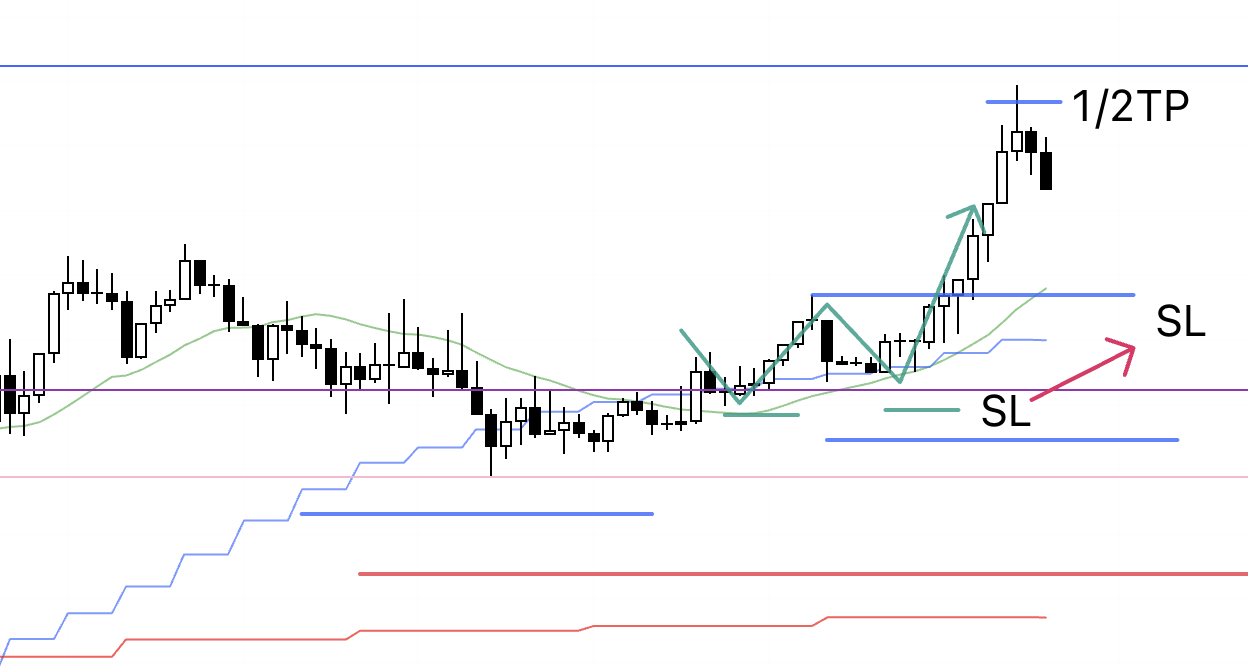
I moved my SL up.
15m
I moved my SL up.
15m
Price eventually hit the raised trailing stop, and that concluded this trade.
〜・〜・〜・〜・〜・〜・〜・
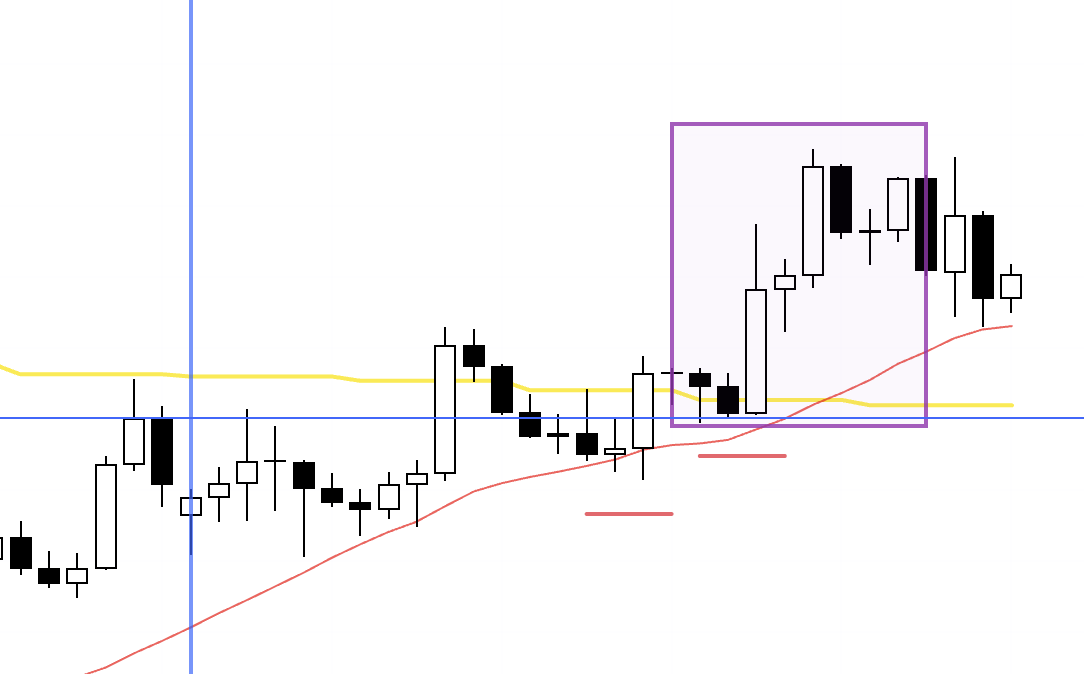
November 13 (Thursday)
USDJPY
4H
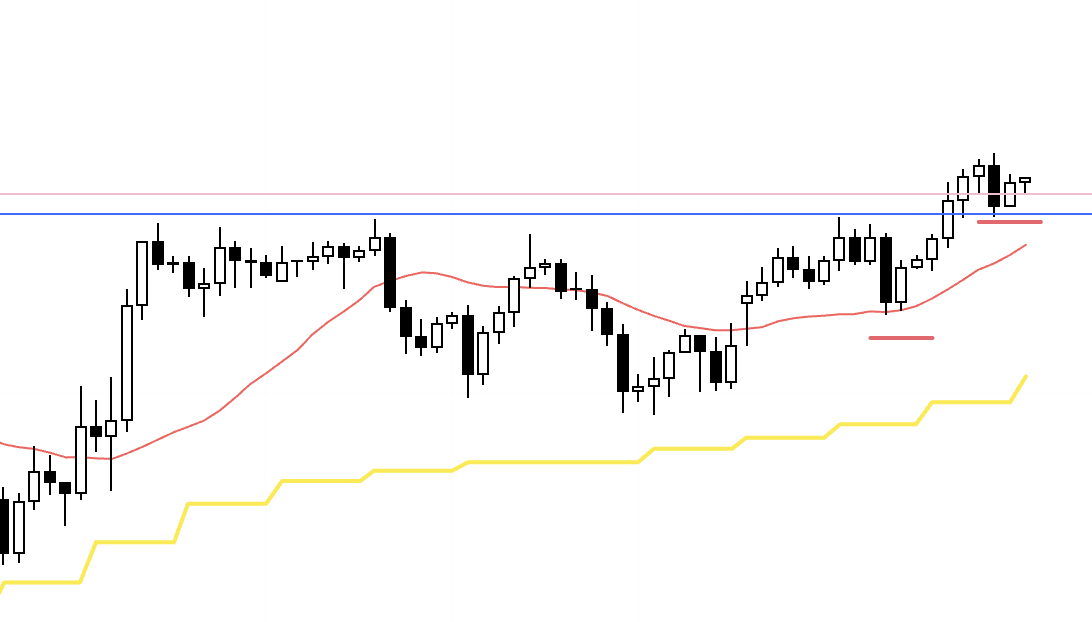
Price had broken above the blue resistance line that had been capping it for some time, and on the 4H it formed a higher low as if being supported by that line.
If price is supported by this blue line and moves higher, that creates an edge in favor of the upside, so I definitely want to be involved.
1H
On the 1h, within the 4H higher low, price is also attempting to form a higher low.
This low (pink line) is supported by the previous low, and on the 15m it also acts as a line where resistance turns into support, so I set my SL just below this line.
15m

On the 15m, within the 1h higher low area, price is also attempting to form a higher low and break higher.
From the 15m perspective, you can see that this supported low (pink) had just been a resistance level that flipped into support, so if it holds and price goes on to break the high, I very much want to take the trade.
The entry trigger is the same breakout of the high (blue) as the 1h high break.
15m
My order was filled and I was in the trade.
From here I will hold until the trend breaks on the 15m.
15m
Price quickly reversed lower, hit my stop, and the trade was closed.
〜・〜・〜・〜・〜・〜・〜・
These are the only two trades I actually took, but now I will walk through the EURUSD trade that I decided to pass on.
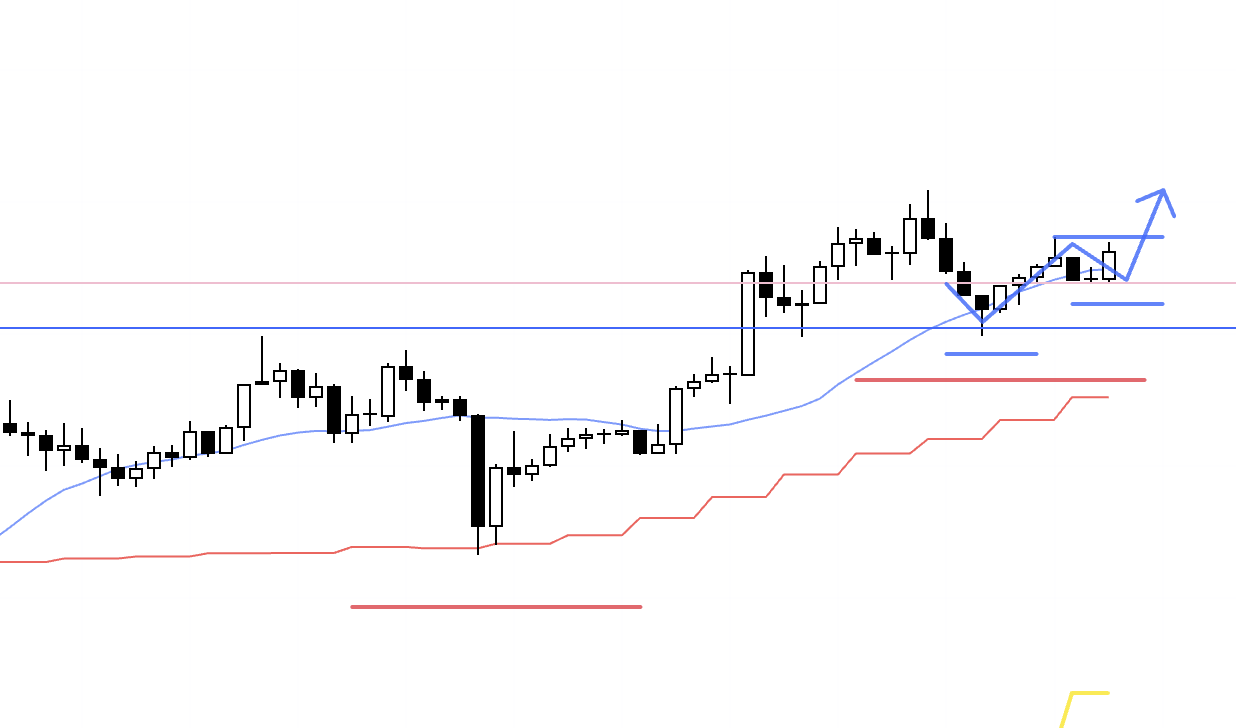
4H
This is the 4H pullback buy, but let us change the scale and take a closer look at this blue line.
4H
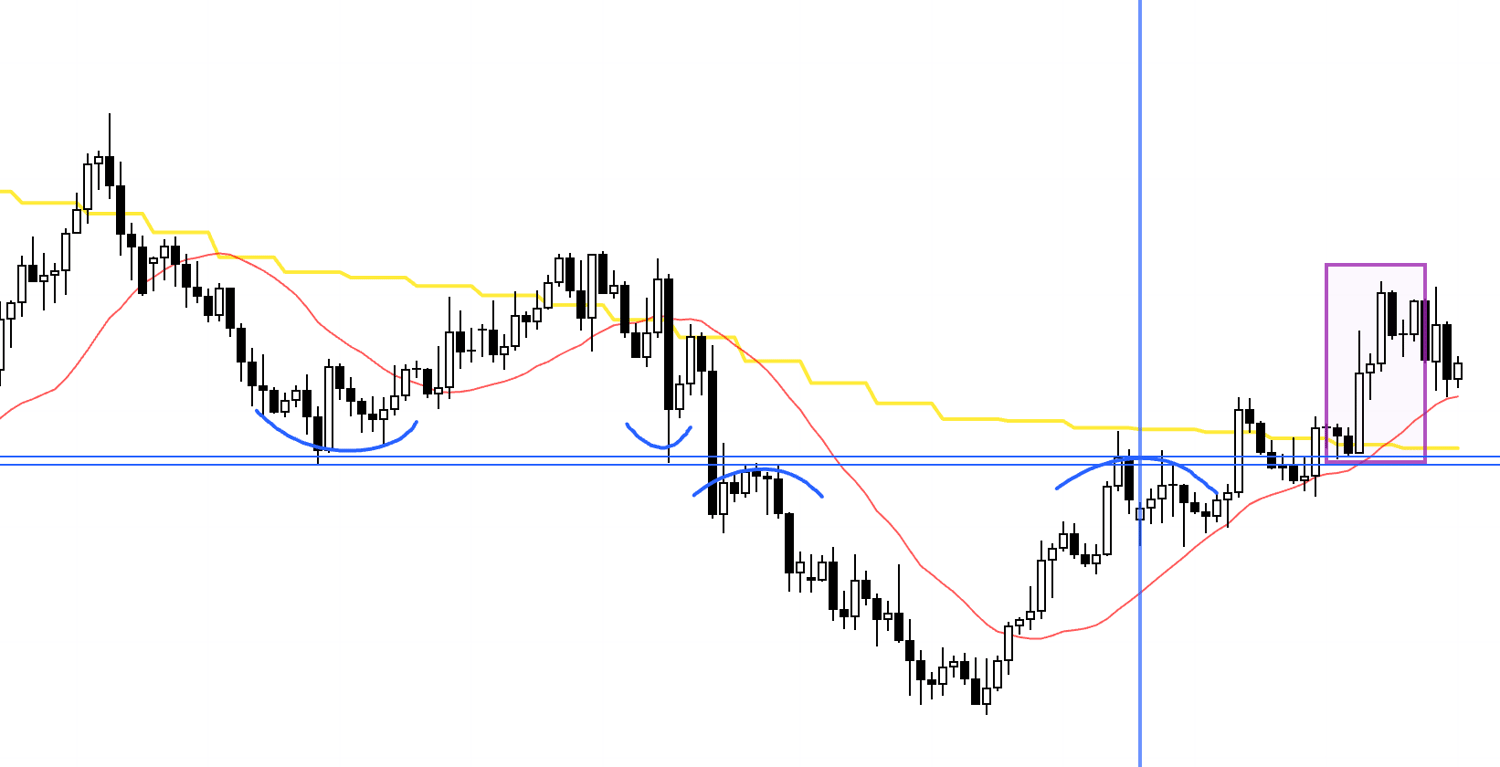
I have annotated it to make it easier to see.
As you can tell, this line has repeatedly acted as an area where buying and selling flip back and forth, and if price were to be supported by this line and go on to make new highs, I would have no choice but to buy.
1H
In reality, I did not take this trade because it coincided with an economic event.
However, if we ignore the economic event and just interpret the chart technically, then on the 1h you can see a clean double bottom forming at the blue line, followed by a break of the high.
In that case, the trade would likely be an entry on the high breakout, then an exit when price breaks below the low together with the moving average.
On the 15m, this move broke the low and then shot straight to new highs without forming a higher low, so it was not tradable for me on the 15m.
Therefore, I would treat this as a 1h trade.
15m
For reference, here is the 15m, where you can see that price rallied straight up without forming any higher low.
15m
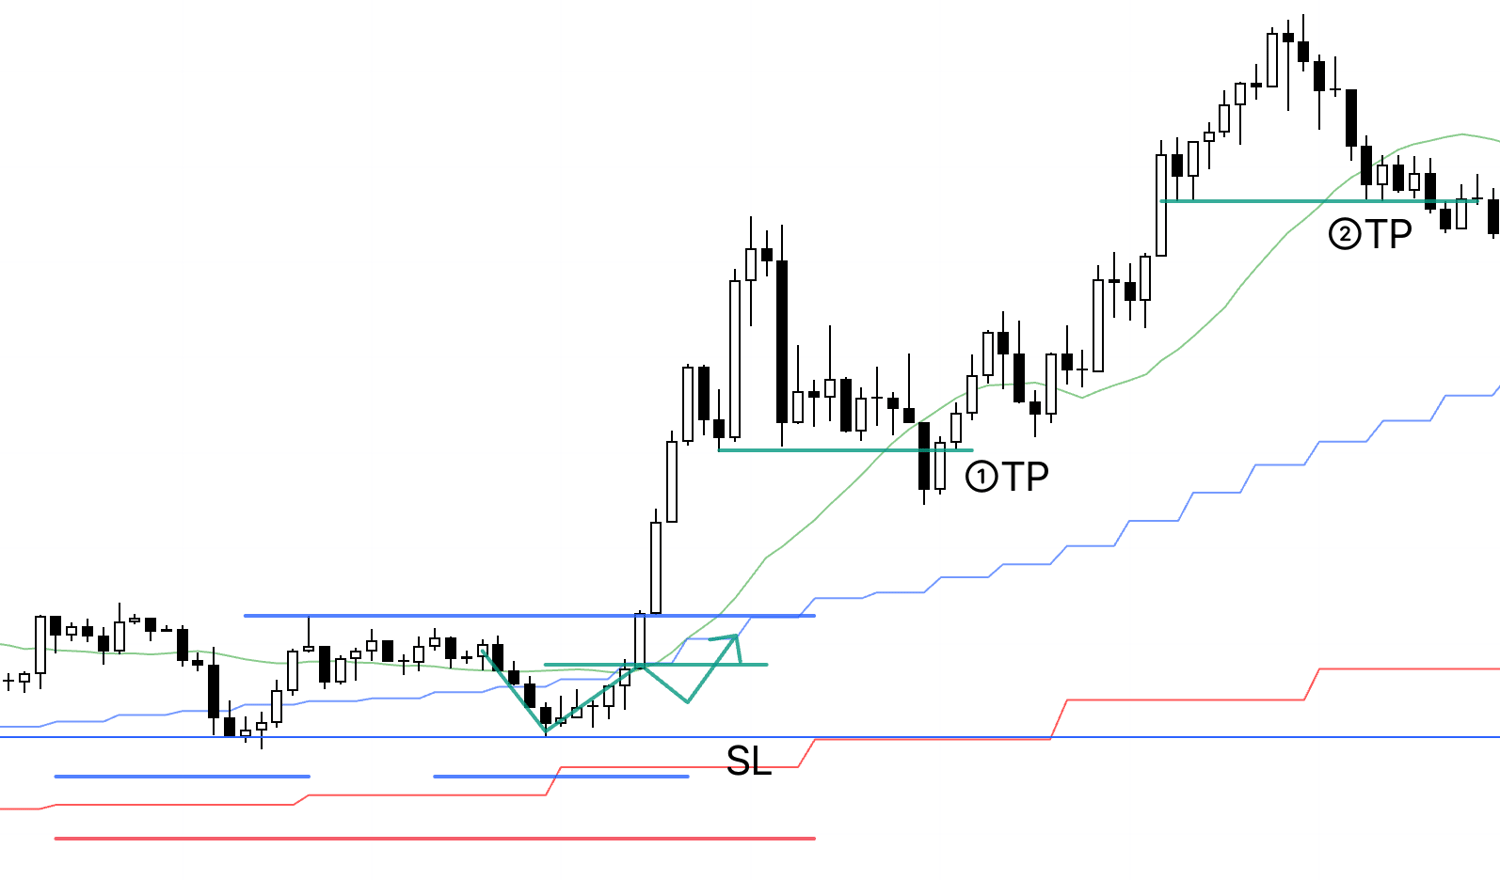
If, hypothetically, price had formed a higher low like this, I would have been able to enter one step earlier than the 1h high breakout (blue line), and then use the subsequent 1h buy orders to create a chain reaction of orders.
(I have a previous blog post explaining this chain reaction of orders, so if you are interested, please take a look.)
In such a case, the trade would probably end either at point ①, where the 15m Dow structure breaks, or at point ②.
Since this is a hypothetical trade, I cannot say for certain, but at point ① there is a high likelihood that I would not yet have moved my SL.
The reason is that in Japan, where I live, point ① corresponds to 20:45.
I generally check the charts around the top of the hour, such as right at 20:00 or slightly before, in order to confirm the close of the 1h candle, and I almost never check the charts at an odd time like 45 minutes past the hour.
So if we assume I had checked the charts at 20:00, at that point the moving average would still not have caught up to the low, and if I had been looking at the charts then, I do not think I would have moved my SL yet.
That being the case, I suspect this trade would have ended with a TP at point ②.
That said, this is purely a hypothetical trade, so I hope you will take it simply as a reference for how I think and how I maintain consistency.
〜・〜・〜・〜・〜・〜・〜・
That is all for this week.
Every week I just keep repeating the same type of trade.
Of course no two charts are ever identical, each one is unique, but my decisions are anchored in consistent criteria, so I am repeatedly applying the same judgments to whatever chart is in front of me at that moment.
Where I draw lines and how I decide in each situation might look highly discretionary to someone else, but that is merely a difference in understanding and perception; within my own framework I am making the same decisions consistently.
I believe the boundary between high-quality discretionary trading and systematic trading is extremely blurry.
I am not particularly interested in the labels; what matters is how consistently you can keep making the same decisions and whether those repeated decisions have a positive expectancy.
Charts are one of a kind, but your decisions must not be one of a kind on each trade.
Only when you have consistent entry and exit rules does the law of large numbers start to work in your favor in terms of win rate and risk reward.
These consistent decisions are ingrained in me through massive practice, so when I look at a chart I can decide almost instantly.
Explaining it in a blog like this inevitably makes it sound verbose and analytical, but what matters is that in real time I am doing all of this in an instant, without spending much mental energy.
I also no longer have any emotional or cognitive attachment to outcomes.
Once I have entered, I feel as if my job is almost done, and there is nothing left to think about other than trailing the stop.
It is the sense of “I executed the entry perfectly according to the rules, and after that it is none of my business”.
We cannot control outcomes, and thinking about them rarely leads to anything good.
Because I have a very clear boundary of “my job ends here,” once I am in the trade I set alerts and then forget about it.
When an alert goes off, I check the chart and move the stop if necessary.
Nowadays, because I write this blog, I do take screenshots and jot down notes during trades, but originally I barely thought about the trade after entry, to the point where the settlement notification on my phone would remind me “oh right, I had a position on”.
This is the result of training myself relentlessly in the past to keep only the processes that are necessary and eliminate everything else.
In short, what I want to convey is that it is crucial to practice to the point where you can keep making consistent decisions and taking consistent actions without any cognitive dissonance and without allowing emotions to interfere.
I hope this blog can serve as a hint for those who are in the process of building a strategy or struggling to achieve consistency.