Forecast Accuracy & Bias Tracker: Hotel Forecast Accuracy Tracker with MAPE, Bias and Tracking Signal
Full description
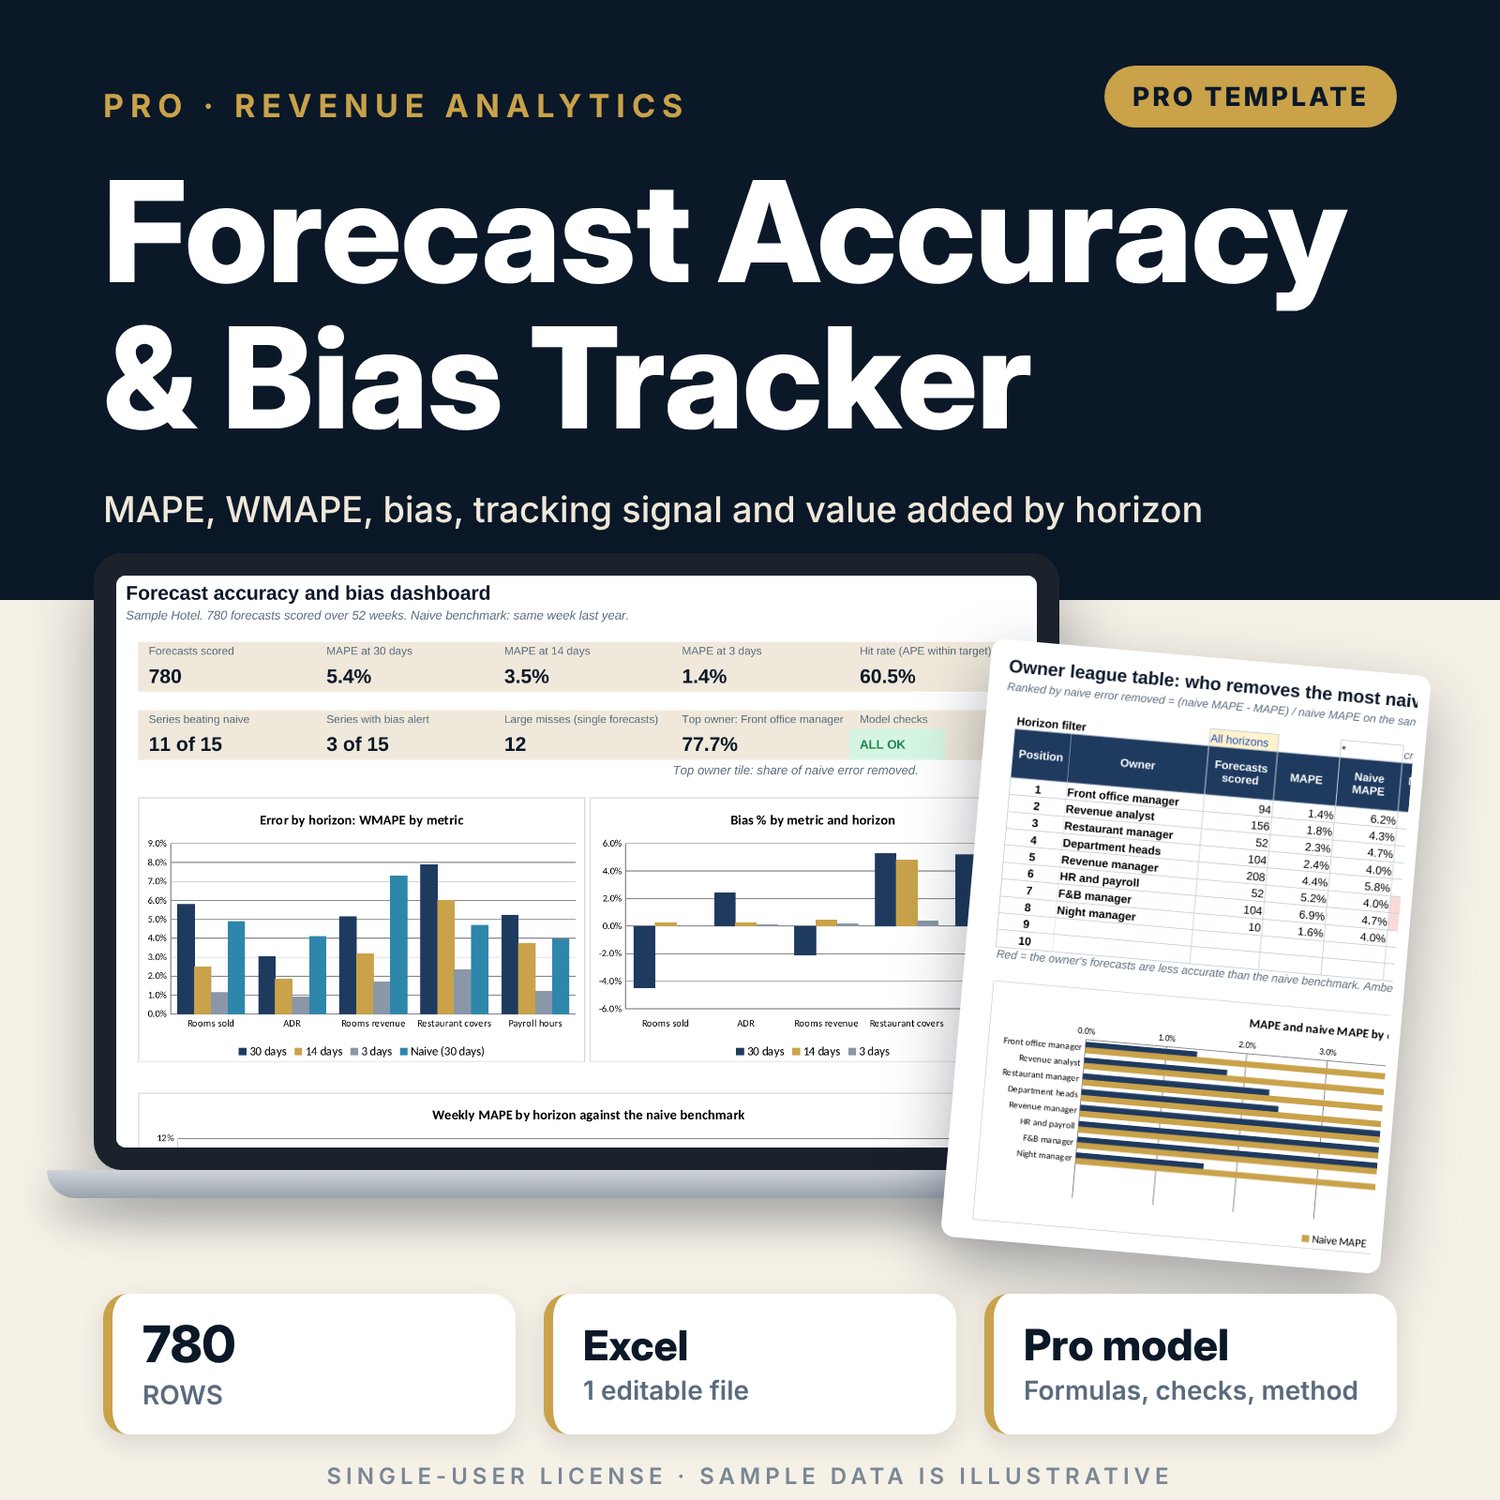
For revenue managers, general managers, financial controllers and department heads who sign off weekly forecasts for rooms, rate, revenue, covers and labour. Each forecast is logged once with its week, metric, horizon (30, 14 or 3 days out) and owner. The workbook looks up the actual and a naive benchmark (same week last year, or the last complete week known when the forecast was made) and calculates the error, % error, APE and a rolling tracking signal (sum of errors divided by MAD over the last 13 weeks) with a statistical limit from NORM.S.INV or a fixed limit. It then aggregates the 15 metric and horizon series into MAE, MAPE, weighted MAPE, bias %, forecast value added and an accuracy status against your targets, and ranks forecast owners by the share of naive error they remove. A viewer recalculates the tracking signal for any one series week by week and charts it against its limits.
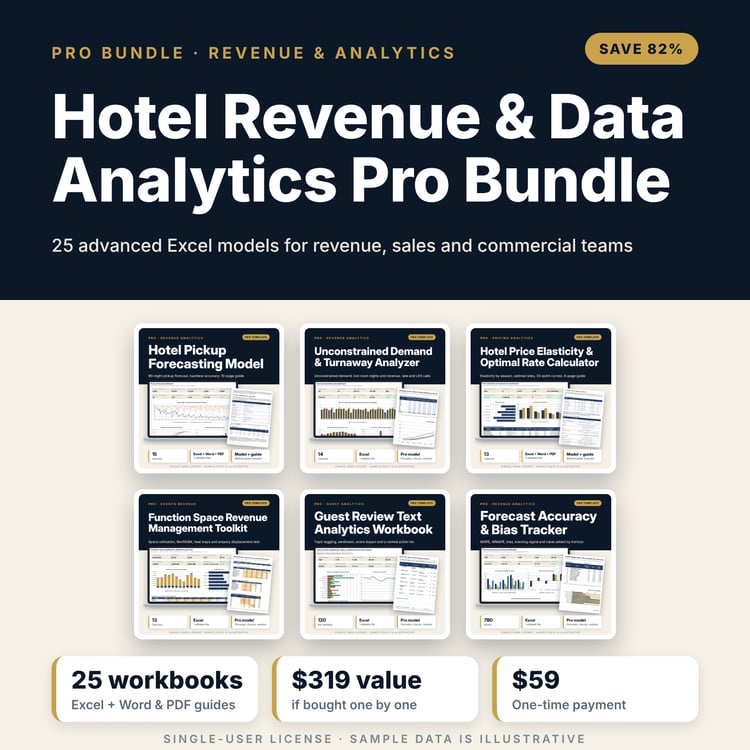
Save with a bundle: this workbook is also in the Hotel Revenue & Data Analytics Pro Bundle, 25 workbooks for $59 instead of $319. All 100 Pro workbooks are in the Pro Library for $119, and all 241 templates and workbooks are in the Ultimate Hospitality Library for $149.
What is inside
- Forecast_Accuracy_Bias_Tracker.xlsx: 11 tabs, 15,421 formulas, 8 native charts, 17 drop-down and input rules
- Sample year (illustrative): 52 weeks of actuals and last-year actuals for 5 metrics, 780 logged forecasts from 8 owners, 120 spare log rows and 8 spare weeks
- Forecast_Log: 780 scored rows, each with 15 formula columns from actual to flag
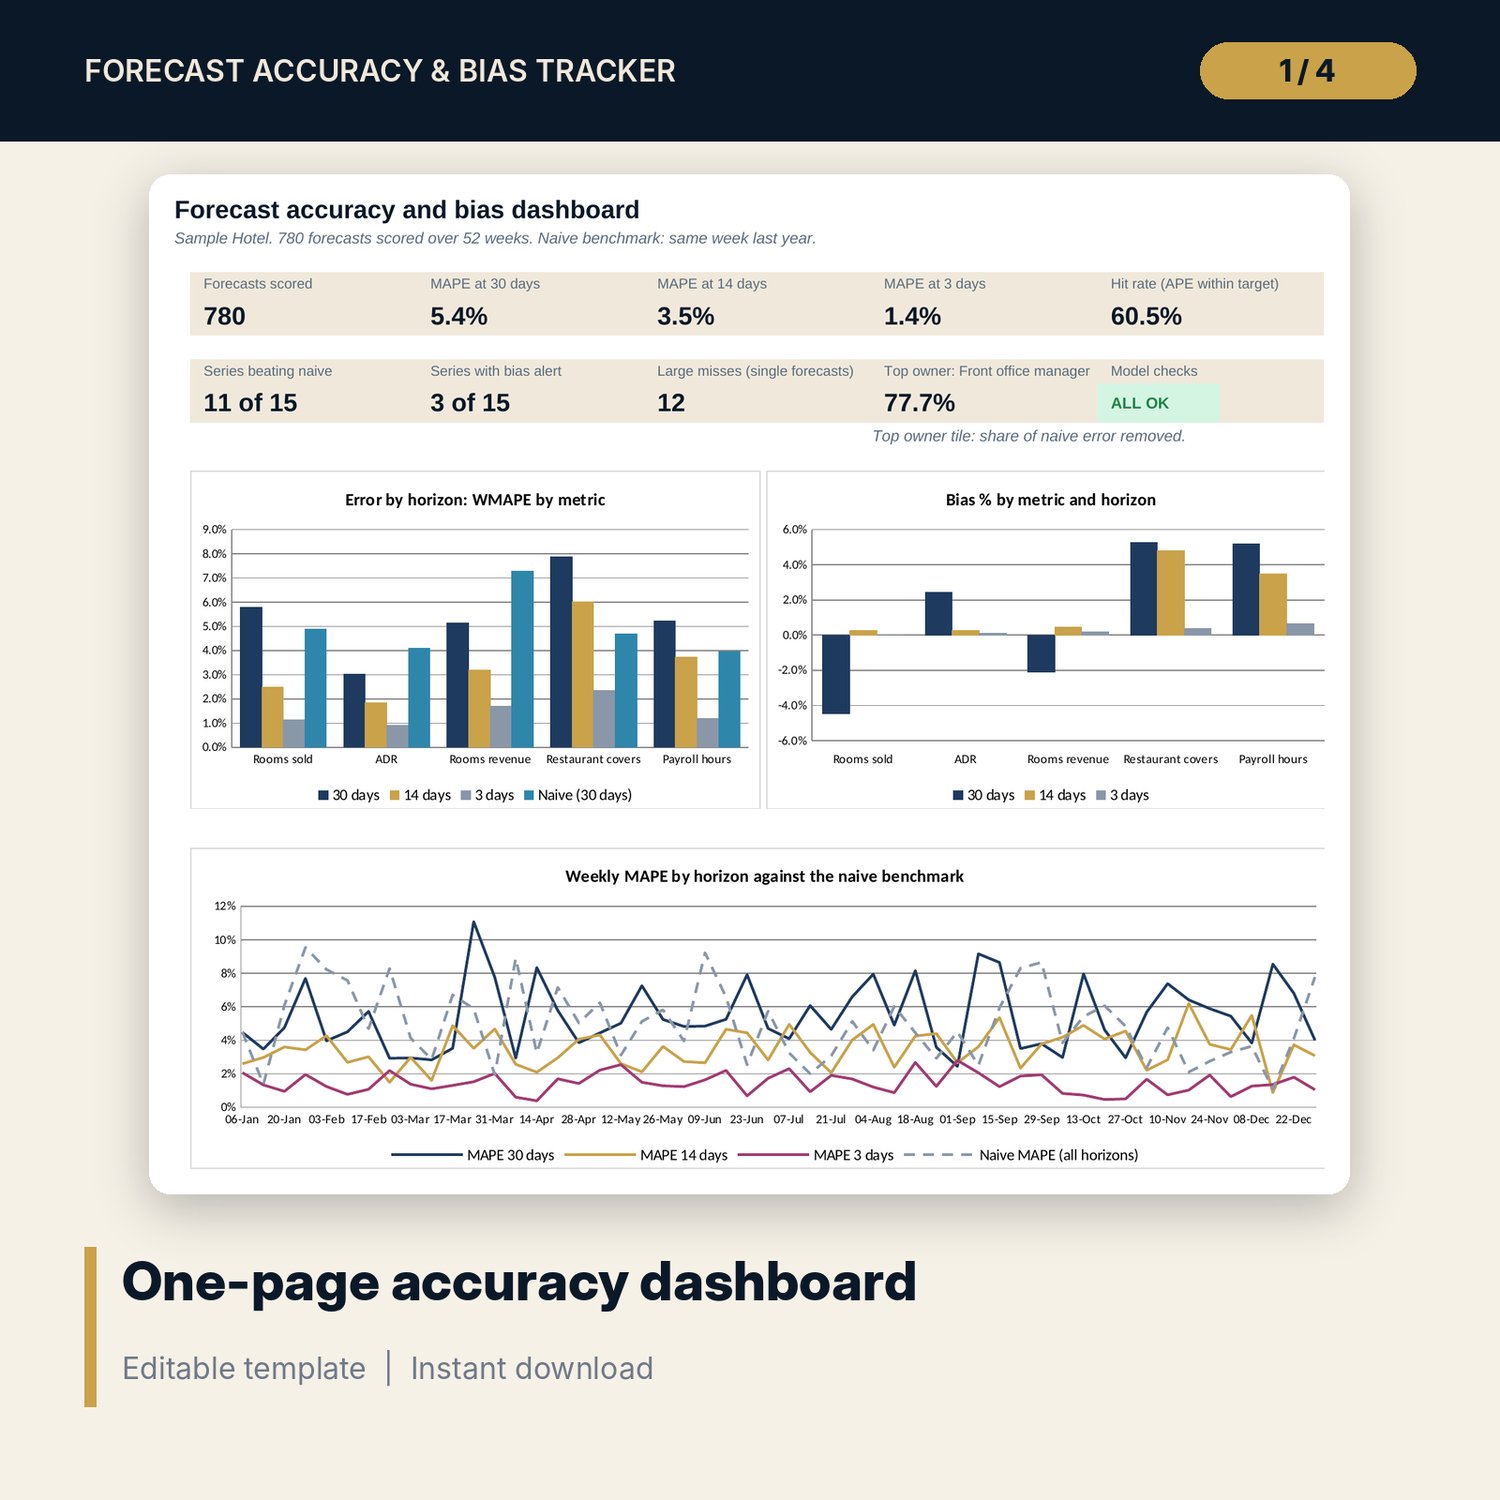
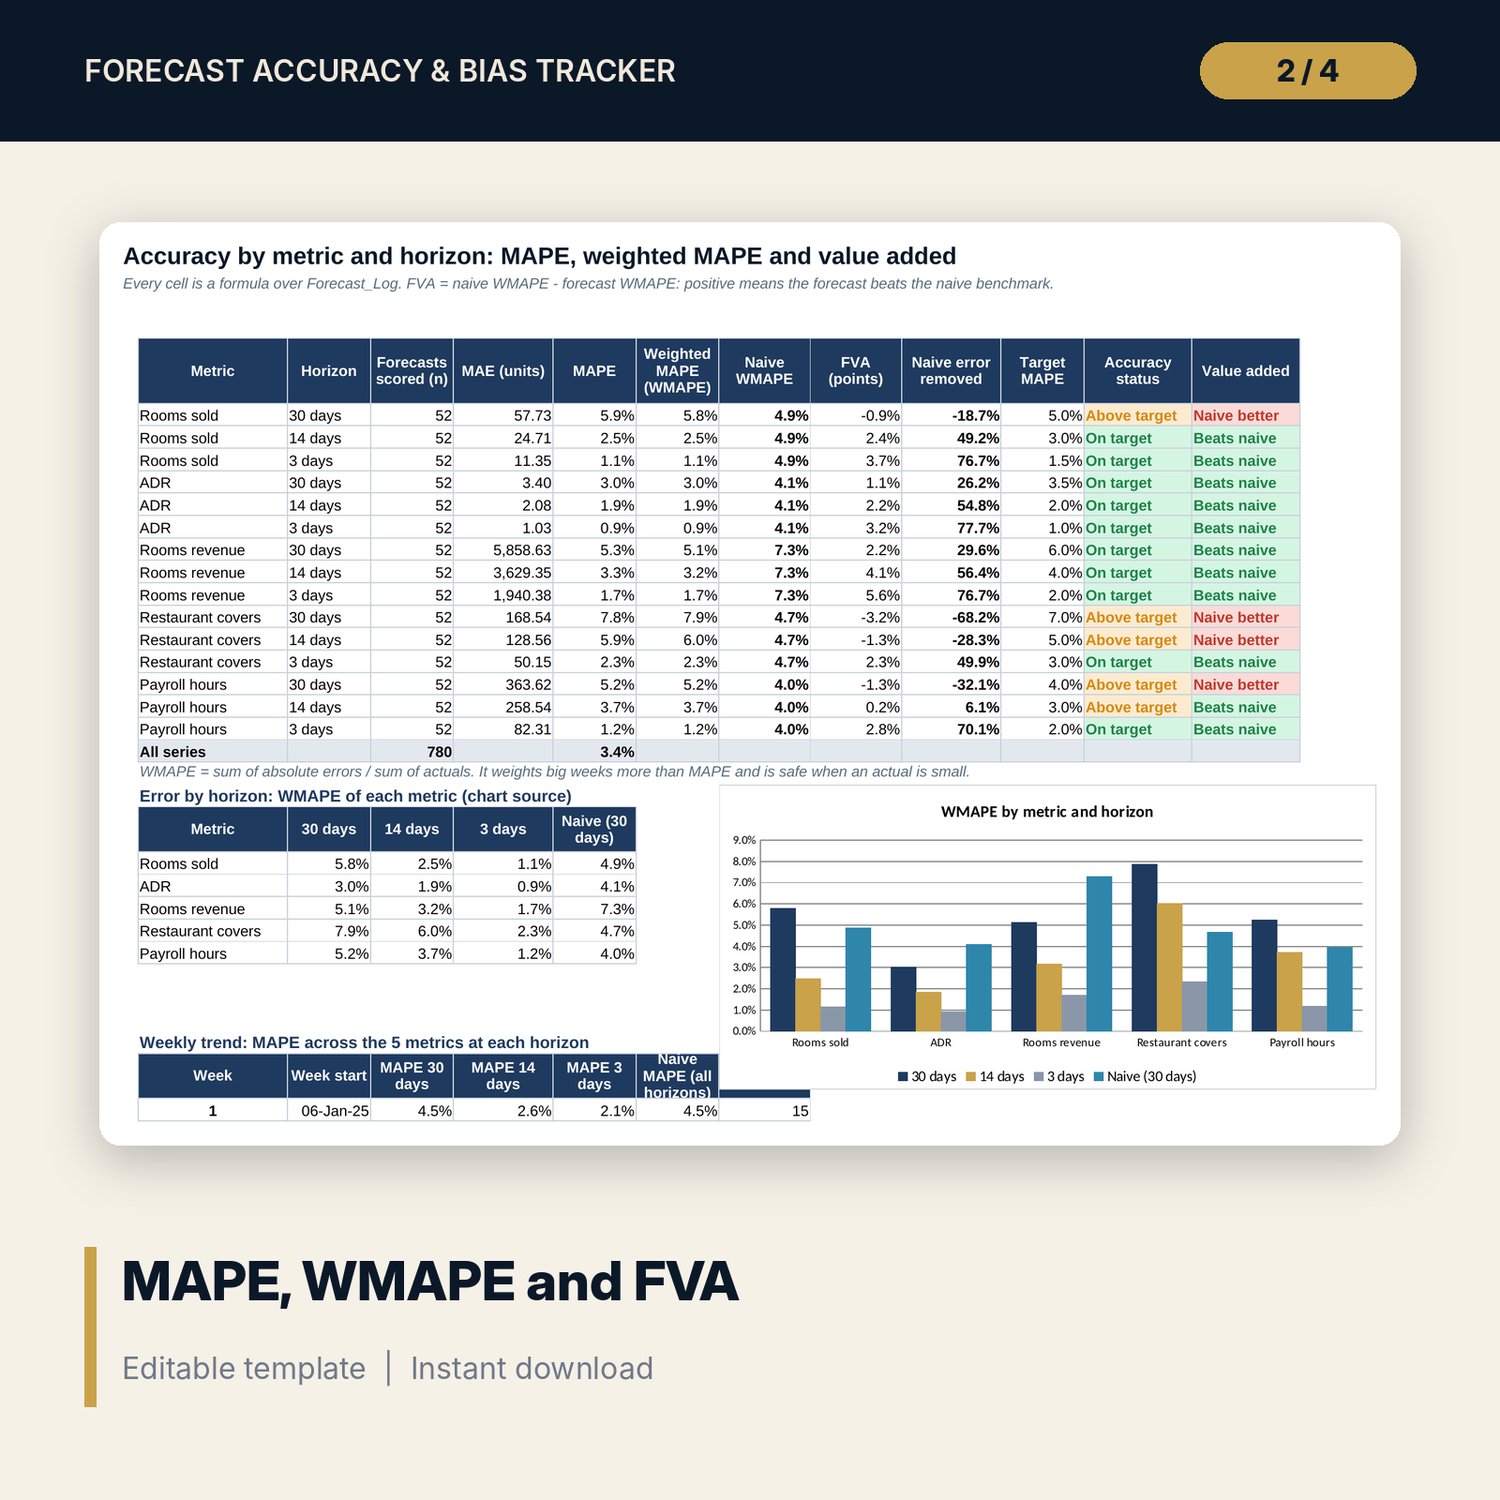
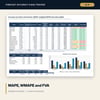
- Accuracy: MAE, MAPE, WMAPE, naive WMAPE, FVA and target status for 15 series, error by horizon and a 60-week MAPE trend
- Bias: mean error, bias %, share of weeks over-forecast, tracking signal and limit at the latest week, bias status
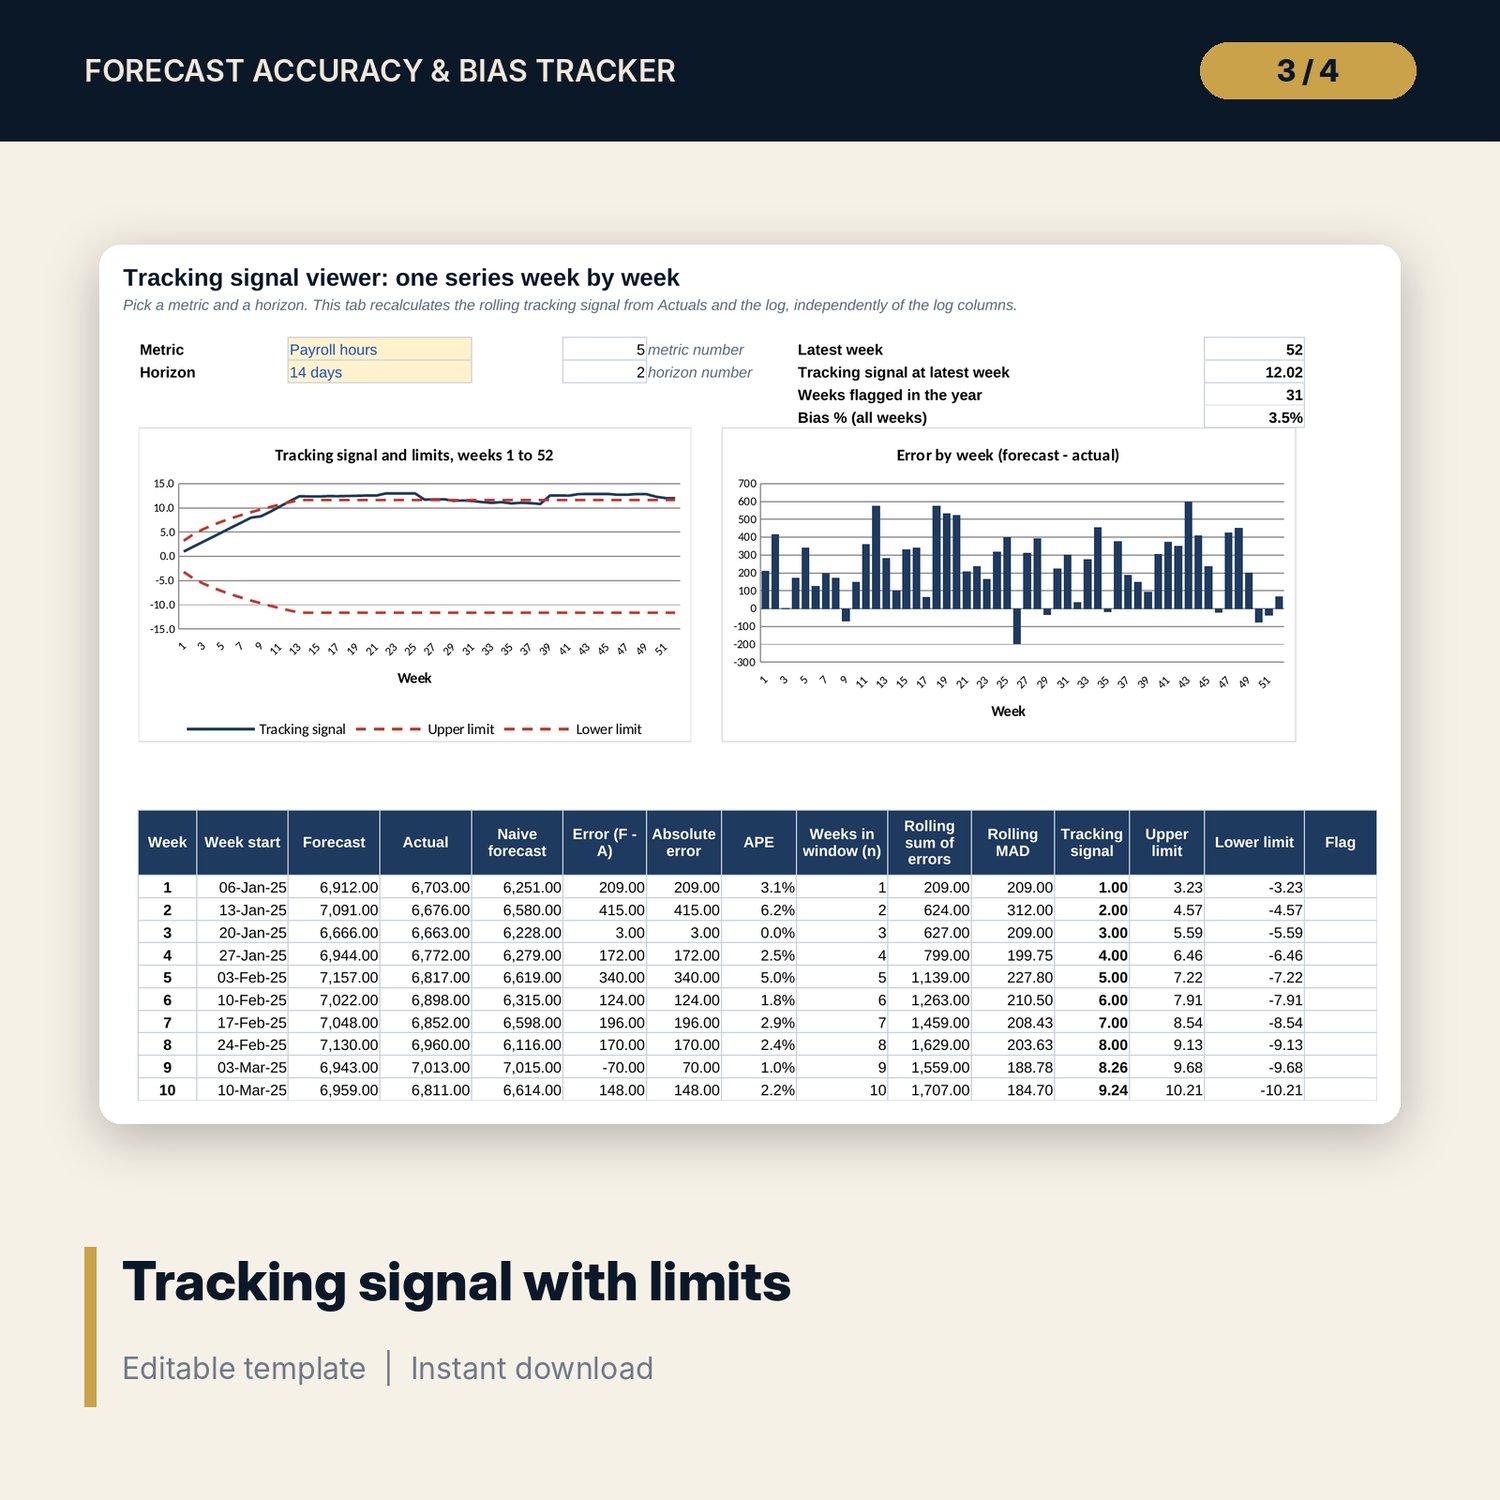
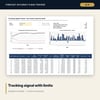
- Tracking: week-by-week tracking signal with upper and lower limits for any metric and horizon, with 2 charts
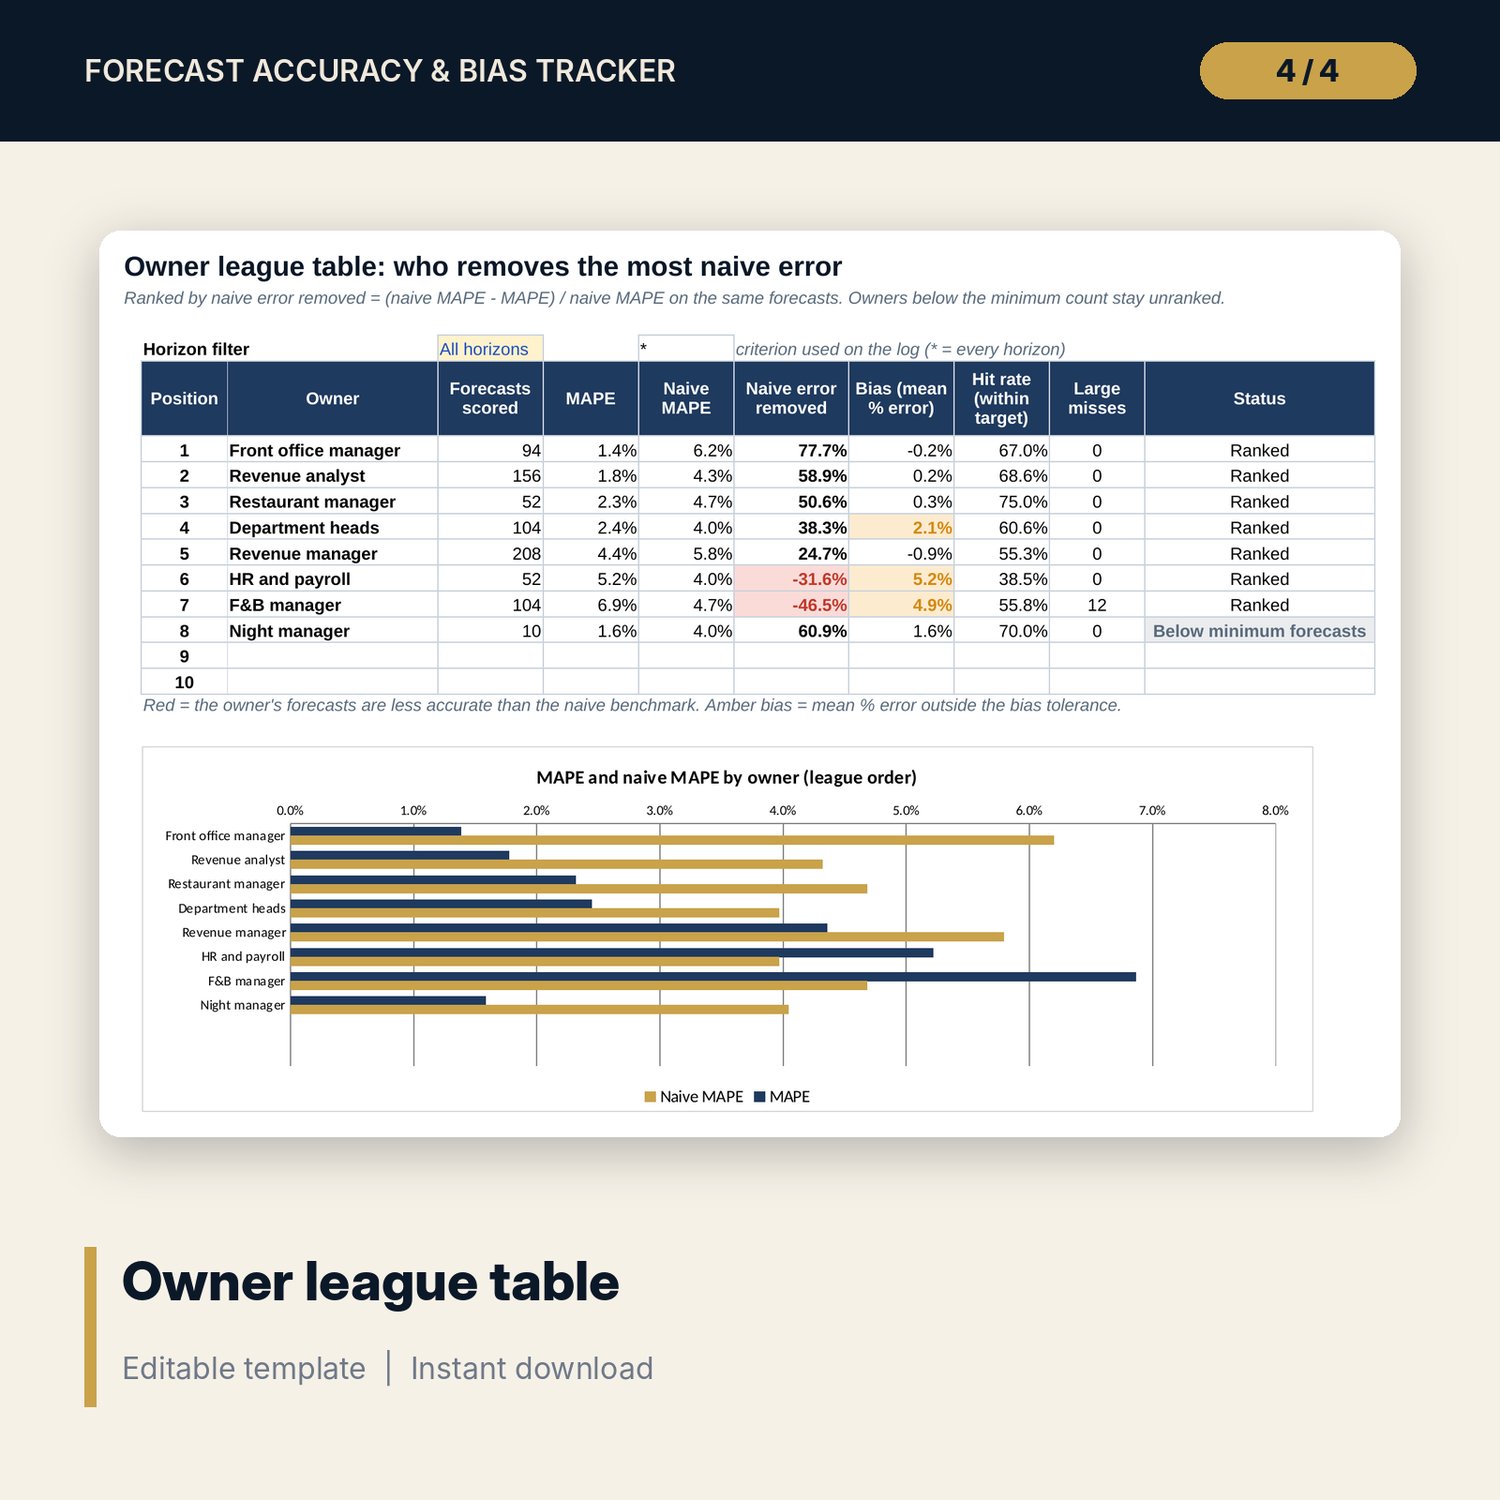
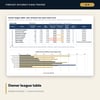
- League_Table: owners ranked by naive error removed, with MAPE, bias, hit rate and large misses
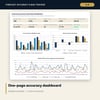
- Dashboard (one printed page), 14 integrity checks and a Method tab with 17 documented calculations
- README.txt and LICENSE-and-Terms.txt
How it works
- Name your 5 metrics, set target MAPE for each horizon and list the forecast owners on Assumptions.
- Enter this year's and last year's actuals by week on Actuals.
- Log one row per forecast on Forecast_Log: week, metric, horizon, owner and value.
- Read accuracy and value added on Accuracy, bias and tracking signals on Bias and Tracking, and the owner ranking on League_Table.
- Check the Dashboard and confirm the Checks tab shows ALL OK before the forecast review meeting.
Details
- Format: one .xlsx workbook, English
- Software: Excel 2016 or later, or LibreOffice Calc 7 or later
- No macros, no external links, no data tables, no array formulas
- Instant digital download
Good to know
- Sample data is illustrative. Replace it with your own figures.
- The tracker measures forecasts; it does not make them. Accuracy targets are inputs: set them for your hotel.
- With few weeks of data the tracking signal and the league table are unstable. The minimum count for ranking is an input.
- Single-user license. Do not redistribute.
FAQ
Why compare against a naive forecast?
A forecast is only worth the time it takes if it beats a simple rule. FVA shows, for each metric and horizon, how much error the forecast removes compared with last year's same week or the last known week.
What does the tracking signal tell me?
It is the sum of recent errors divided by their average size. Near zero, errors cancel out. Beyond the limit, the forecast is running consistently high or low, which is bias rather than bad luck.
Why is the limit not always 4?
A sum of errors grows with the number of weeks, so a fixed limit fires too often on long windows. The statistical limit grows with the square root of the weeks in the window. You can switch to a fixed limit on Assumptions.
Can I track other metrics or horizons?
Yes. Rename the 5 metrics and 3 horizons on Assumptions. Days out set the lookback for the last known actual method.
Is it fair to rank a rate forecaster against a labour forecaster?
The league uses the share of naive error removed on the same forecasts, which is unit-free and adjusts for how hard each series is to forecast.