Group & Event Sales Pipeline Forecast: Weighted Group Sales Pipeline and Revenue Forecast Excel Model for Hotels
Full description
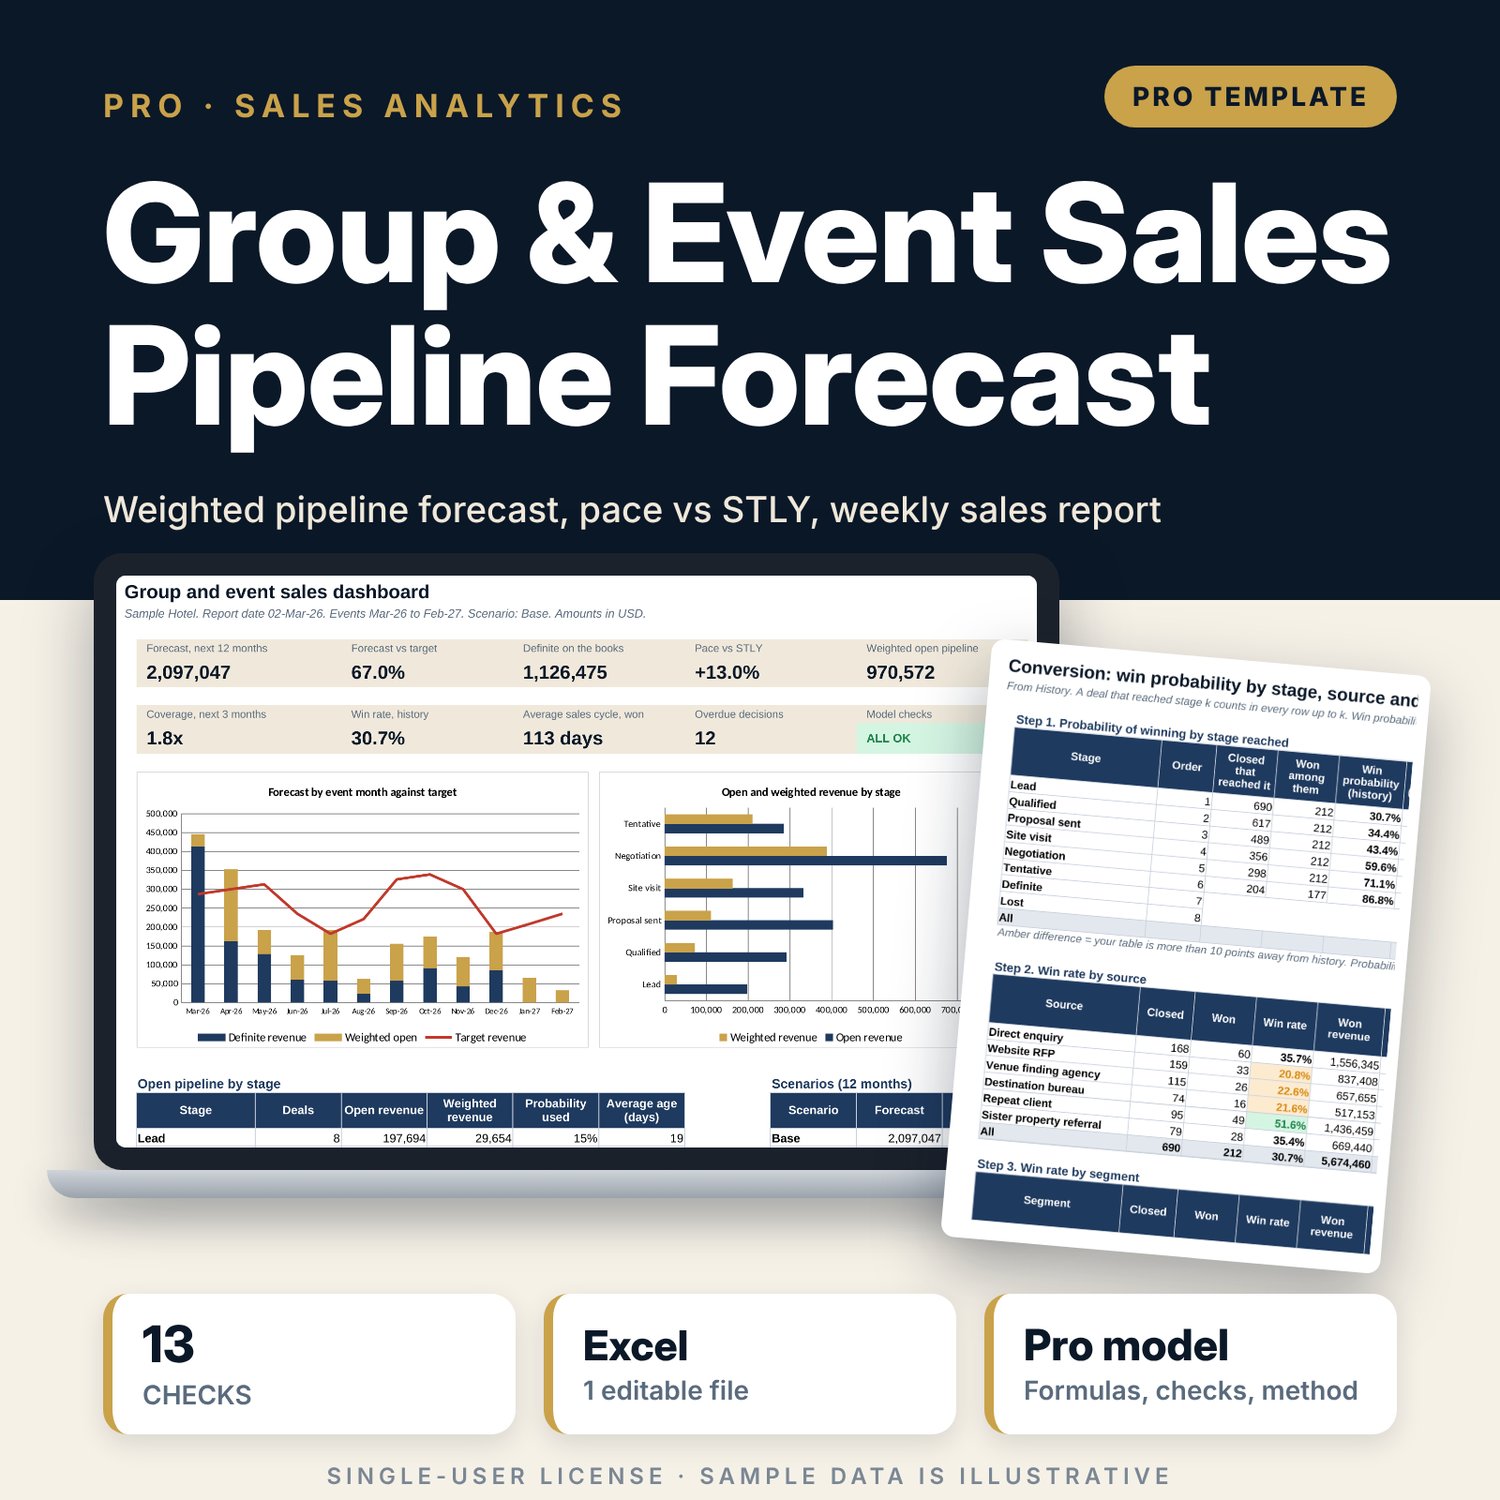
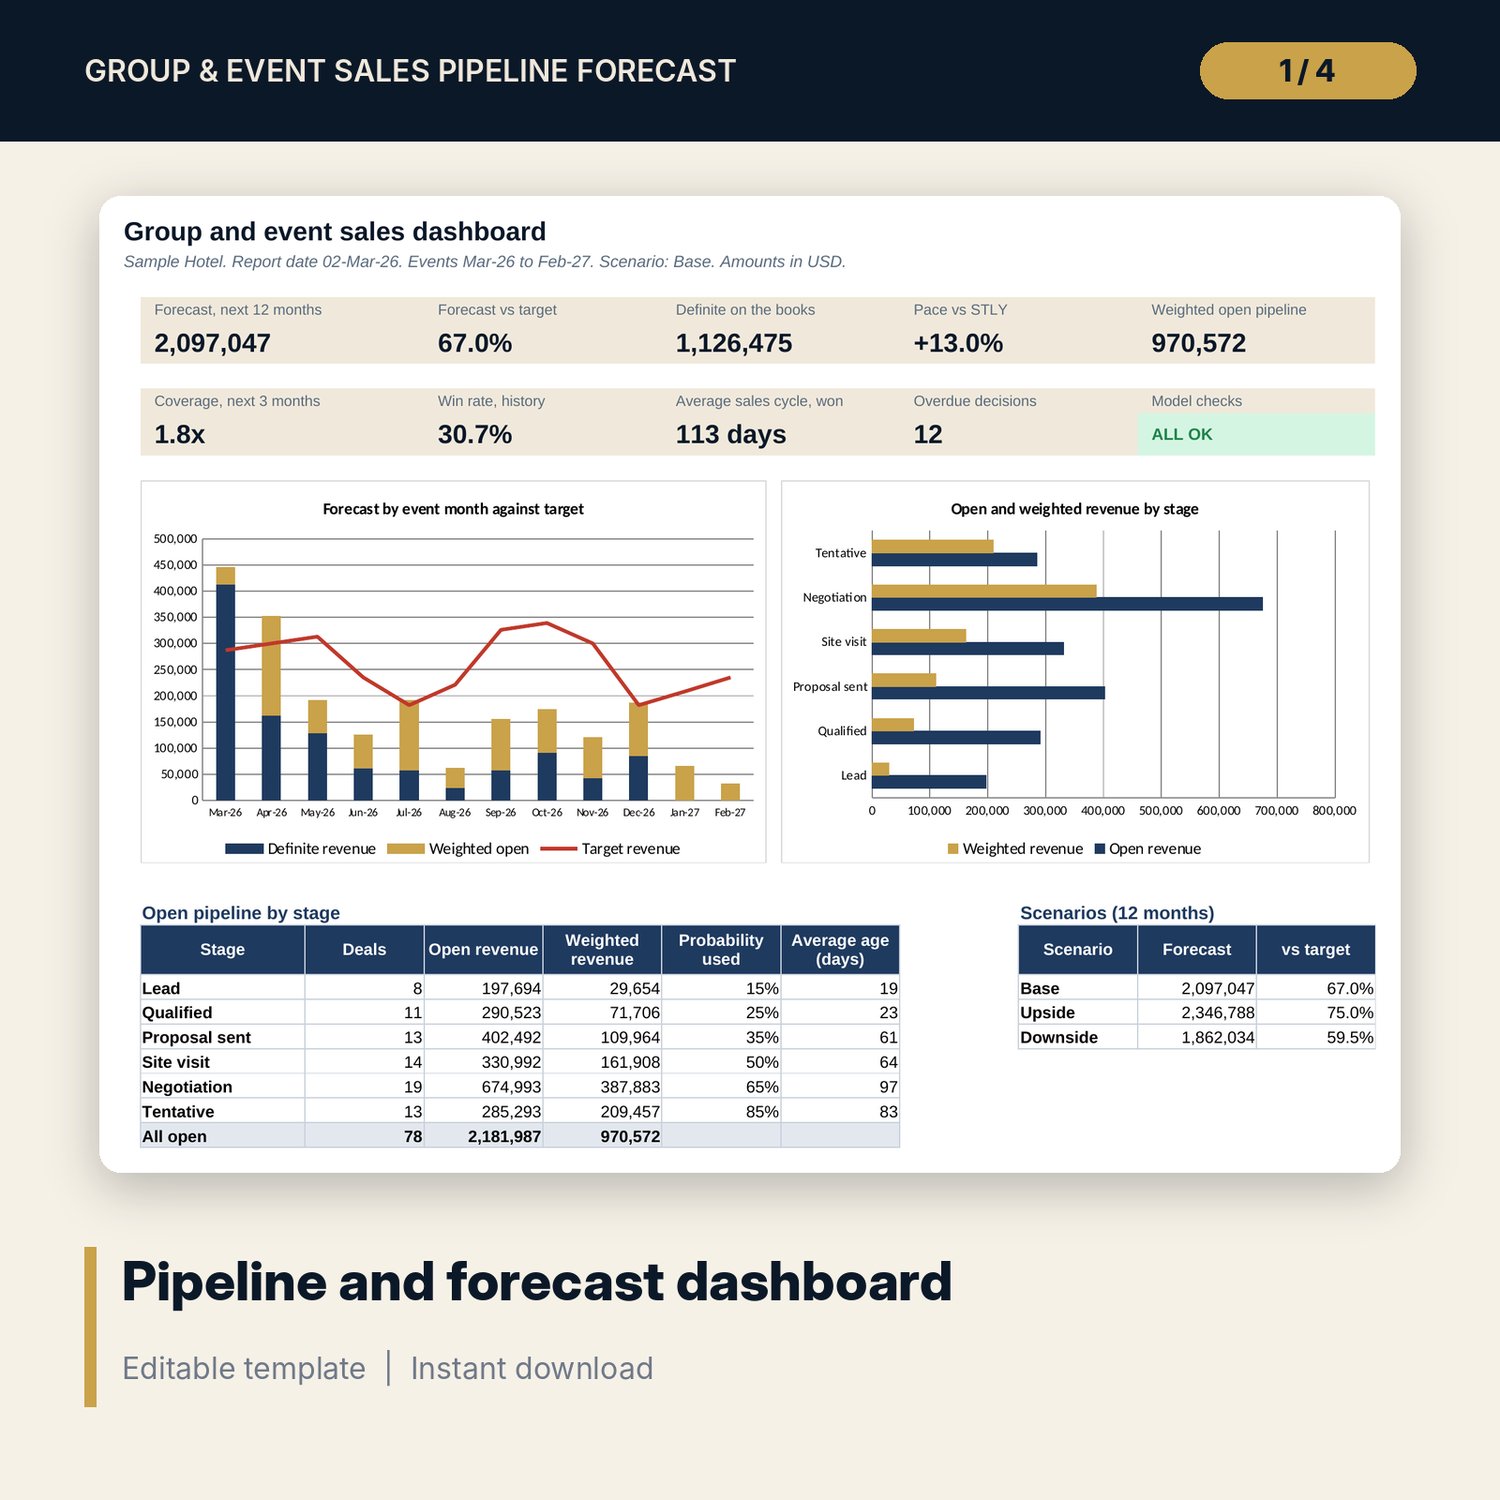
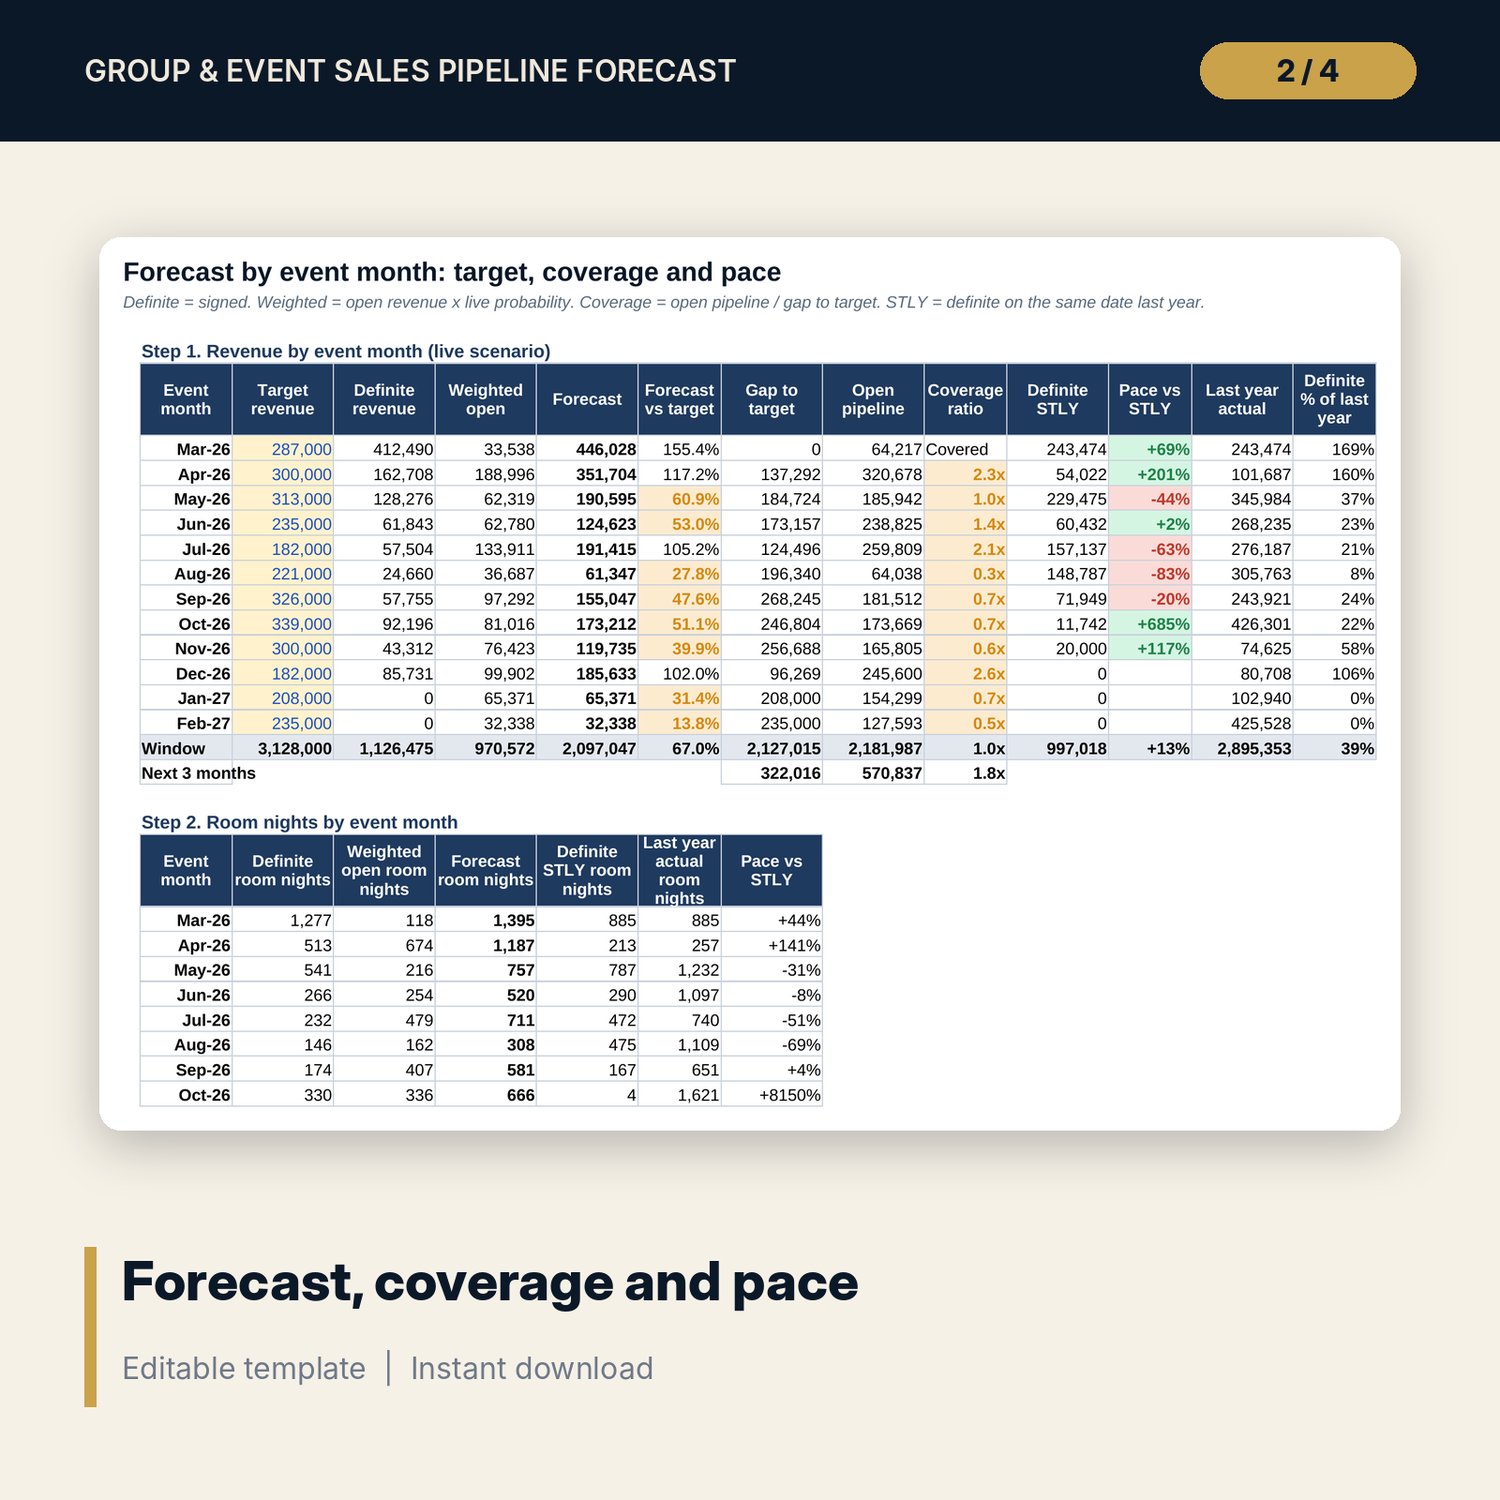
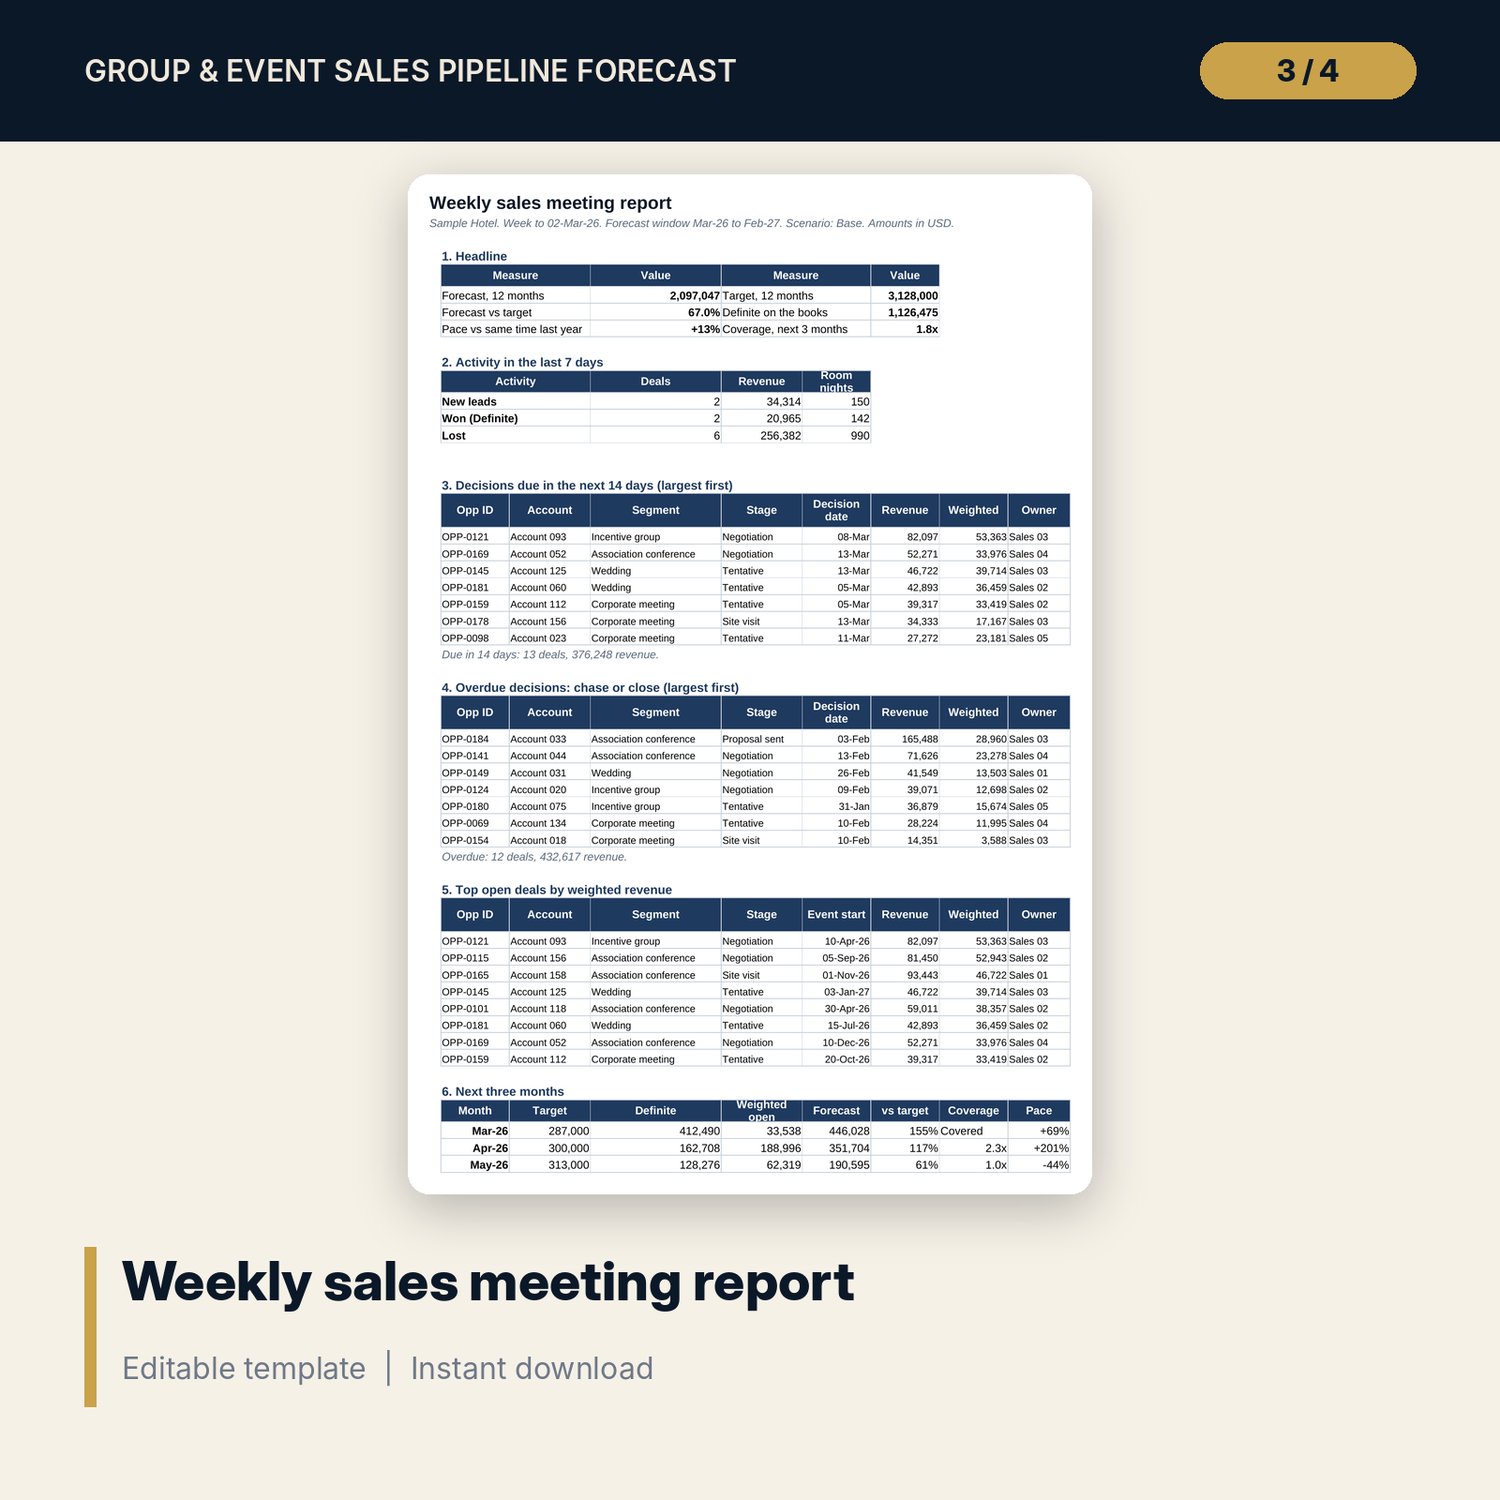
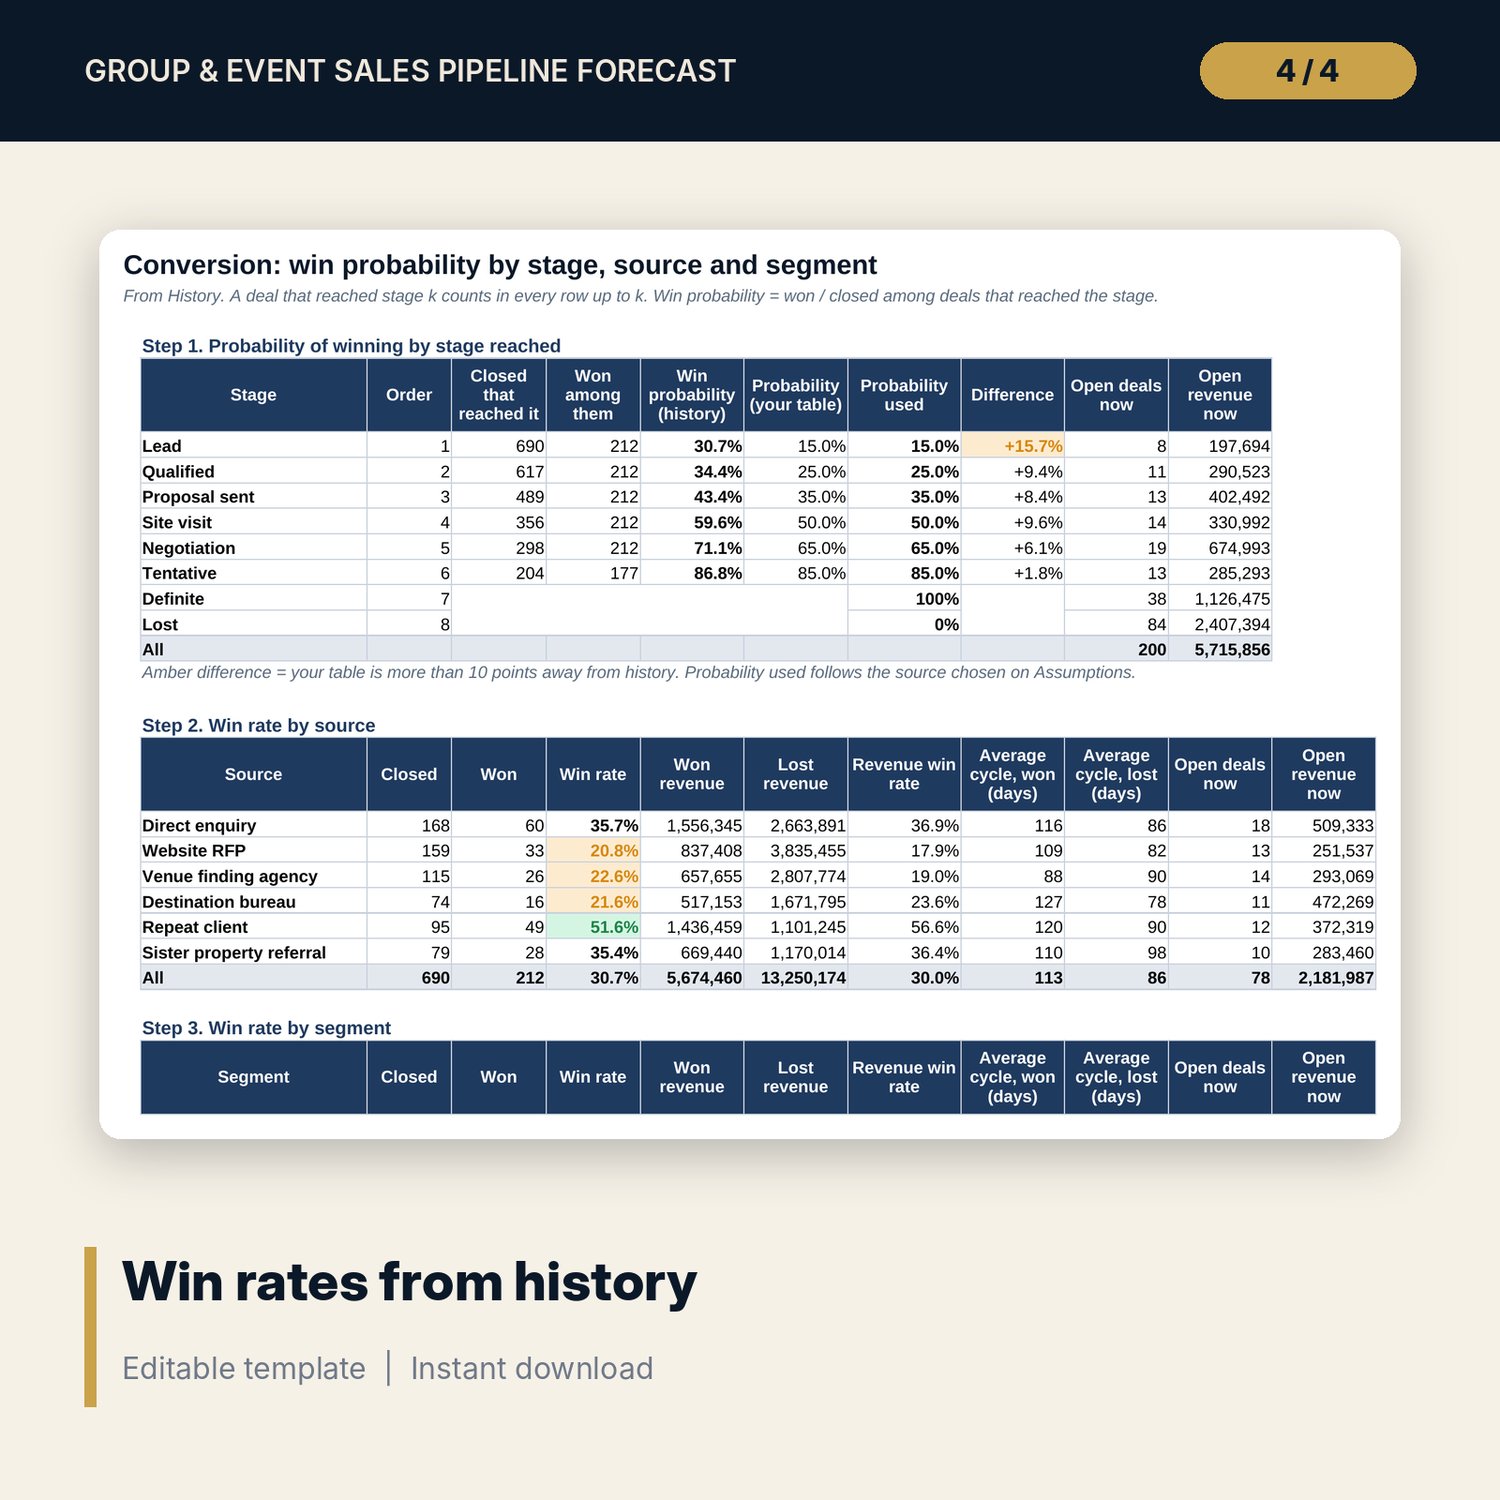
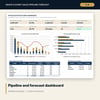
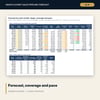
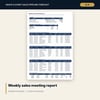
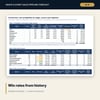
For directors of sales, general managers and revenue managers who run a weekly group and event sales meeting and need one forecast everyone trusts. The workbook takes every opportunity for the next 12 months with stage, decision date, room nights, group rate, F&B and venue revenue, and weights open deals by a stage probability taken from your own table or from closed history. It gives definite, weighted and total forecast by event month against target, a coverage ratio of open pipeline to the remaining gap, and pace against business on the books at the same time last year. History adds win rates by stage reached, source and segment, sales cycle length and lost business by reason. Three scenarios and two sensitivity grids test probability, rate and overdue decisions, and a one-page weekly report lists activity, decisions due, overdue decisions and the top deals.
Save with a bundle: this workbook is also in the Hotel Revenue & Data Analytics Pro Bundle, 25 workbooks for $59 instead of $319. All 100 Pro workbooks are in the Pro Library for $119, and all 241 templates and workbooks are in the Ultimate Hospitality Library for $149.
What is inside
- Group_Event_Sales_Pipeline_Forecast.xlsx: 11 tabs, 12,176 formulas, 4 native charts, 19 drop-down and input rules
- Opportunities with 200 sample deals (78 open, 38 definite, 84 lost) and room for 400
- History with 690 closed sample deals (room for 800) for conversion, cycle, pace and lost analysis
- Conversion: win probability for 6 stages, win rates for 6 sources and 7 segments, sales cycle
- Forecast: 12 event months with target, coverage and pace, room nights, 3 scenarios and 2 sensitivity grids (60 cells)
- Lost_Analysis: 7 lost reasons and lost revenue by stage reached, with a chart
- Weekly_Report: one printed page for the sales meeting; Dashboard: one printed page with 2 charts
- 13 integrity checks and a Method tab with 15 documented calculations
- README.txt and LICENSE-and-Terms.txt
How it works
- Set the report date, stage probabilities and thresholds on Assumptions, and monthly targets on Forecast.
- Paste opportunities for the next 12 months and closed history from your sales system.
- Choose your stage table or history as the probability source and read the forecast, coverage and pace.
- Use Conversion and Lost_Analysis to see which sources, segments and reasons need attention.
- Print Weekly_Report for the sales meeting and confirm that Checks shows ALL OK.
Details
- Format: one .xlsx workbook, English
- Software: Excel 2016 or later, or LibreOffice Calc 7 or later
- No macros, no external links, no data tables, no array formulas
- Instant digital download
Good to know
- Sample data is illustrative. Replace it with your own figures.
- Stage probabilities are estimates. Compare your table with history on the Conversion tab before you rely on it.
- The workbook is a forecasting tool, not financial advice.
- Single-user license. Do not redistribute.
FAQ
Where do the stage probabilities come from?
Either your own table on Assumptions or closed history: won deals among closed deals that reached each stage or later. One cell switches between them.
What is pace vs STLY?
Definite revenue on the books now, compared with definite revenue for the same event months that was signed by the same date last year.
What does the coverage ratio show?
Open pipeline divided by the gap between target and definite revenue. Below your wanted ratio (3.0x in the sample) the month is flagged.
How is the weekly report built?
From formulas only. Ranked lists use LARGE and MATCH on a key column, so the report updates when you change the report date.
Does it need macros or add-ins?
No. Every result is a standard worksheet formula, including the scenarios and sensitivity grids.