Hotel KPI Statistical Process Control Charts: SPC control chart workbook for hotel quality KPIs
Full description
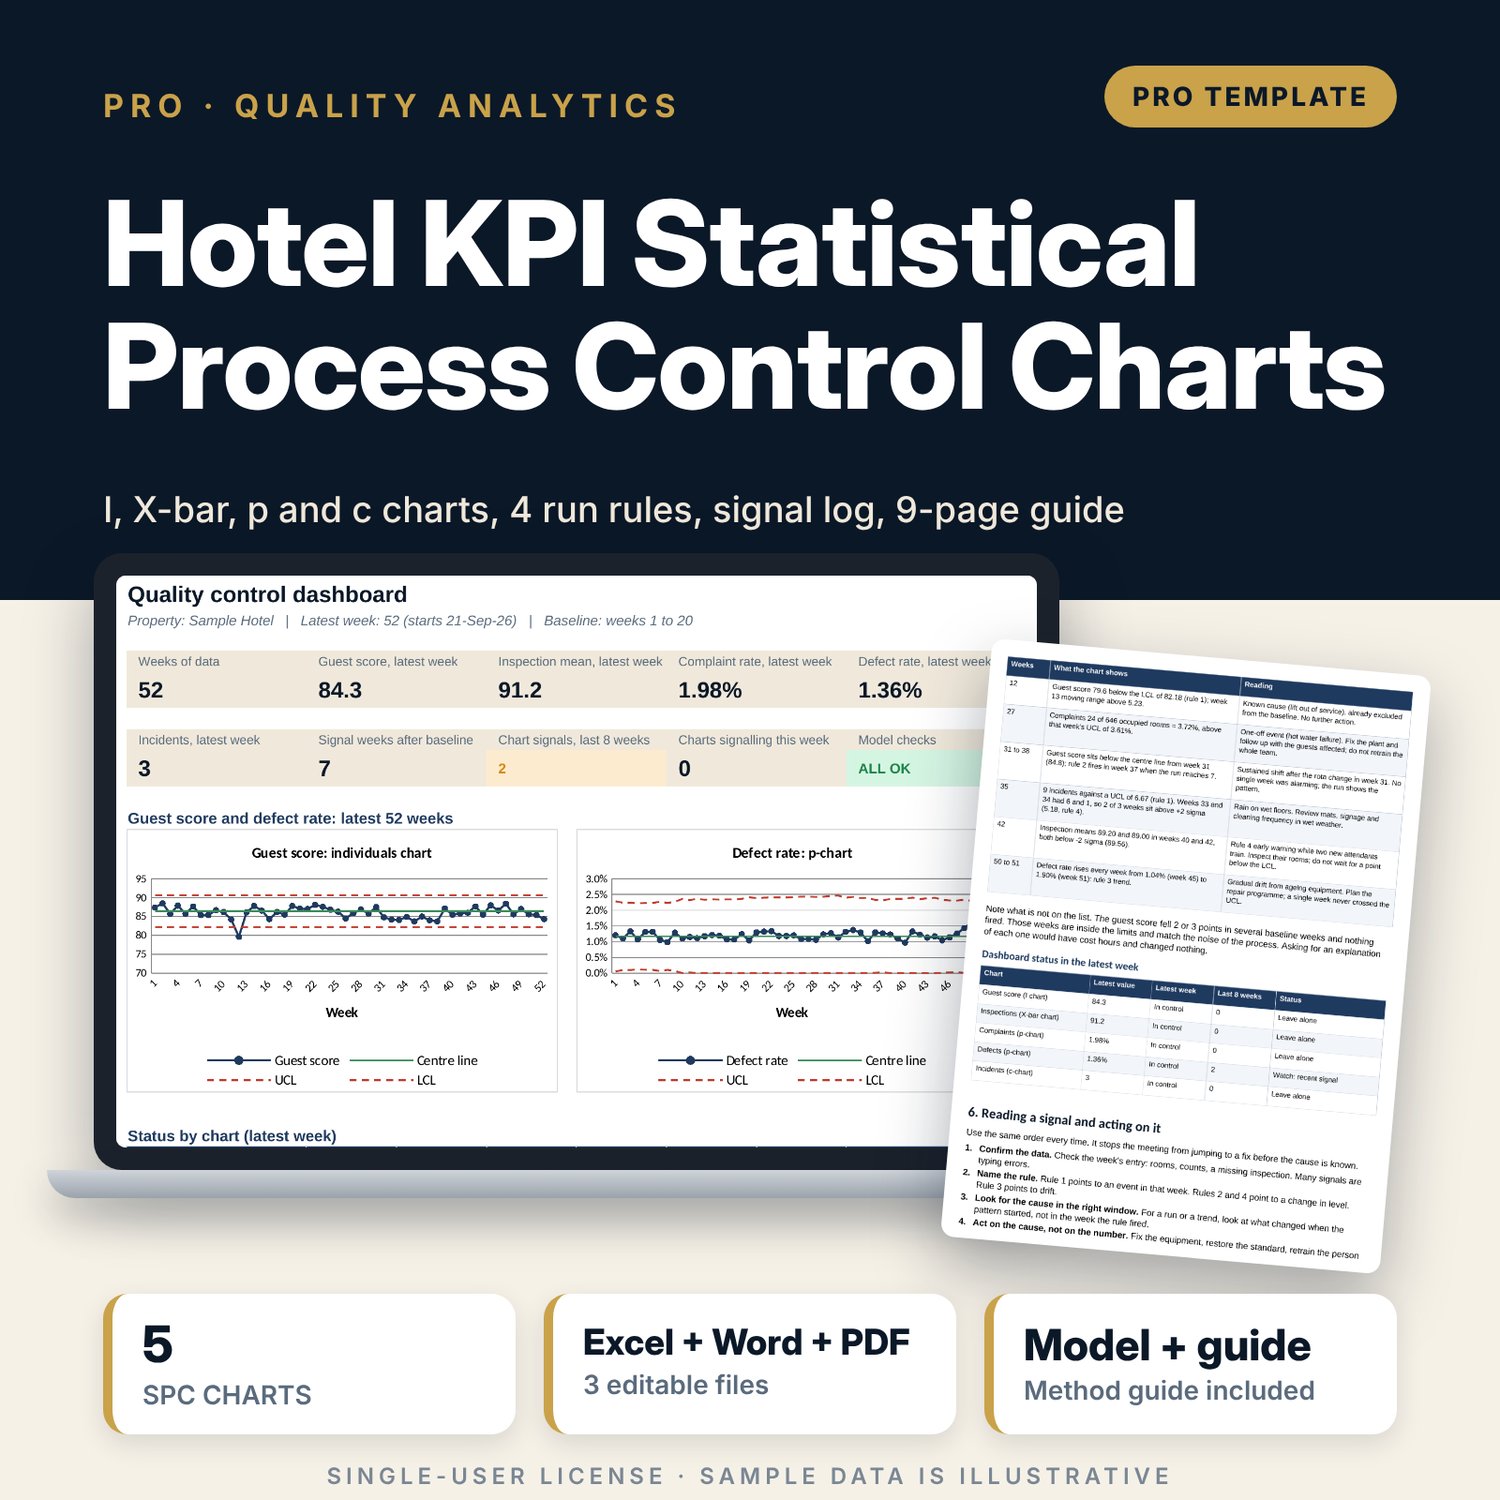
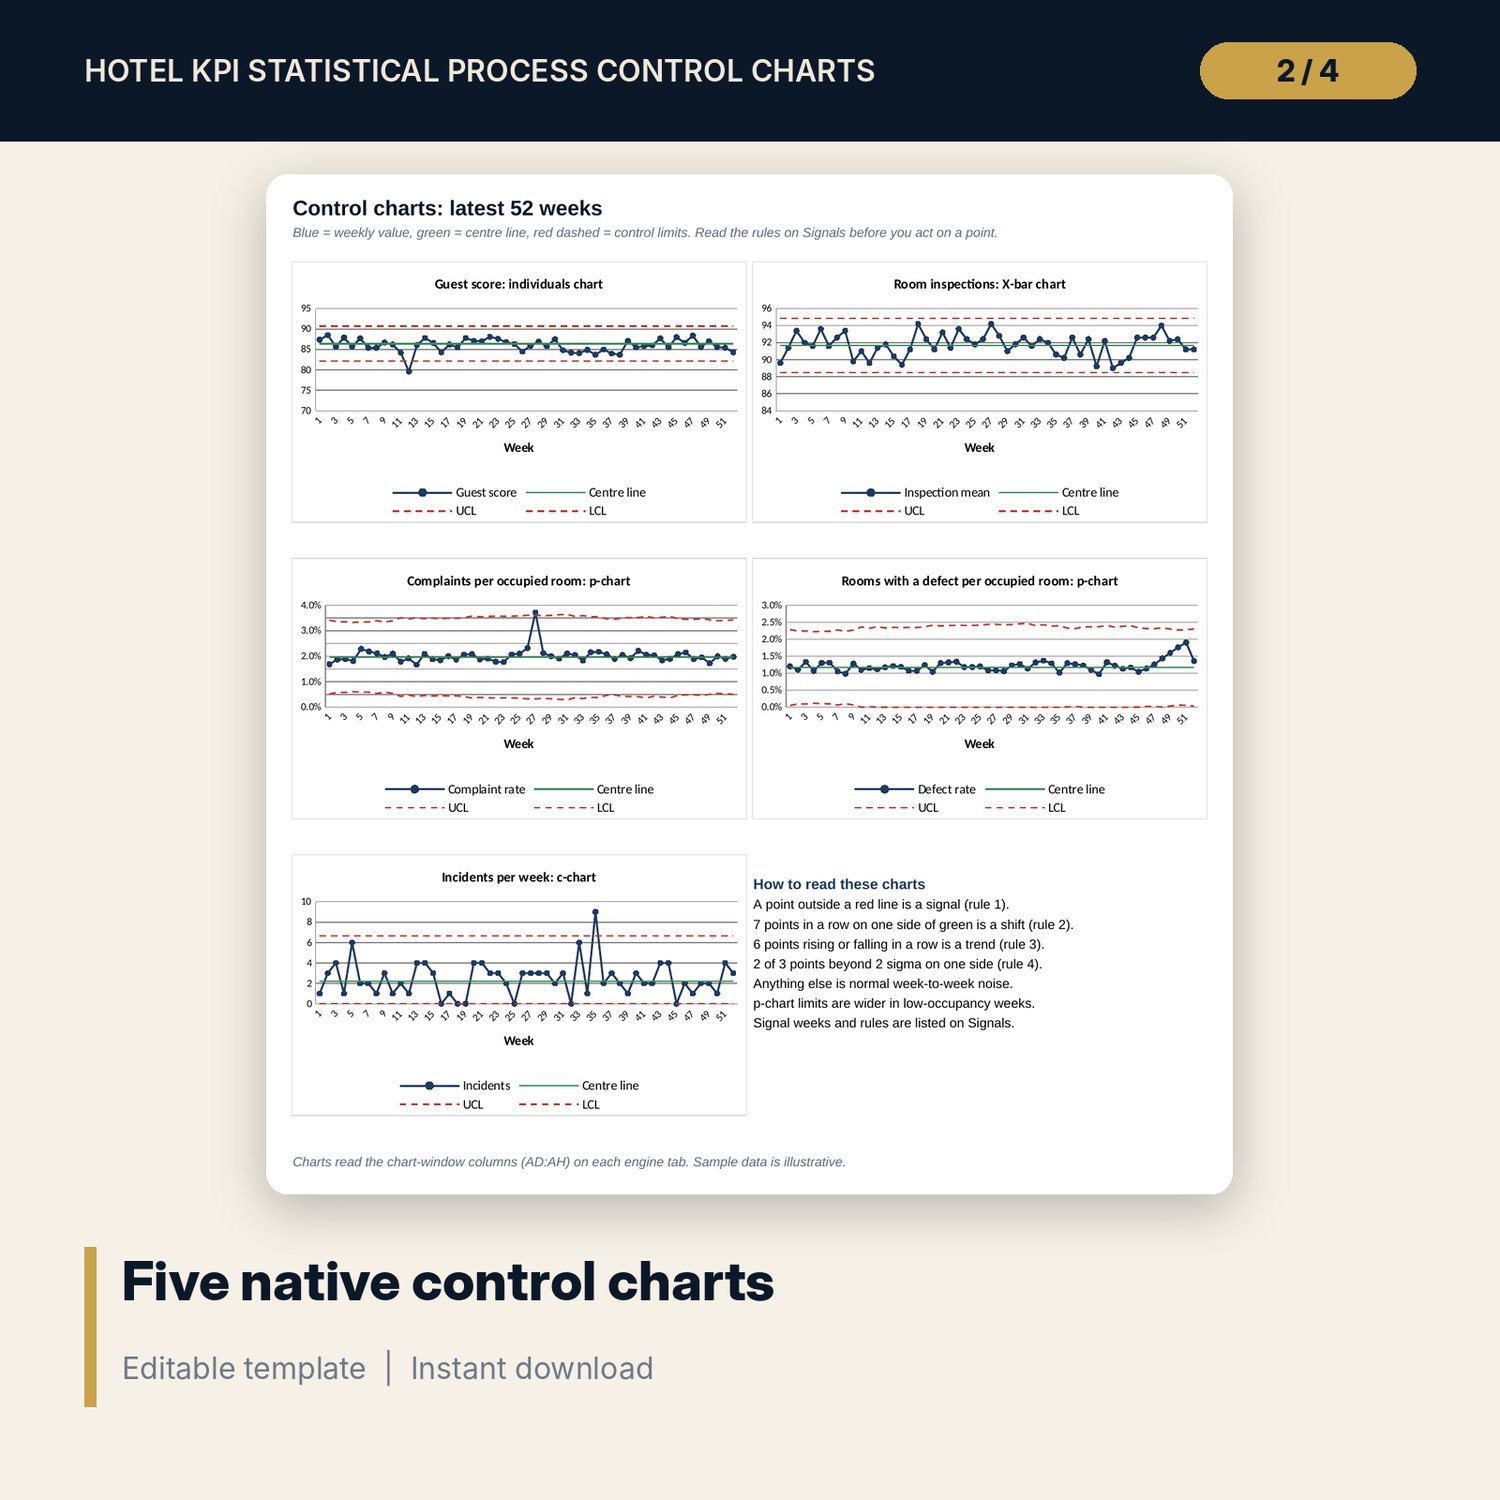
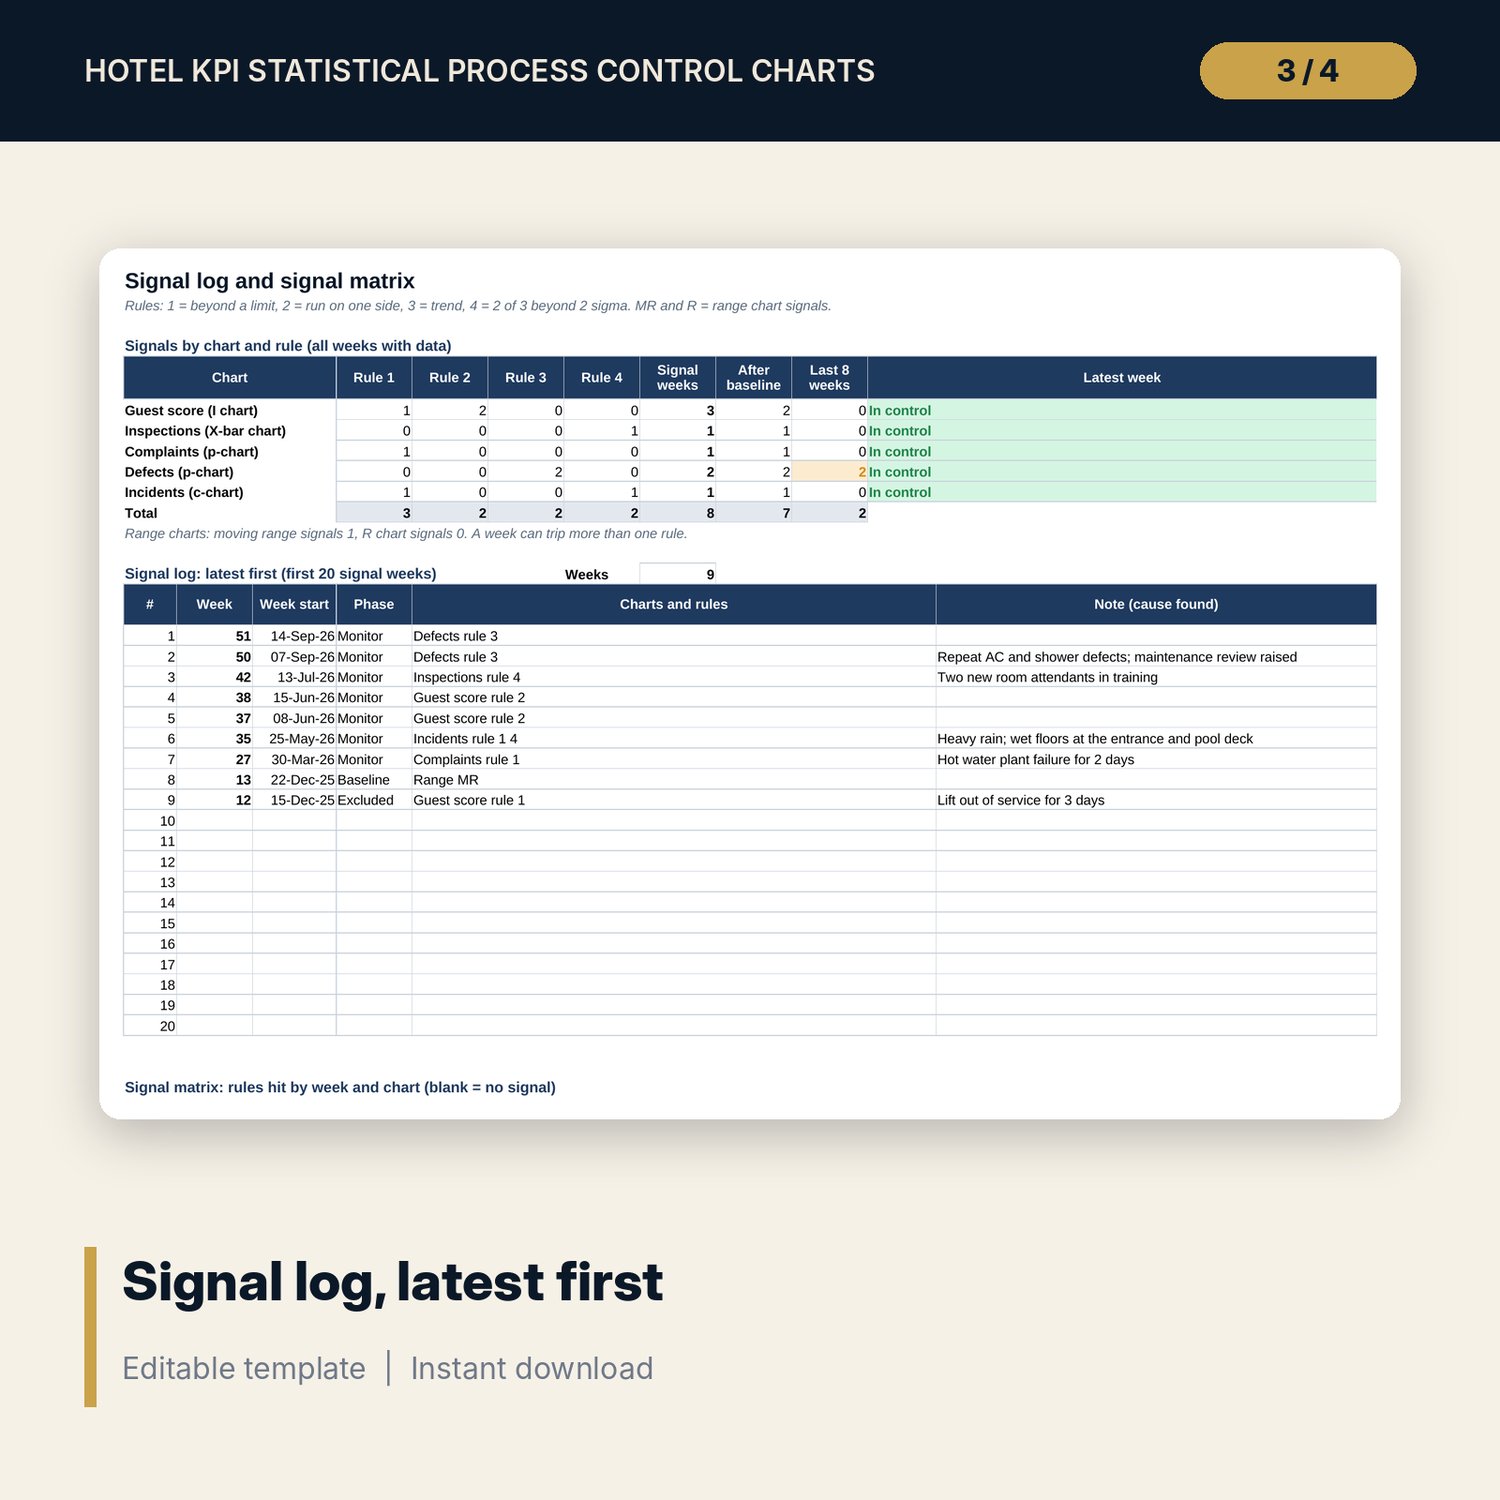
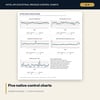
For general managers, quality and training managers, rooms division heads, chief engineers and internal auditors who review weekly quality KPIs and need to know which movements deserve action. You enter one row per week: occupied rooms, the guest score, five room inspection scores, complaints, rooms with a defect and incidents. The workbook builds an individuals and moving range chart for the guest score, an X-bar and R chart for inspections, p-charts for complaints and defects per occupied room (limits move with each week's rooms) and a c-chart for incidents. Centre lines and limits come from a baseline period you choose, with documented exclusions, and the standard SPC constants table. Four run rules (beyond limits, 7 in a row on one side, trend of 6, 2 of 3 beyond 2 sigma) are tested in visible helper columns for every week, and a signal log lists the weeks to investigate, latest first, with the cause you recorded.
Save with a bundle: this workbook is also in the Hotel Revenue & Data Analytics Pro Bundle, 25 workbooks for $59 instead of $319. All 100 Pro workbooks are in the Pro Library for $119, and all 241 templates and workbooks are in the Ultimate Hospitality Library for $149.
What is inside
- Hotel_KPI_SPC_Charts.xlsx: 12 tabs, 15,283 formulas, 7 native line charts with centre line and control limits, 14 integrity checks, a Method tab with 18 calculation notes.
- Sample data (illustrative): 52 weeks with 52 spare rows, 260 room inspection scores, planted special causes so every rule visibly fires.
- 5 control charts, each with an 11-column run-rule engine, plus moving range and R range checks.
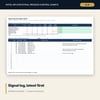
- Signals tab: rule counts by chart, a 20-row signal log (latest first) and a 104-week signal matrix.
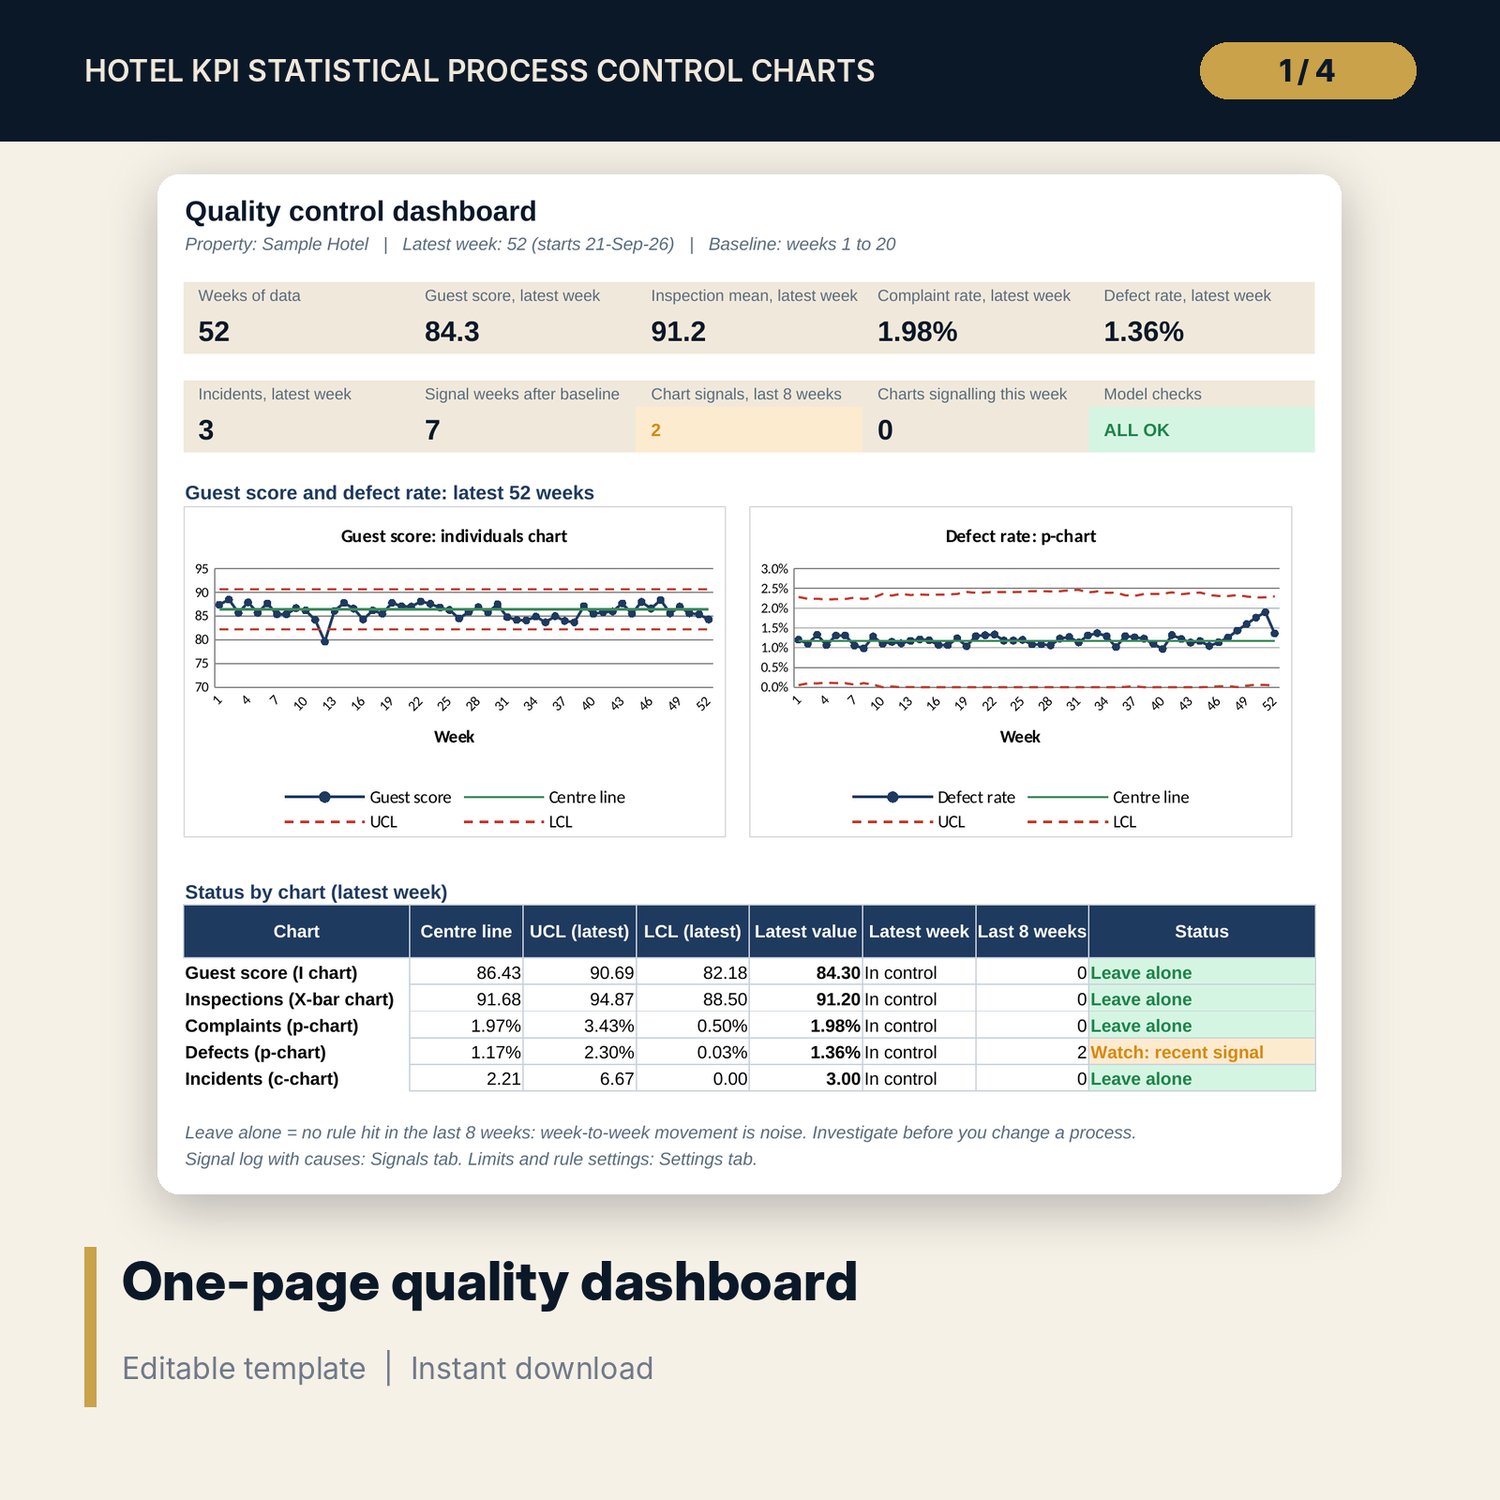
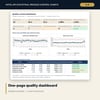
- Dashboard: 9 latest-week tiles, a check tile, 2 charts and a status line per chart (Investigate now, Watch, Leave alone), printable on one page.
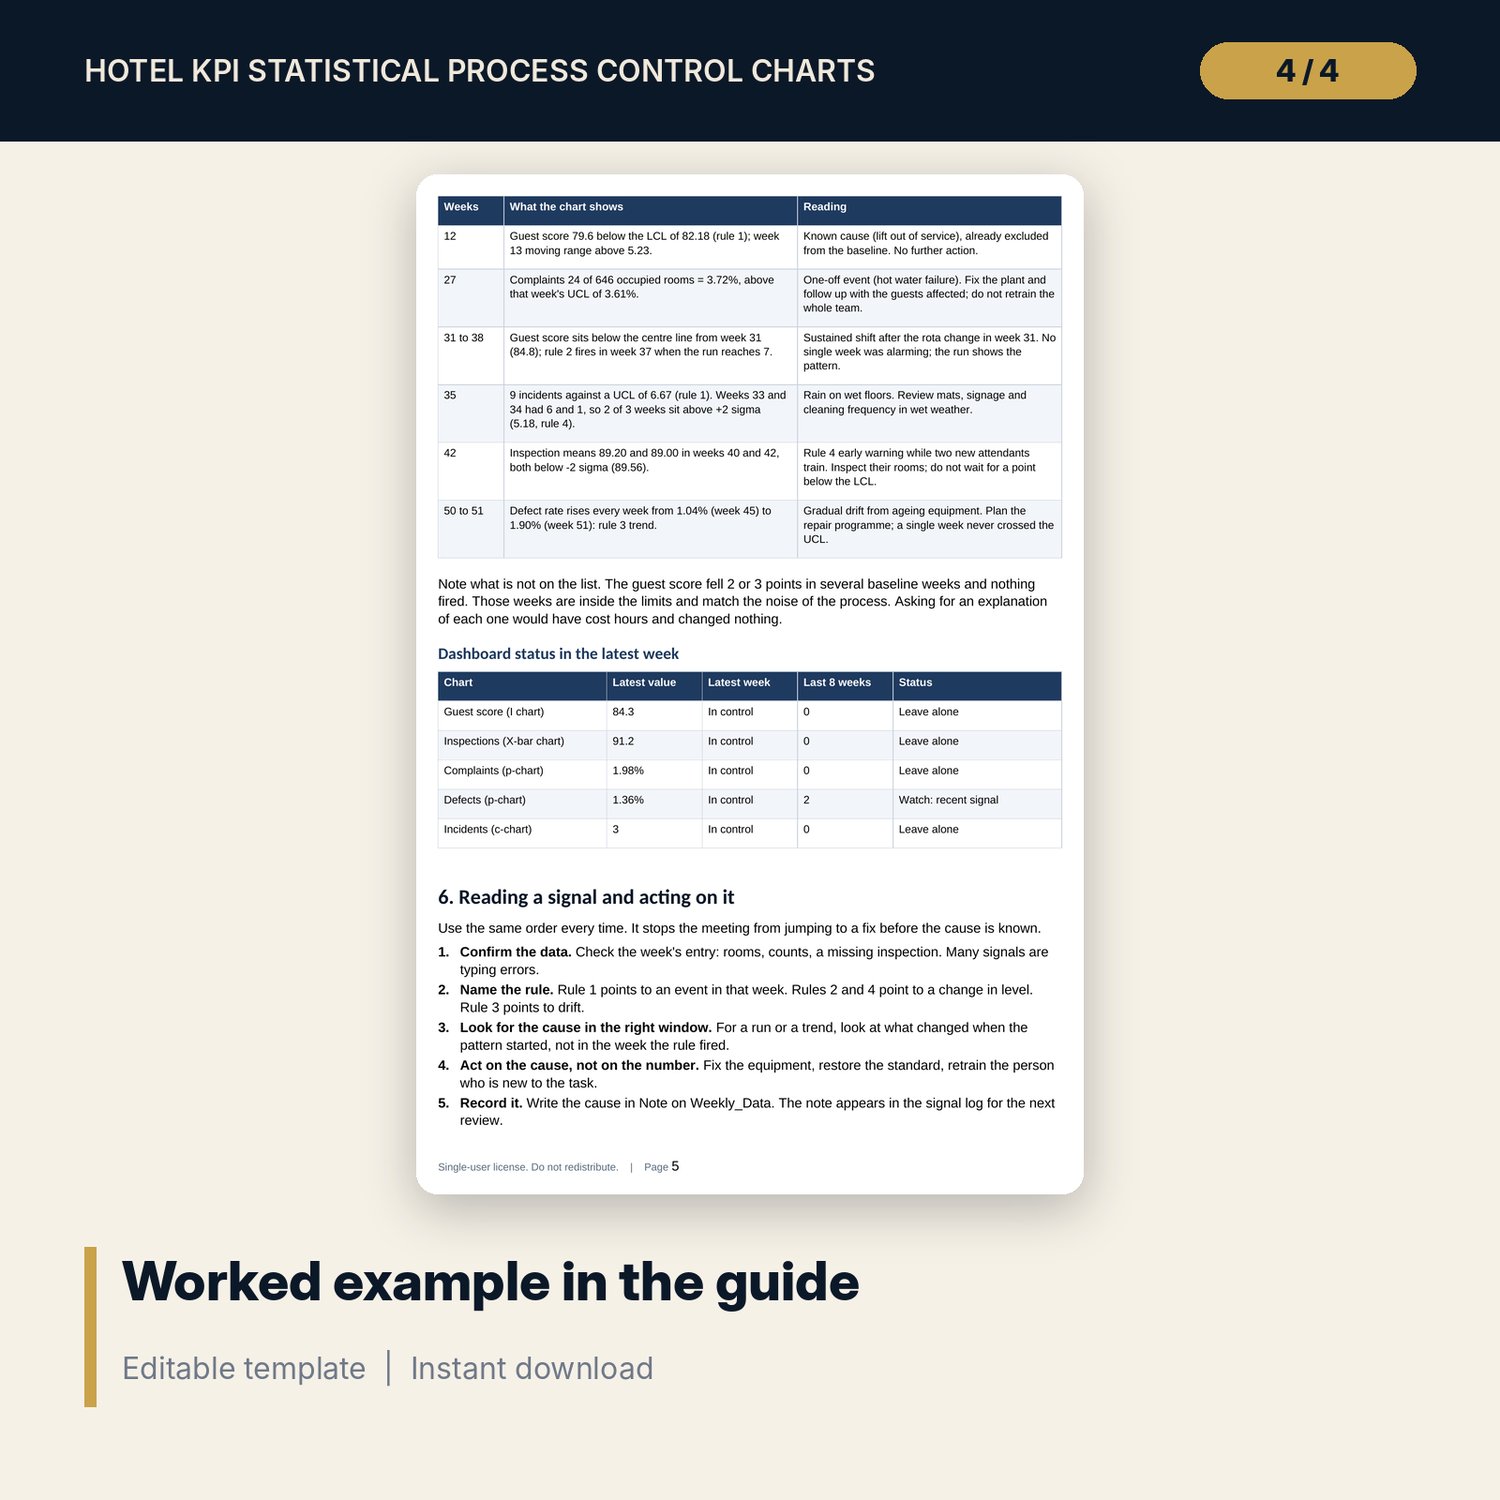
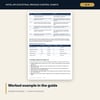
- Hotel_KPI_SPC_Guide.docx and Hotel_KPI_SPC_Guide.pdf: 9-page guide on choosing the chart, the equations, setting the baseline, a worked example on the sample results, how to act on a signal without over-reacting, common mistakes, a weekly review checklist and a glossary.
- README.txt and LICENSE-and-Terms.txt.
How it works
- Set the first week date, the baseline weeks and the rule settings on Settings.
- Enter one row per week on Weekly_Data. Mark a baseline week Exclude = Yes only with a written cause.
- The chart tabs calculate centre lines, sigma and limits from the baseline and test every week against the four rules.
- Read the Dashboard status, the charts and the signal log. Investigate signals; leave noise alone.
- Confirm the Checks tab shows ALL OK before you share the charts.
Details
- Formats: XLSX workbook, DOCX guide, PDF guide.
- Language: English.
- Software: Excel 2016 or later, or LibreOffice Calc. No macros, no add-ins.
- Weekly data, room for 104 weeks; charts show the latest 52 weeks.
- Delivery: instant download.
Good to know
- Sample data is illustrative and does not describe any hotel. Replace it with your own figures.
- Control limits describe your process; they are not targets or brand standards.
- Not legal or safety advice. Verify local requirements for incident reporting.
- Single-user license.
FAQ
Which KPIs can I chart?
Any weekly measure that fits one of the five charts: a single score (I chart), several scores a week (X-bar), a count out of occupied rooms (p-chart) or a count of events (c-chart). Rename the column headers to suit.
How many weeks do I need before the limits mean something?
At least 12 baseline weeks; 20 or more is better. The Checks tab fails if any chart has fewer than 12 baseline points.
Can I change the run rules?
Yes. The sigma multiplier, run length, trend length and the 2-of-3 zone are inputs on Settings. Every chart recalculates.
Why do the p-chart limits change every week?
The limit depends on the number of occupied rooms. A quiet week has fewer rooms, so its rate moves more by chance and its limits are wider.
Does it work with fewer than 5 inspections a week?
Yes. Set the subgroup size to 2, 3, 4 or 5 on Settings and enter that many scores every week. A check flags weeks with a different count.