Hotel Data Dashboard with Rolling 12 Months: Excel hotel KPI dashboard with month, YTD and rolling 12 months
Full description
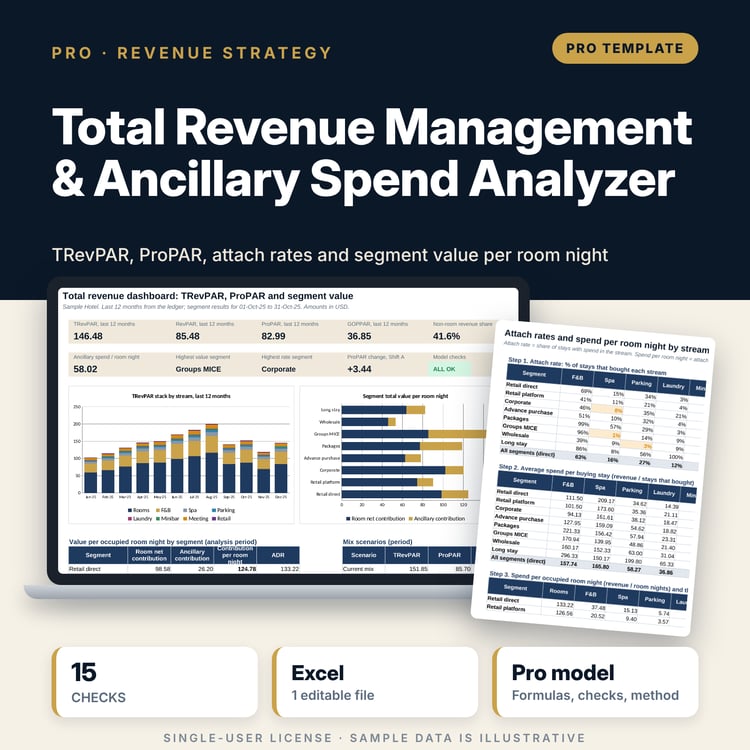
For general managers, financial controllers and owners who want one monthly view of the hotel without pivot tables or macros. You keep one data table: one row per month for Actual and one for Budget, 40 metrics across rooms, F&B, events, spa, payroll, undistributed costs, fixed charges, utilities and guest service. Pick a month and the workbook builds six period windows (month, same month last year, YTD from your fiscal year start, YTD last year, rolling 12 months and the prior rolling 12 months). The Calc engine totals every metric with SUMIFS or AVERAGEIFS, then builds 21 KPIs from the totals: occupancy, ADR, RevPAR, TRevPAR, GOP, GOP margin, GOPPAR, EBITDA after FF&E reserve, payroll %, F&B cost %, commissions per room sold and more. Ratios for YTD and rolling 12 months are always ratios of totals, never averages of monthly ratios. Movers rank revenue and cost lines by profit impact, and a Pareto chart classes cost lines A, B or C.
Save with a bundle: this workbook is also in the Hotel Revenue & Data Analytics Pro Bundle, 25 workbooks for $59 instead of $319. All 100 Pro workbooks are in the Pro Library for $119, and all 241 templates and workbooks are in the Ultimate Hospitality Library for $149.
What is inside
- Hotel_Data_Dashboard_Rolling_12_Months.xlsx: 12 tabs, 2,934 formulas, 11 native charts, 15 integrity checks, a Method tab with 16 calculation notes.
- Data: 36 months x 40 metrics for Actual and Budget (72 sample rows) plus 48 spare rows for two more years.
- Calc engine: each metric for 9 period and version windows, 21 derived KPIs and 6 variance columns with favourable and unfavourable colours.
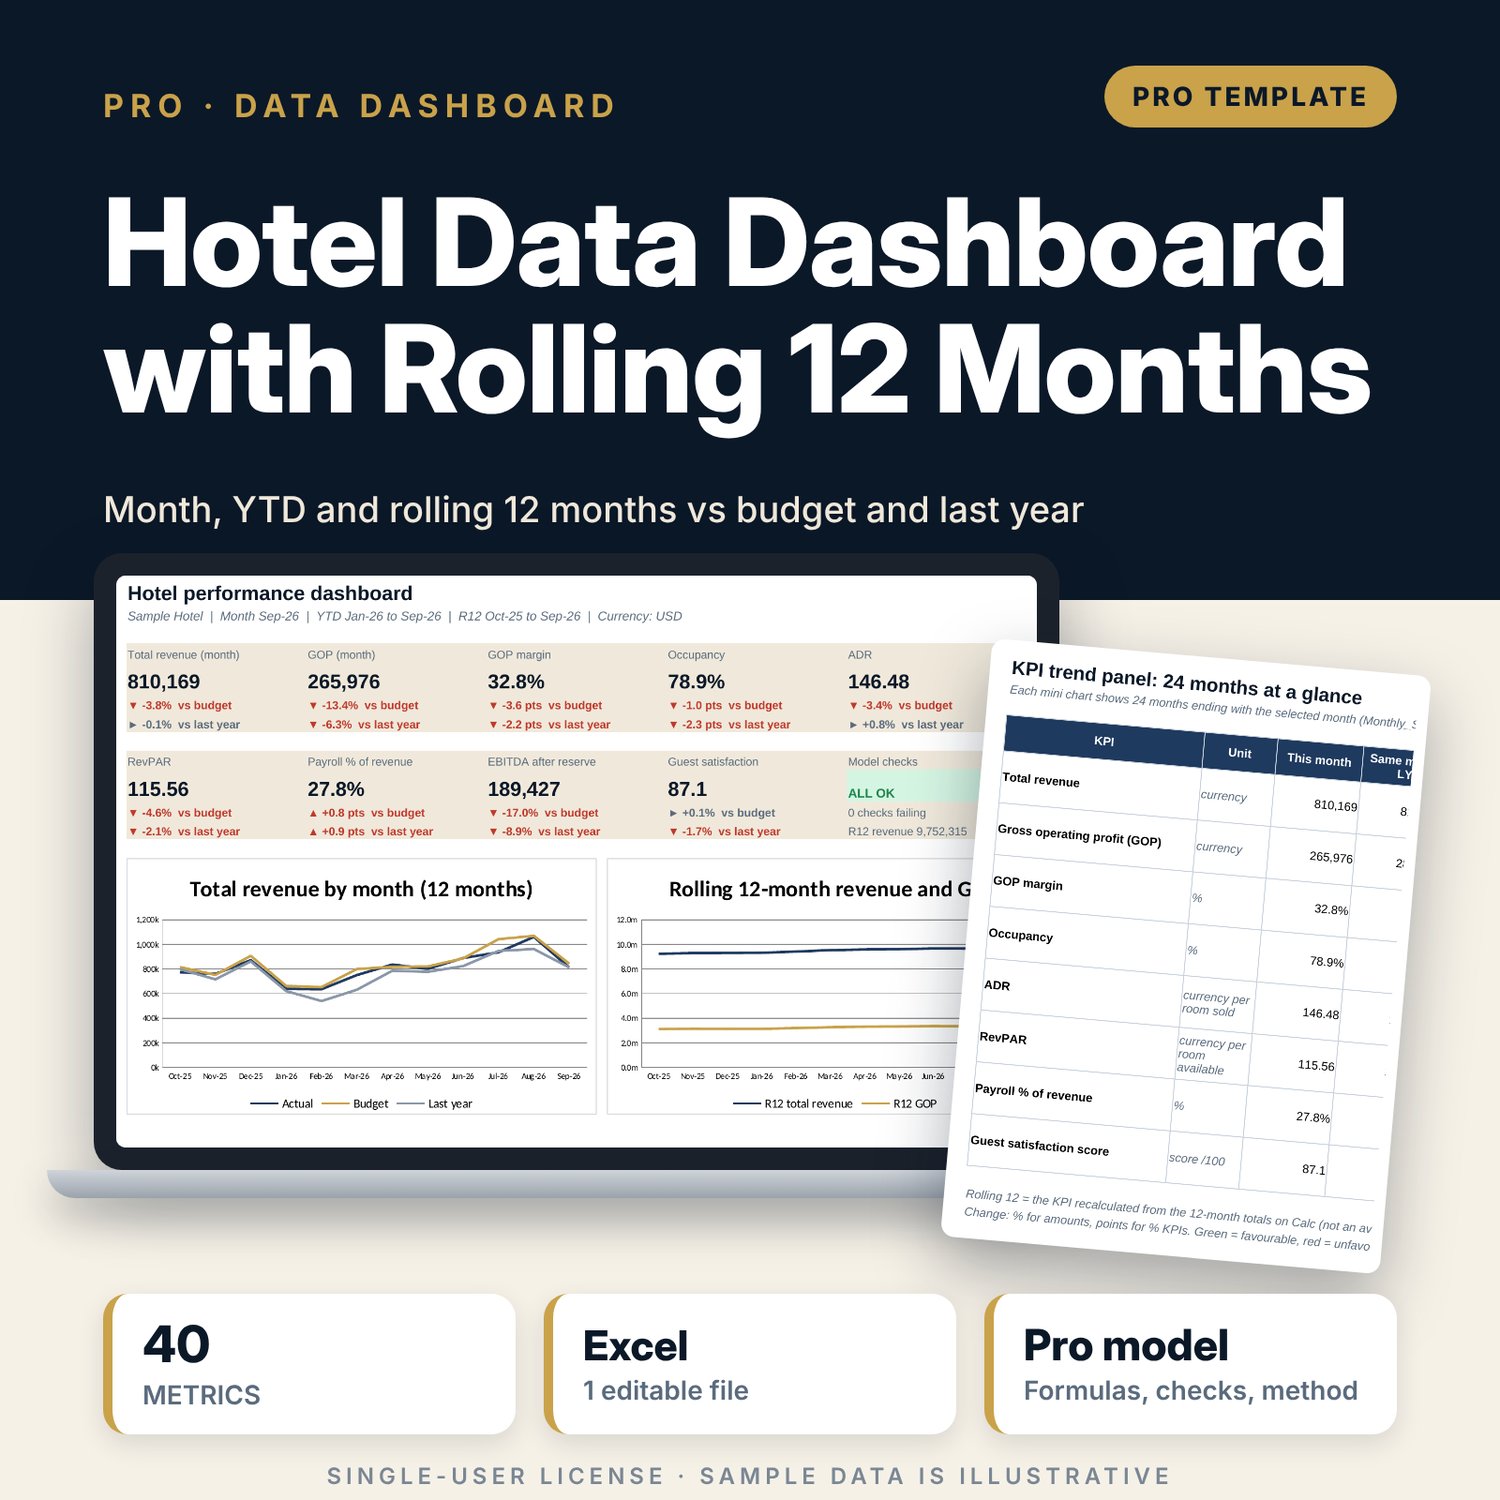
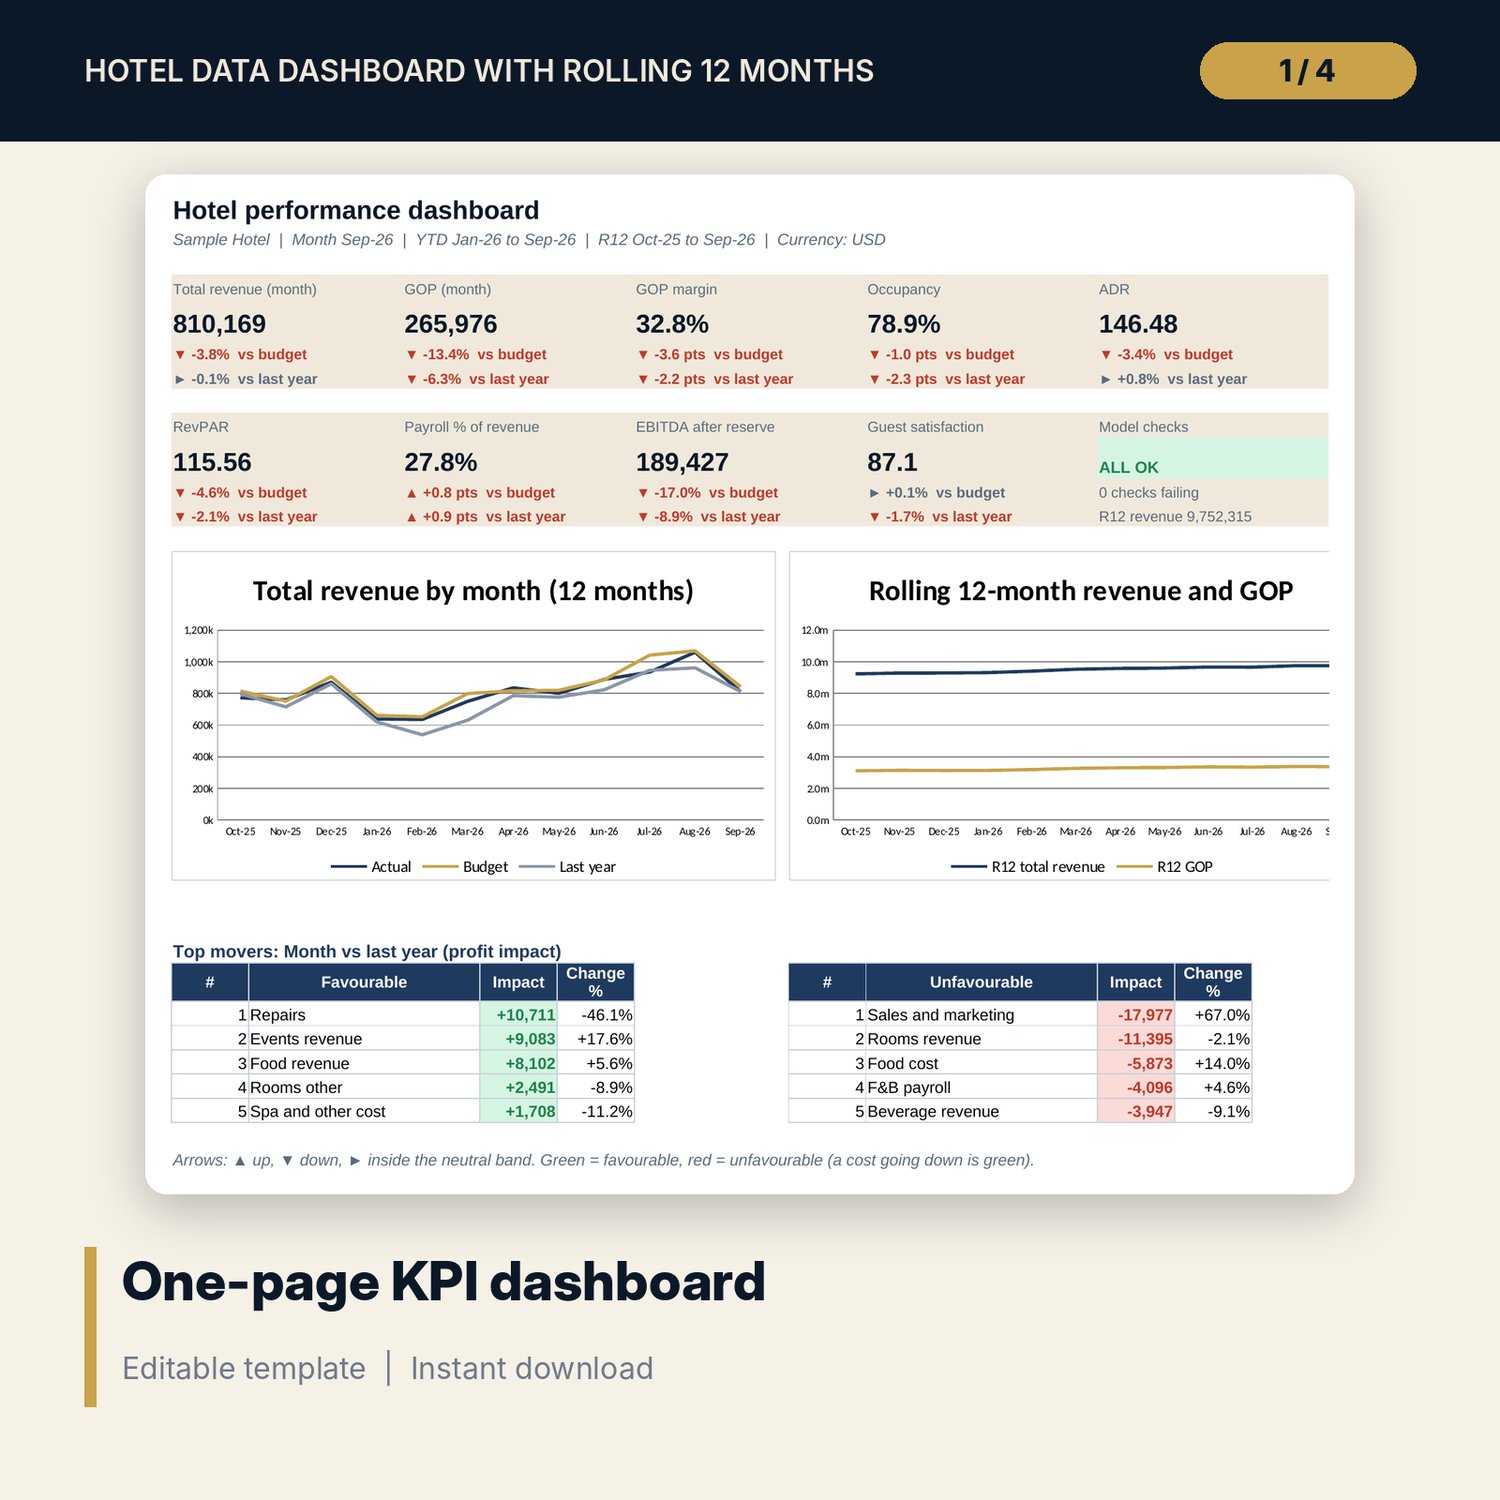
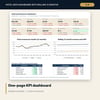
- Dashboard: 9 KPI tiles with ▲ ▼ arrows against budget and last year, a check tile, a monthly revenue chart (actual, budget, last year), a rolling 12-month revenue and GOP chart and the top movers, on one page.
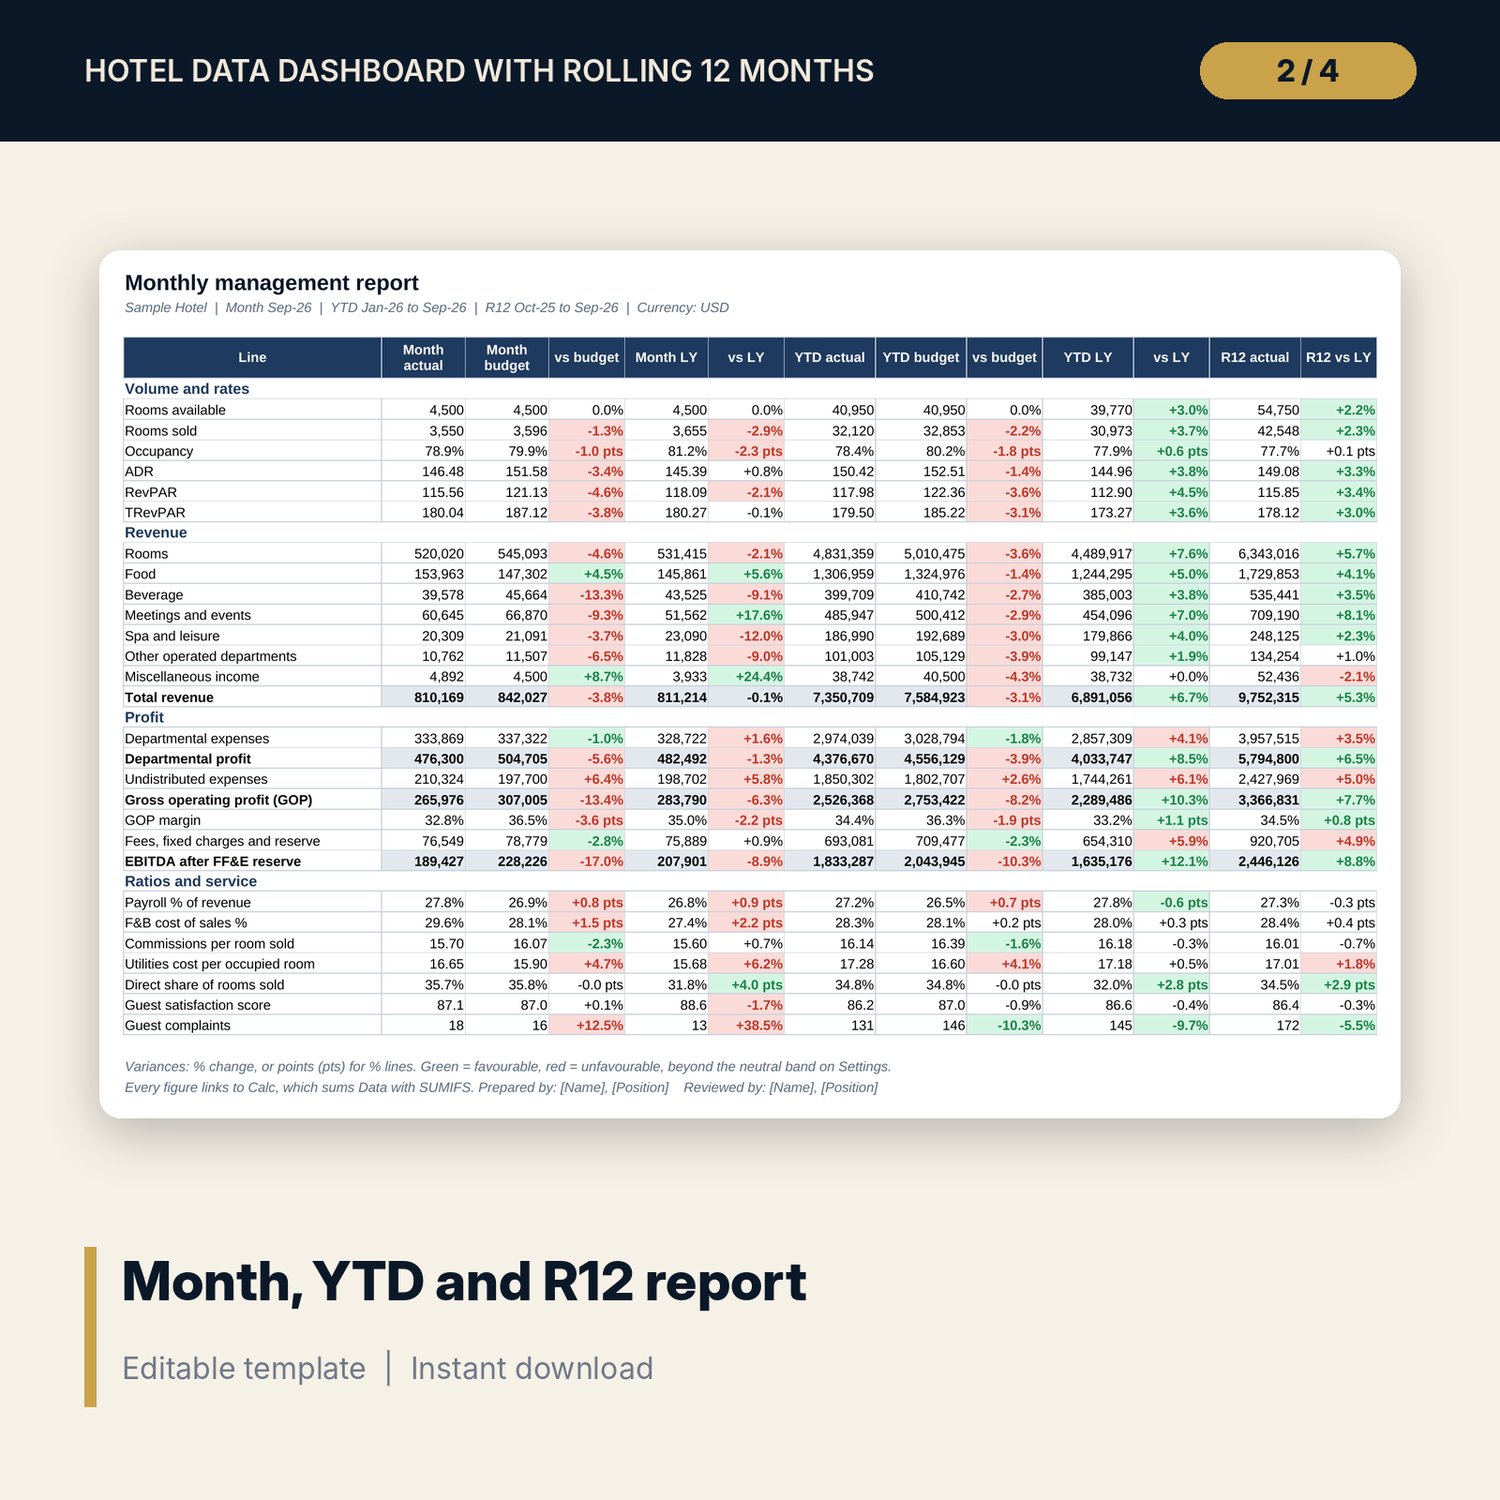
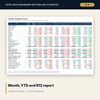
- Report: one-page management report with month, YTD and rolling 12 months against budget and last year for 28 lines.
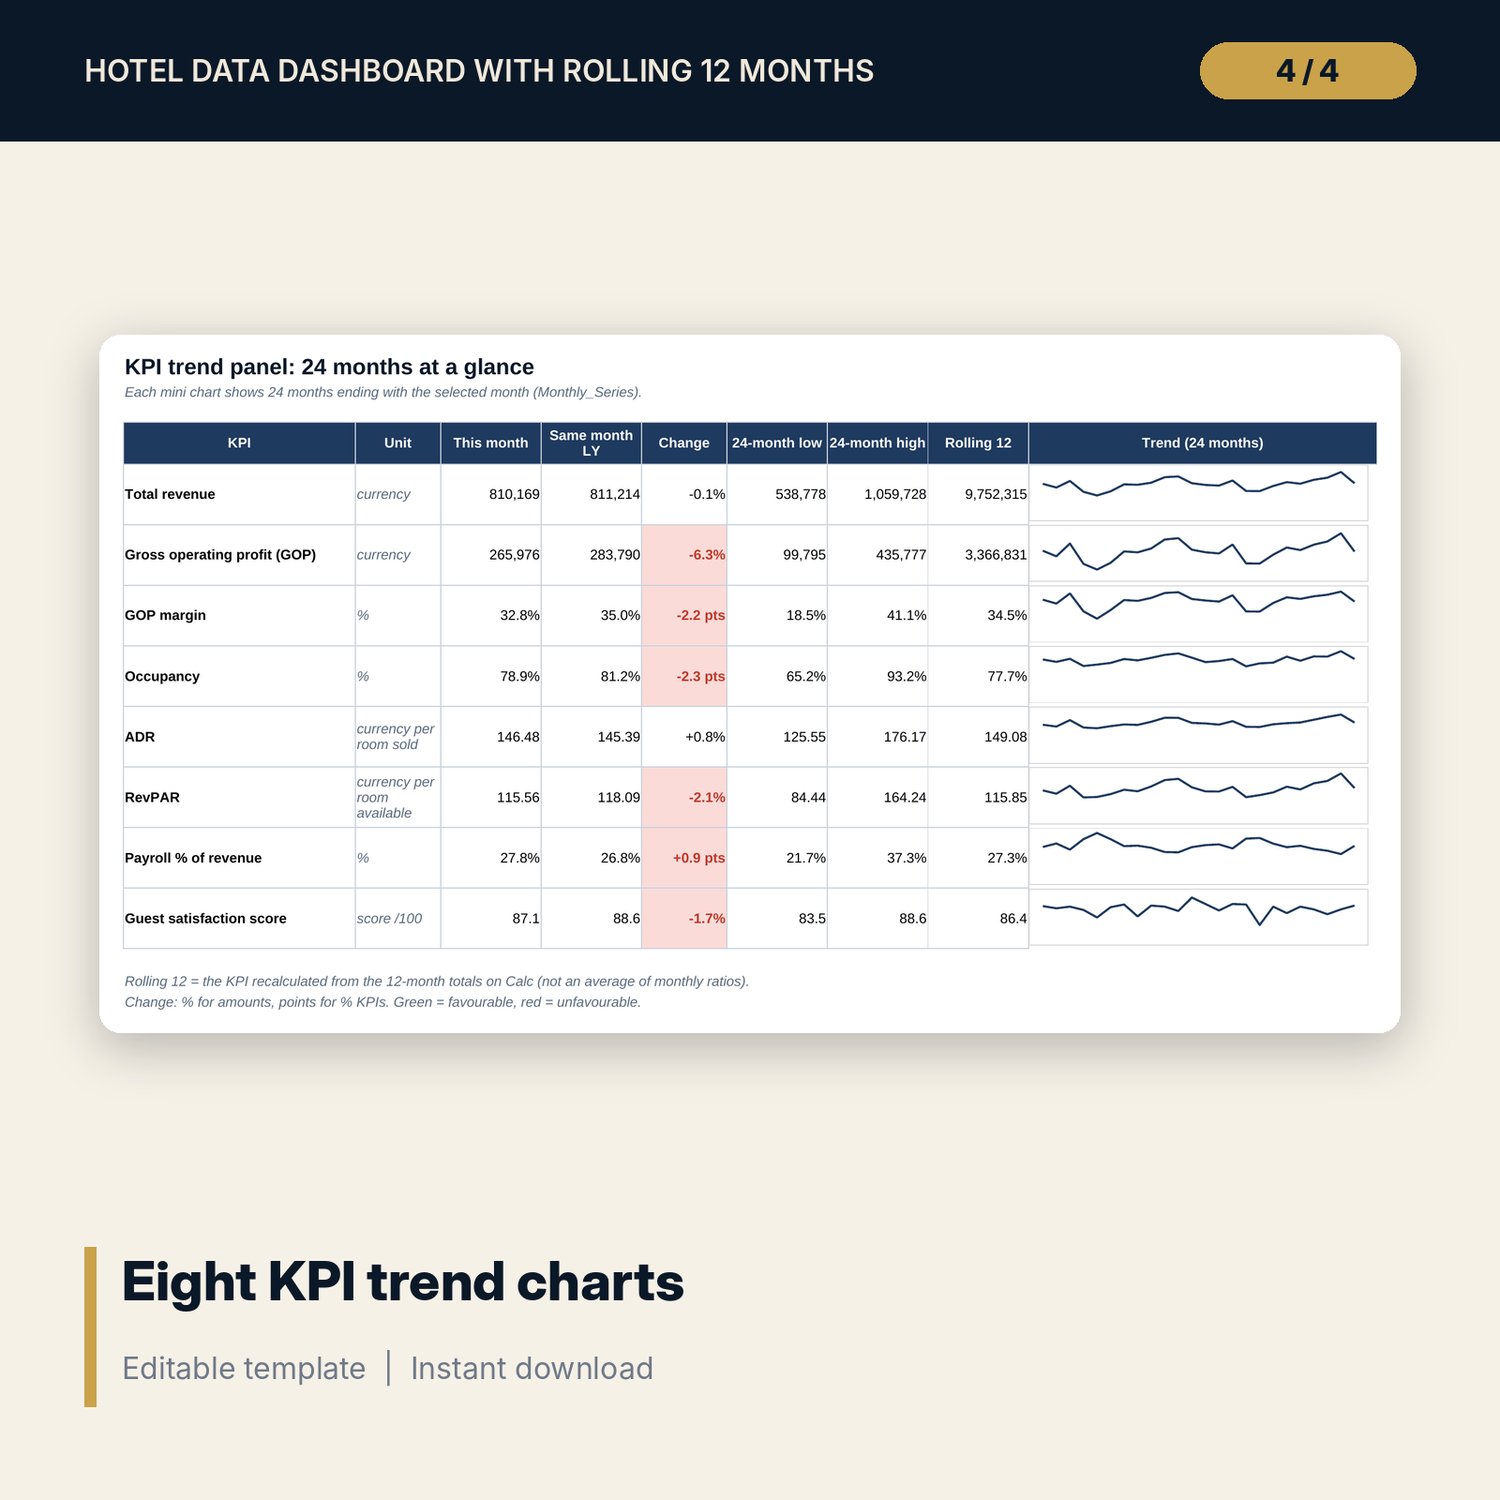
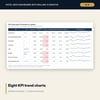
- Trends: 8 KPIs with this month, last year, 24-month low and high, the rolling 12-month value and a mini trend chart each.
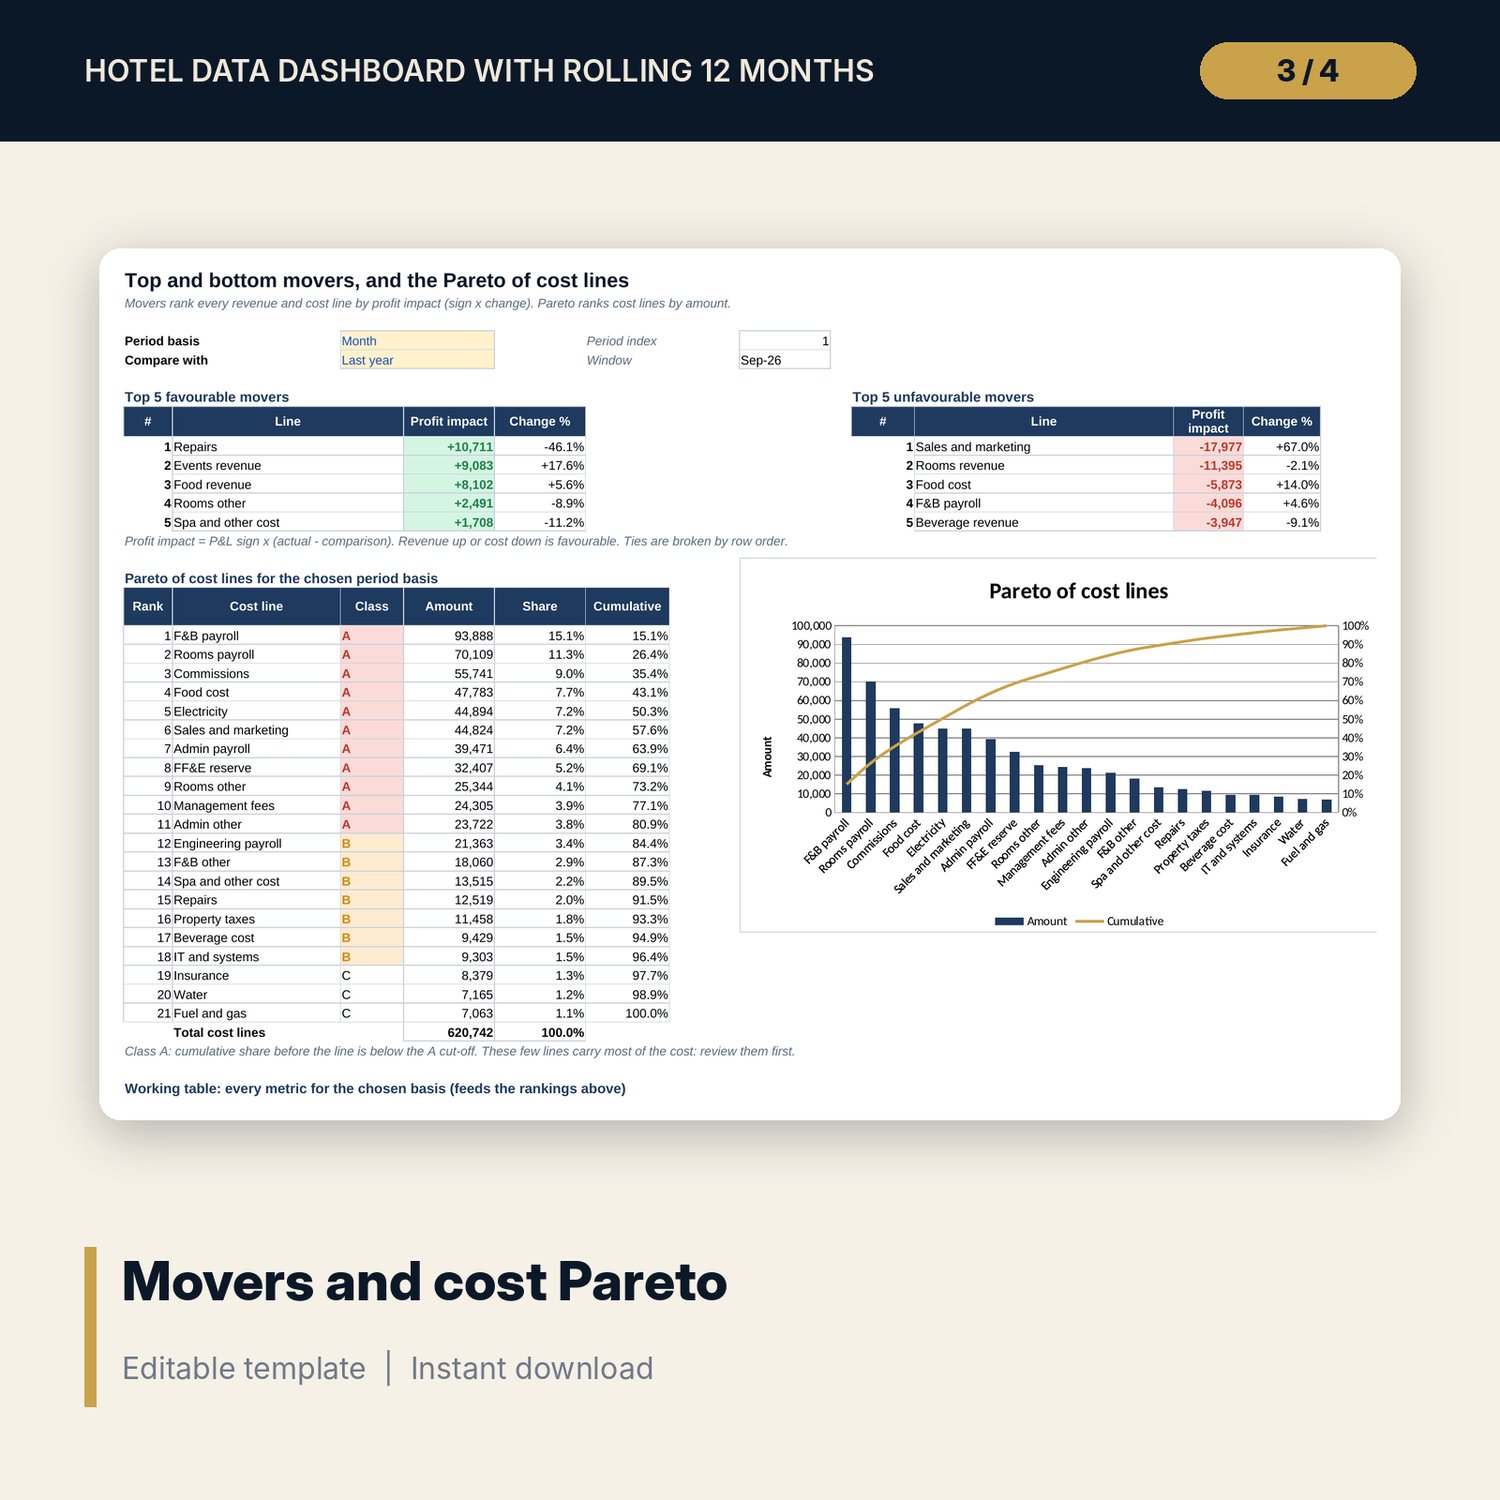
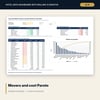
- Movers_Pareto: top 5 favourable and unfavourable lines by profit impact for Month, YTD or Rolling 12 against Last year or Budget, and a Pareto chart of 21 cost lines.
- README.txt and LICENSE-and-Terms.txt.
How it works
- Rename the metrics on Metric_List to match your accounts. The codes stay the same.
- Paste one Actual row and one Budget row per month on Data.
- Pick the month and the first month of your fiscal year on Settings.
- Read the Dashboard, Report, Trends and Movers_Pareto. Choose the movers basis and comparison in two drop-downs.
- Confirm the Checks tab shows ALL OK before you send the pack.
Details
- Format: XLSX workbook.
- Language: English.
- Software: Excel 2016 or later, or LibreOffice Calc. No macros, no pivot tables, no add-ins.
- Works in any currency; the currency label is an input.
- Delivery: instant download.
Good to know
- Sample data is illustrative and describes no real property. Replace it with your own figures.
- A reporting tool, not accounting or financial advice. Group your accounts the way your own chart of accounts and reporting layout require.
- Rolling 12-month comparisons need 24 months of actual data; the Checks tab tells you when the history is short.
- Single-user license.
FAQ
Does it use pivot tables or macros?
No. Every result is a cell formula (SUMIFS, AVERAGEIFS, SUMPRODUCT, INDEX and MATCH, LARGE and SMALL), so you can click any number and trace it back to the Data tab.
Can I change the metrics?
Yes. Rename any of the 40 metrics, change its group (revenue, departmental cost, undistributed cost, fees and fixed charges, volume, operations), its aggregation and its direction. Keep the codes, because the KPIs use them.
My fiscal year does not start in January. Does YTD still work?
Yes. Enter the first month of your fiscal year on Settings and YTD runs from that month to the selected month, with last year shifted by 12 months.
Why is rolling 12-month ADR not the average of the monthly ADRs?
Because months with more rooms sold should weigh more. The workbook divides 12-month rooms revenue by 12-month rooms sold. The same rule applies to every ratio.
How do I know the totals are right?
Totals are calculated twice: per metric with SUMIFS on Calc and by group with SUMPRODUCT on Monthly_Series. The Checks tab compares them, plus 14 other tests on dates, duplicates, ranges, movers and the Pareto.