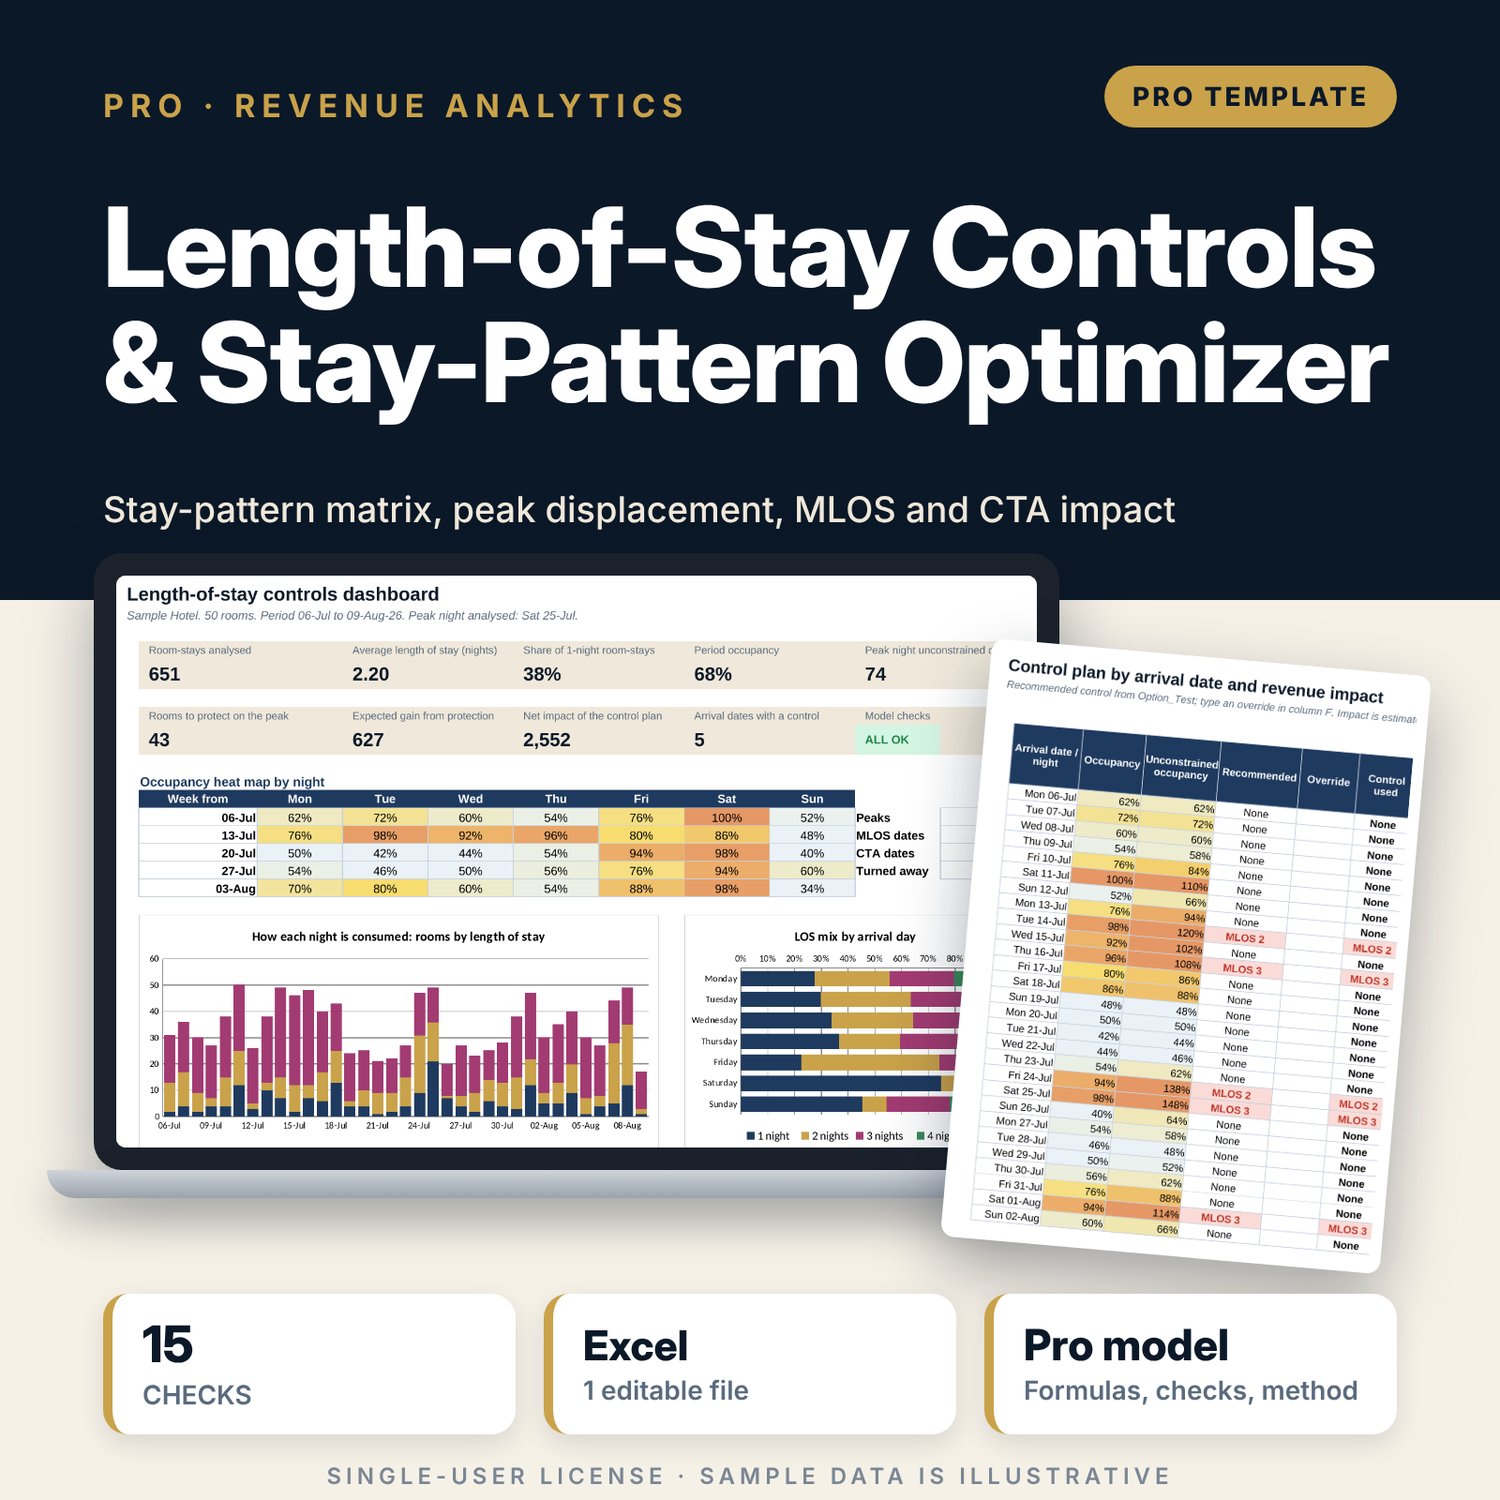

Length-of-Stay Controls & Stay-Pattern Optimizer: Minimum Stay and Closed-to-Arrival Calculator for Hotels
Full description
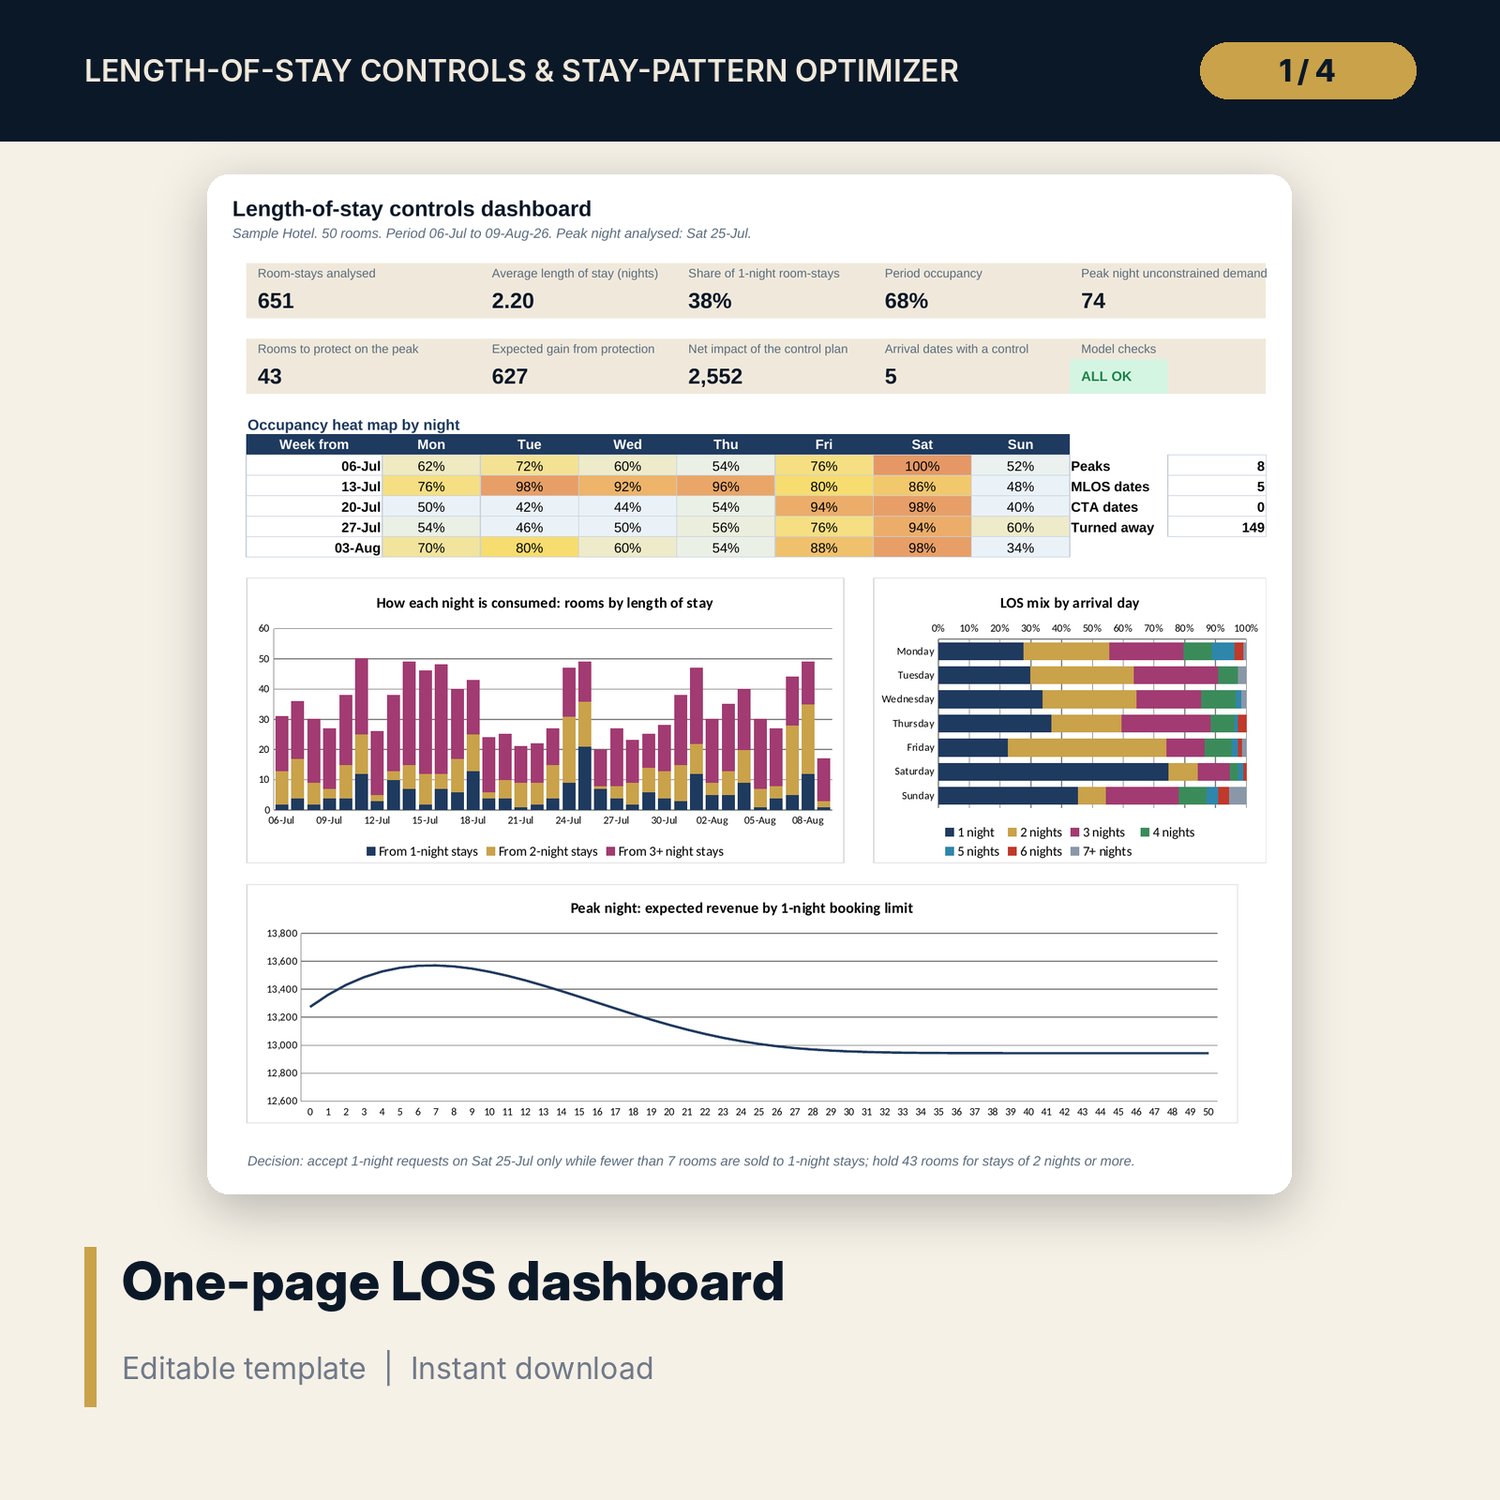
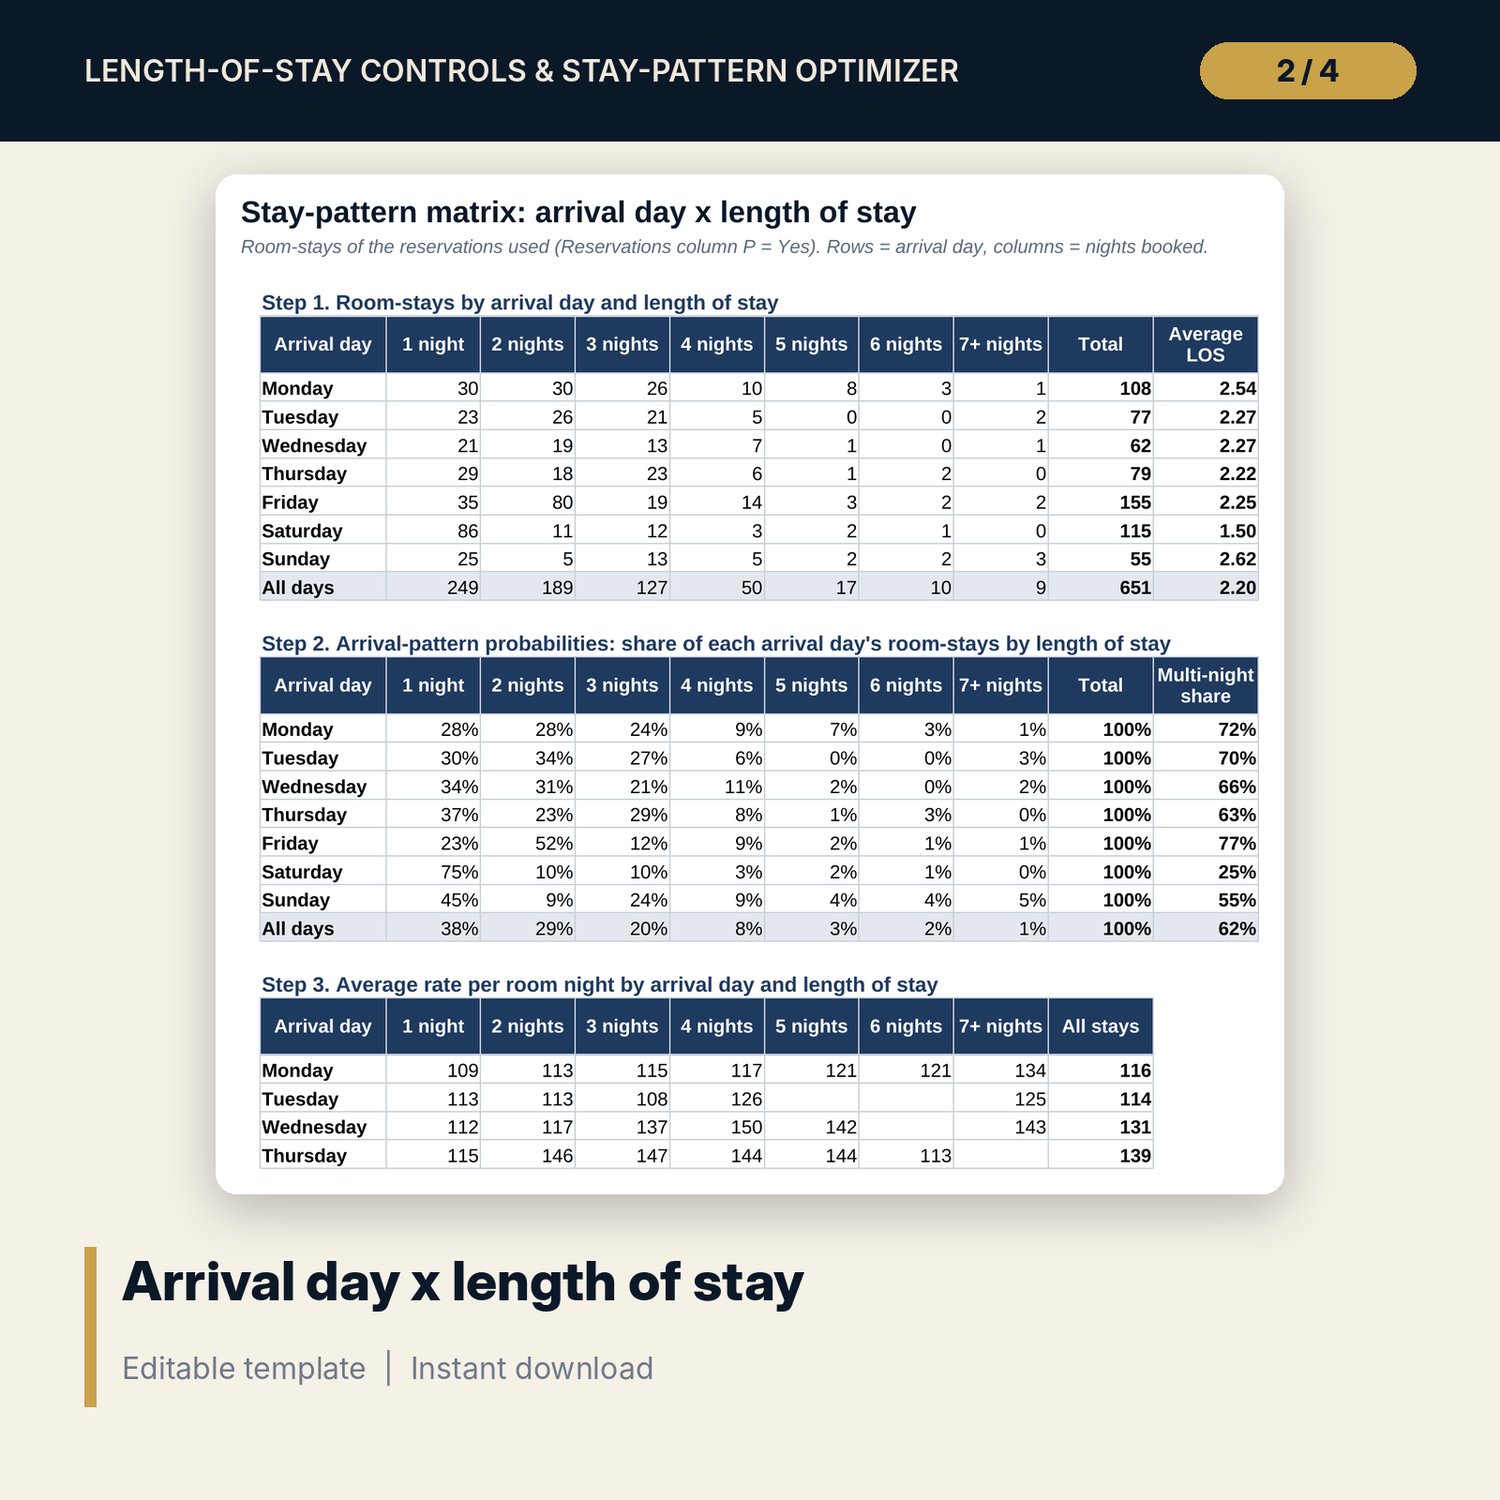
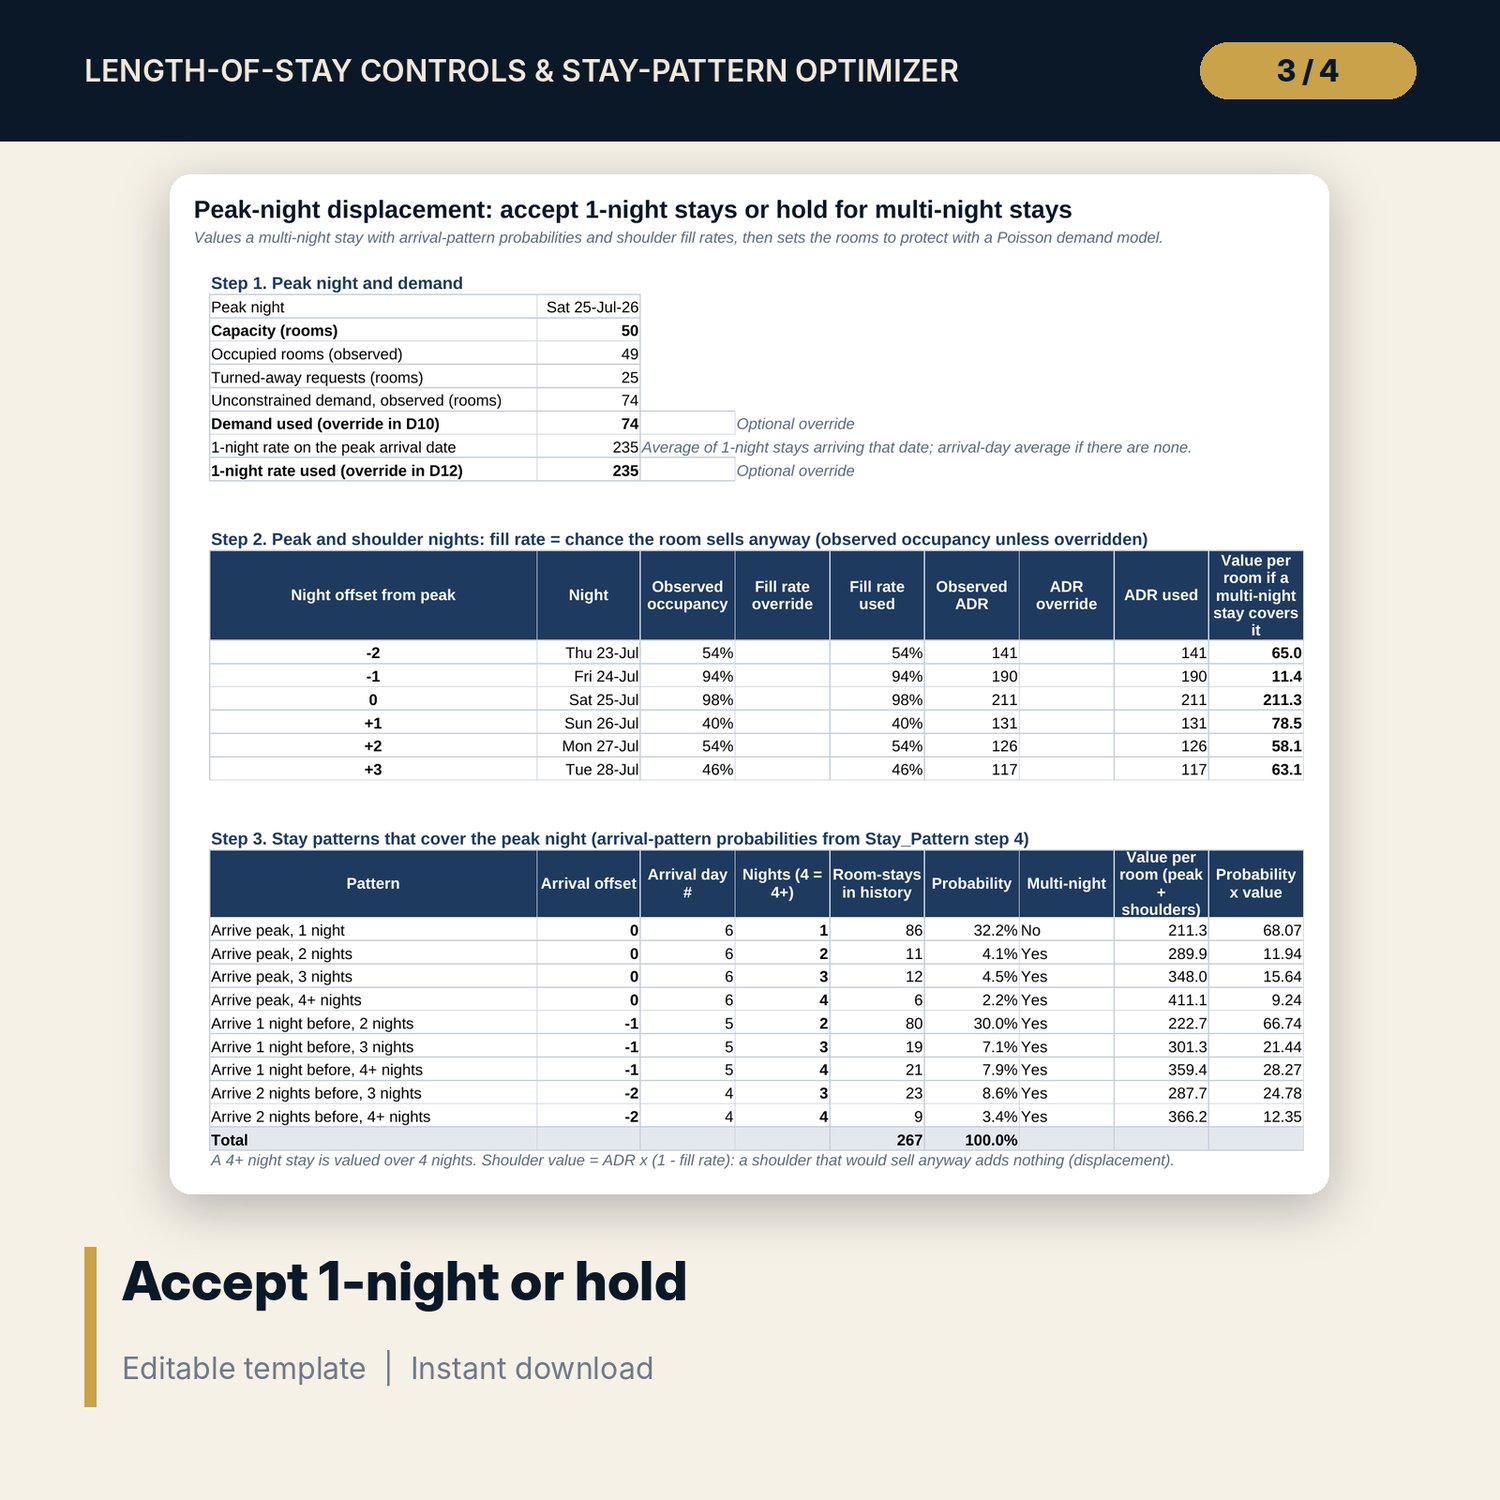
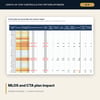
For revenue managers and general managers who set minimum stays and closed-to-arrival restrictions on peak nights and want evidence before they load them. The workbook turns a list of bookings into a stay-pattern matrix (room-stays by arrival day and length of stay) with arrival-pattern probabilities and rates per cell, then counts how every night of a 5-week period is consumed: arrivals, stay-overs and rooms from 1-night, 2-night and longer stays, with occupancy and unconstrained-demand heat maps. For a chosen peak night it values a multi-night stay as the peak rate plus the shoulder nights that would otherwise stay empty (displacement through shoulder fill rates), models 1-night and multi-night demand as Poisson and sets how many rooms to hold for multi-night stays, with the expected revenue of accepting every 1-night stay against the protected policy. An option test tries MLOS 2, MLOS 3 and CTA alone on every arrival date and recommends the best one on peak dates. A control simulator then applies the whole plan to the actual bookings: refusals, guests who extend or arrive earlier, rooms freed for turned-away demand and the net revenue impact, with a sensitivity grid.
Save with a bundle: this workbook is also in the Hotel Revenue & Data Analytics Pro Bundle, 25 workbooks for $59 instead of $319. All 100 Pro workbooks are in the Pro Library for $119, and all 241 templates and workbooks are in the Ultimate Hospitality Library for $149.
What is inside
- LOS_Controls_Stay_Pattern_Optimizer.xlsx: 12 tabs, 22,643 formulas, 5 native charts, 10 drop-down and input rules
- Reservations: 600 sample bookings with data checks and room for 650
- Stay_Pattern: 7 arrival days x 7 length-of-stay buckets as room-stays, probabilities and rates, plus a LOS mix chart
- Night_Use: 35 nights split by arrivals, stay-overs and length of stay, unconstrained demand, recommended control and two heat maps
- Displacement: shoulder fill rates, 9 stay patterns, a Poisson protection table up to 150 rooms and expected revenue by booking limit
- Option_Test: MLOS 2, MLOS 3 and CTA tested alone on each of the 35 arrival dates (105 option rows), with the best option and the recommended control
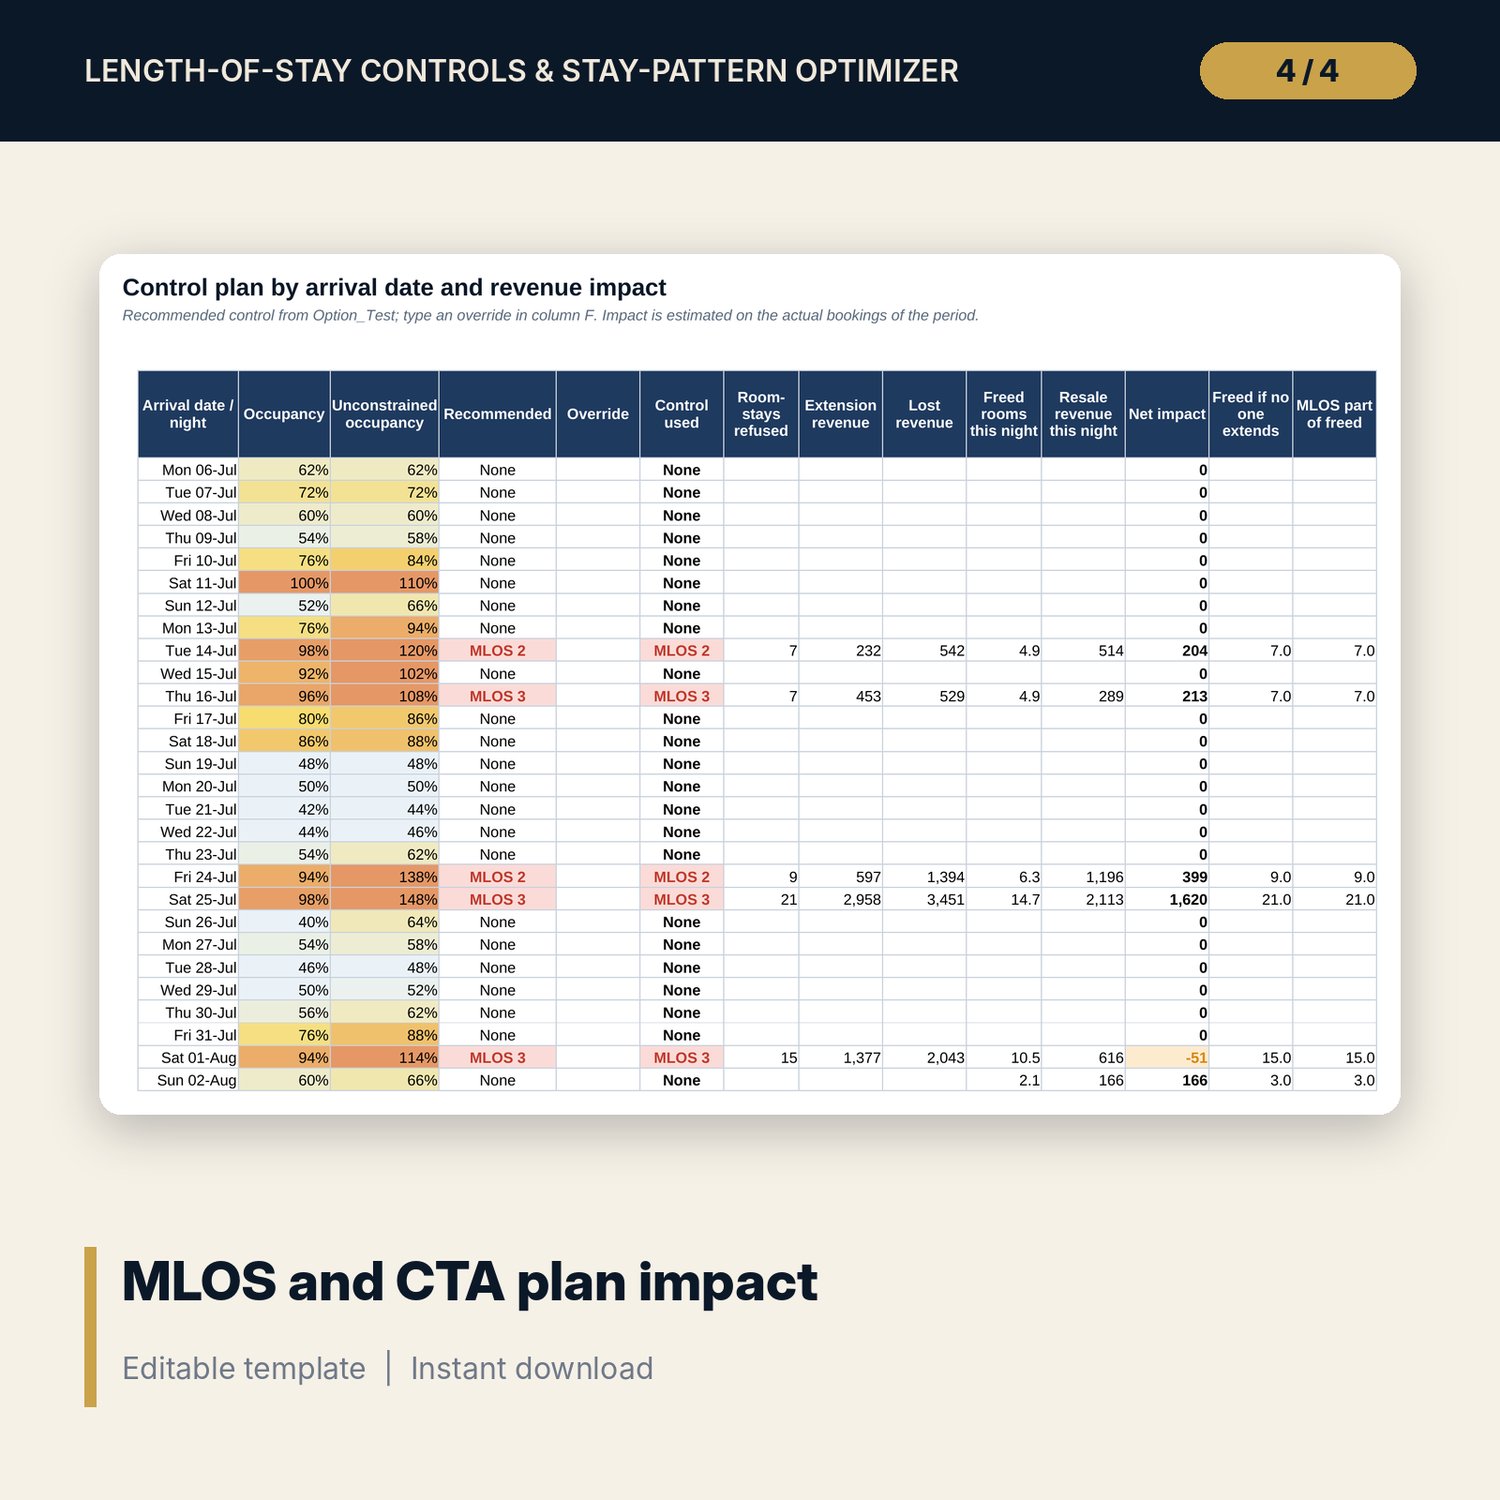
- Controls and Sim_Engine: the control plan by arrival date applied to every booking, net impact and a 5 x 5 grid
- Dashboard (one printed page), 15 integrity checks and a Method tab with 18 documented calculations
- README.txt and LICENSE-and-Terms.txt
How it works
- Enter rooms, the 5-week period and the peak night on Assumptions.
- Paste your bookings (arrival, nights, rooms, rate, segment) and the requests turned away per night.
- Read the stay-pattern matrix and the night heat map to see which nights carry the stays.
- Read the peak-night displacement result: rooms to hold for multi-night stays and the expected gain.
- Accept or override the recommended controls and check the net impact before you load them.
Details
- Format: one .xlsx workbook, English
- Software: Excel 2016 or later, or LibreOffice Calc 7 or later
- No macros, no data tables, no array formulas, no external links
- Instant digital download
Good to know
- Sample data is illustrative. Replace it with your own figures.
- Revenue impact is an estimate built on the bookings of the period and your extension and recapture rates. Read the grid before you act.
- Not financial advice. Verify local requirements and channel rules before you load restrictions.
- Single-user license. Do not redistribute.
FAQ
Which data do I need?
A booking list with arrival date, nights, rooms and rate per room night, plus the number of requests turned away per night if you keep a regrets and denials log.
How does it choose between a minimum stay and closed to arrival?
It tests MLOS 2, MLOS 3 and CTA one at a time on the bookings that arrive on each peak date and recommends the option with the highest net gain, when that gain reaches the minimum you set.
What does the displacement tab add?
It answers how many rooms to hold for multi-night stays on the peak night, based on how your guests book and how full the shoulder nights get, and what that is worth against accepting every 1-night request.
Can I test my own plan?
Yes. Type MLOS 2, MLOS 3, CTA or None in the override column for any arrival date and read the net impact.
Does it need macros or add-ins?
No. Every result, including the Poisson table and the grid, is a standard worksheet formula.