
Booking Lead Time & Window Analytics: lead time percentiles, booking curve and advance-purchase fence
Full description
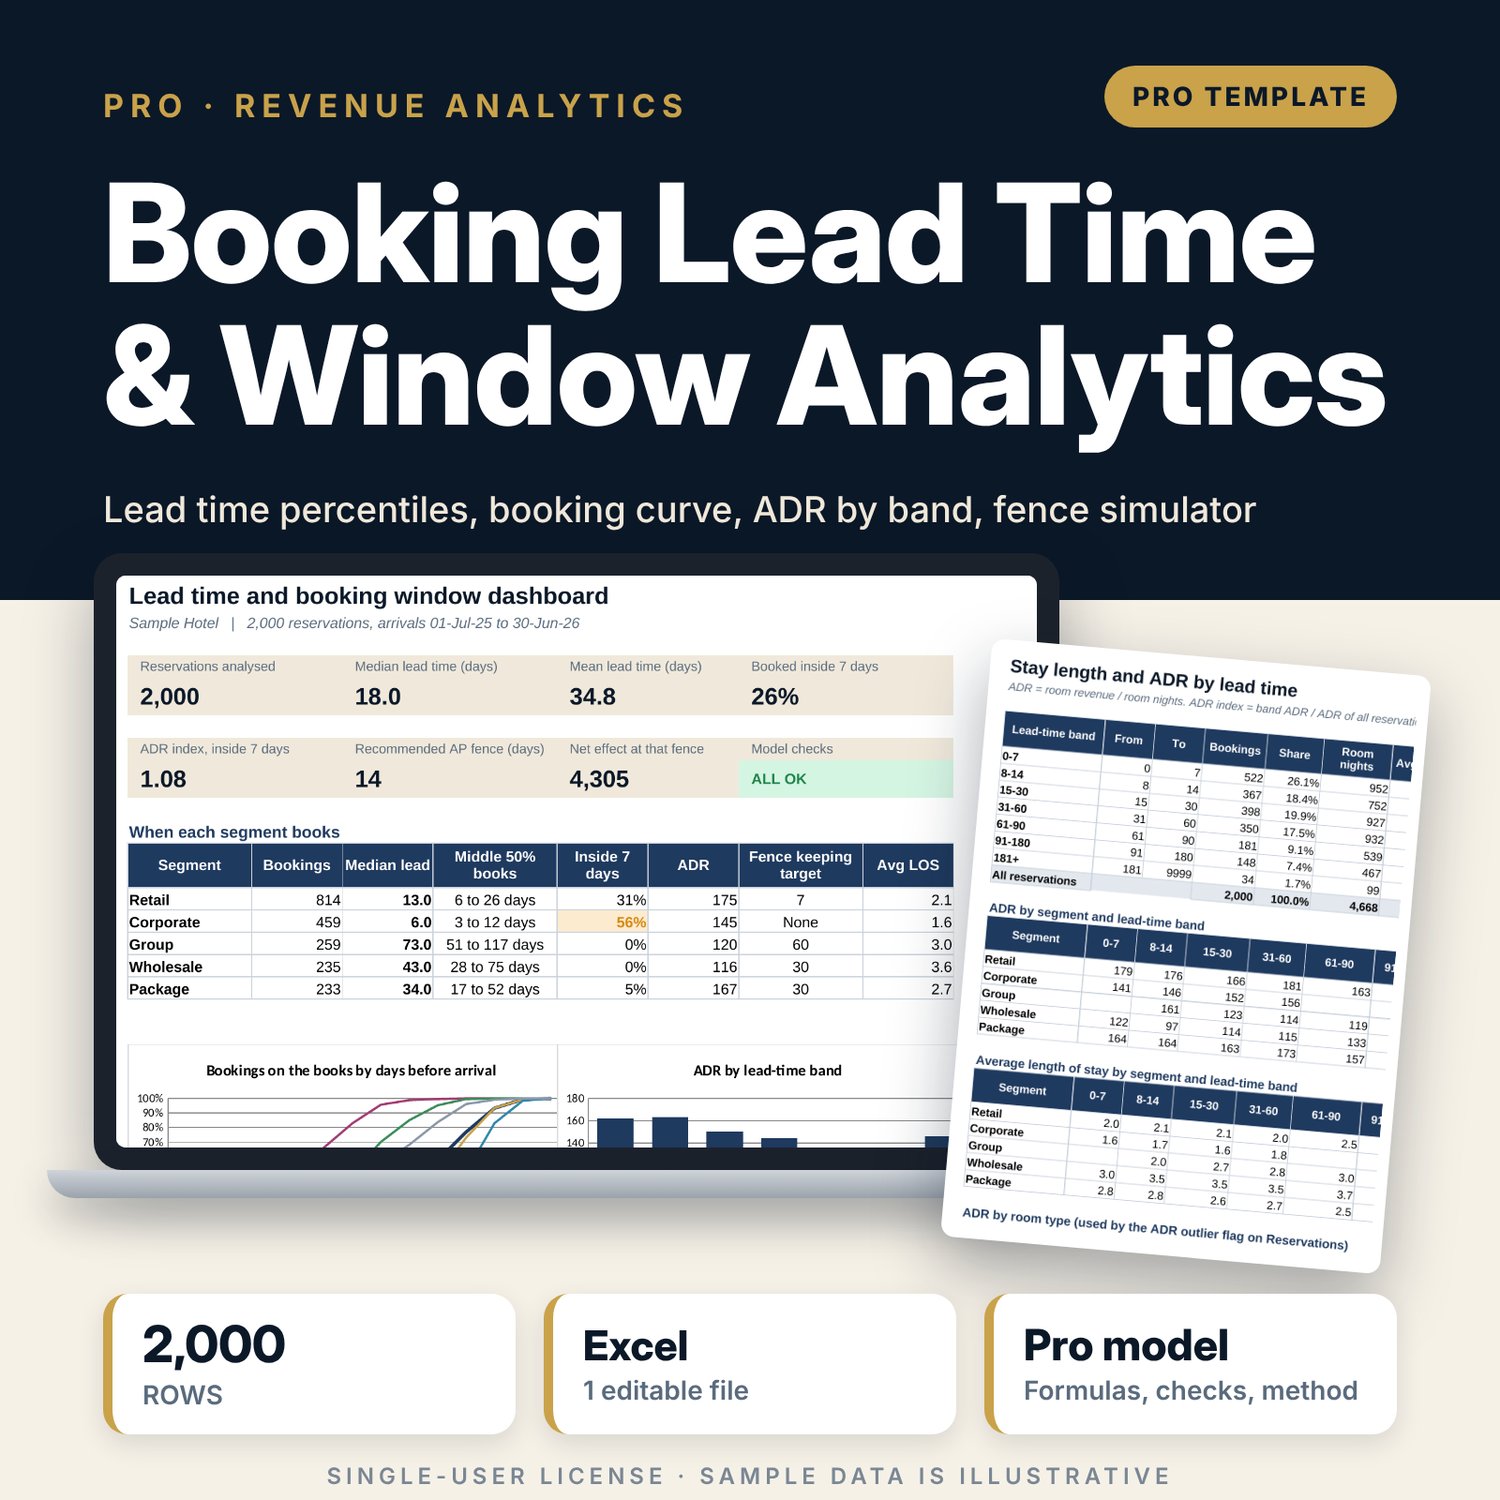
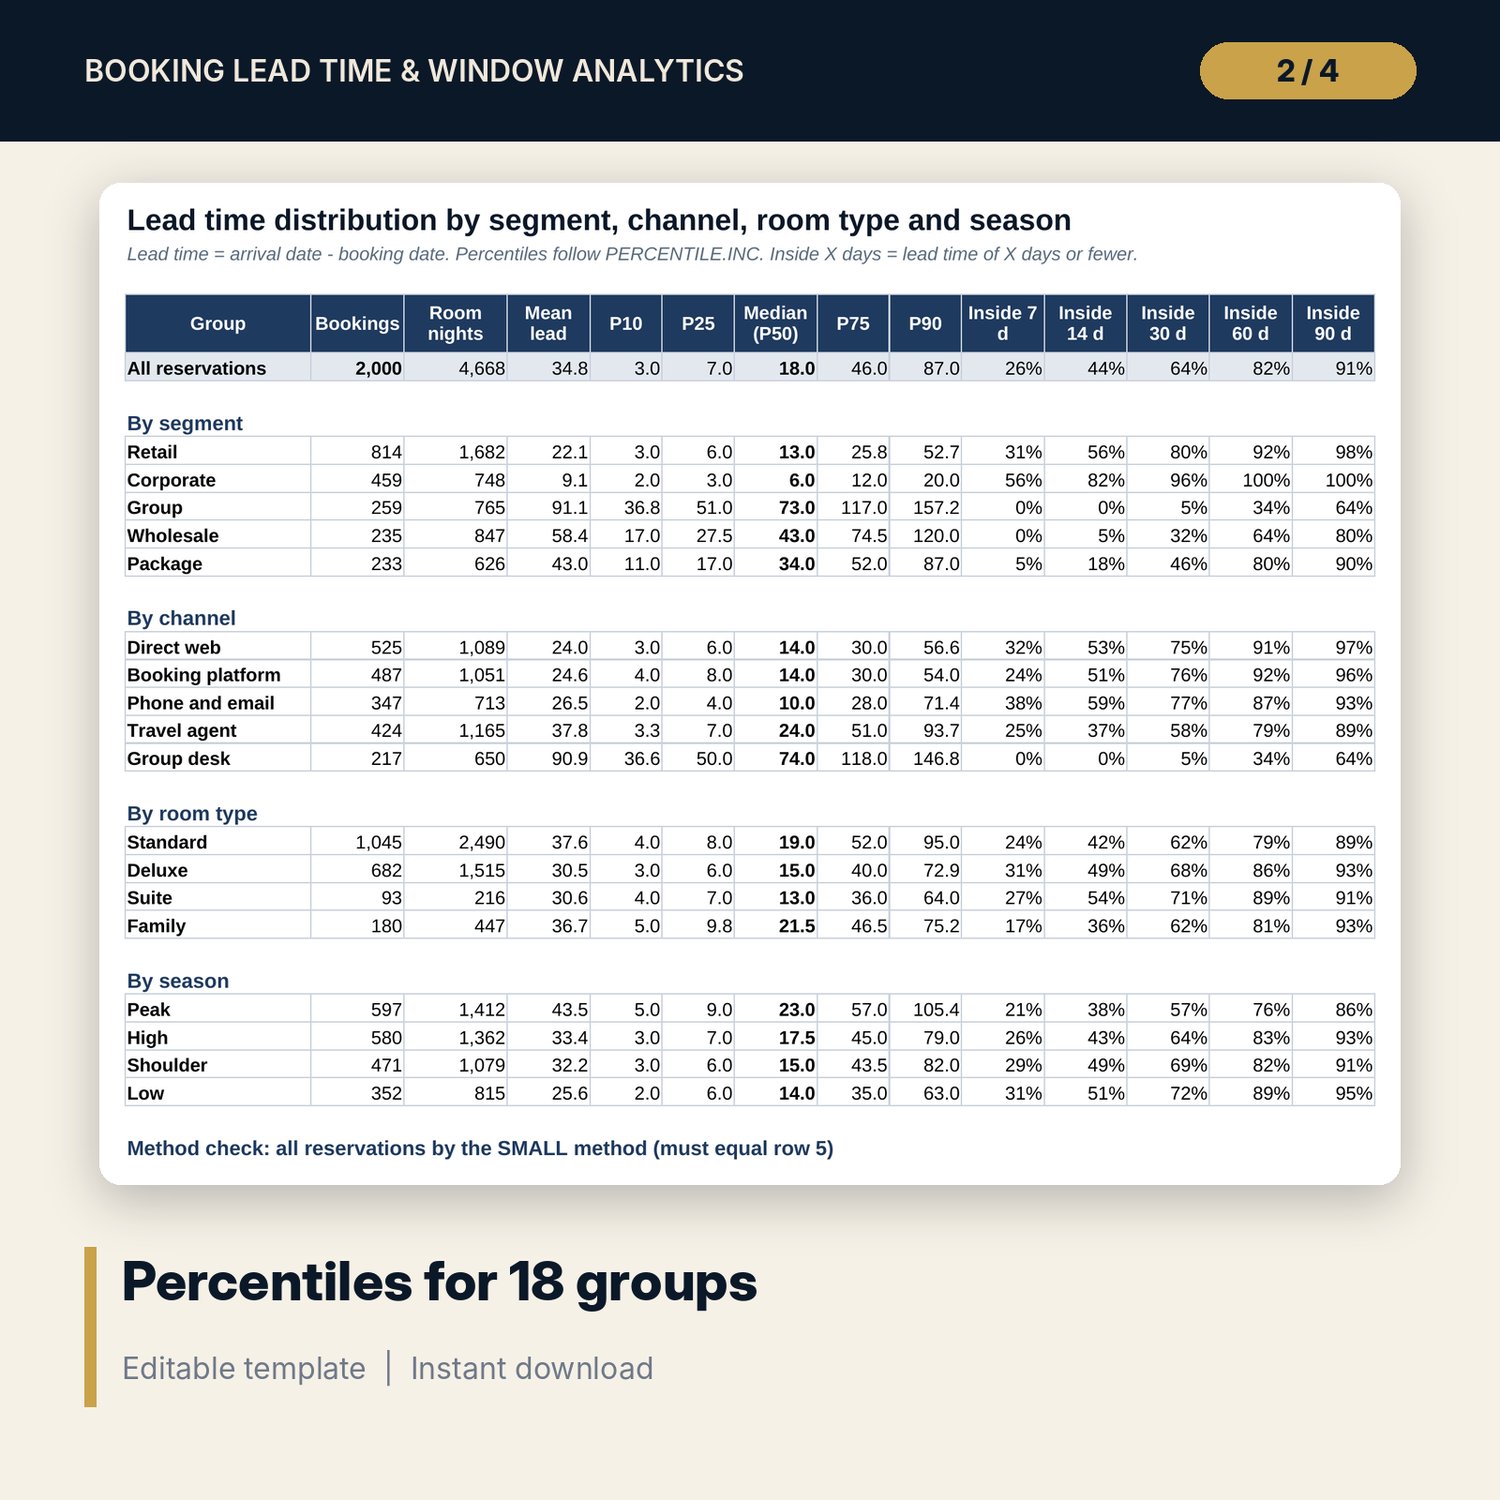
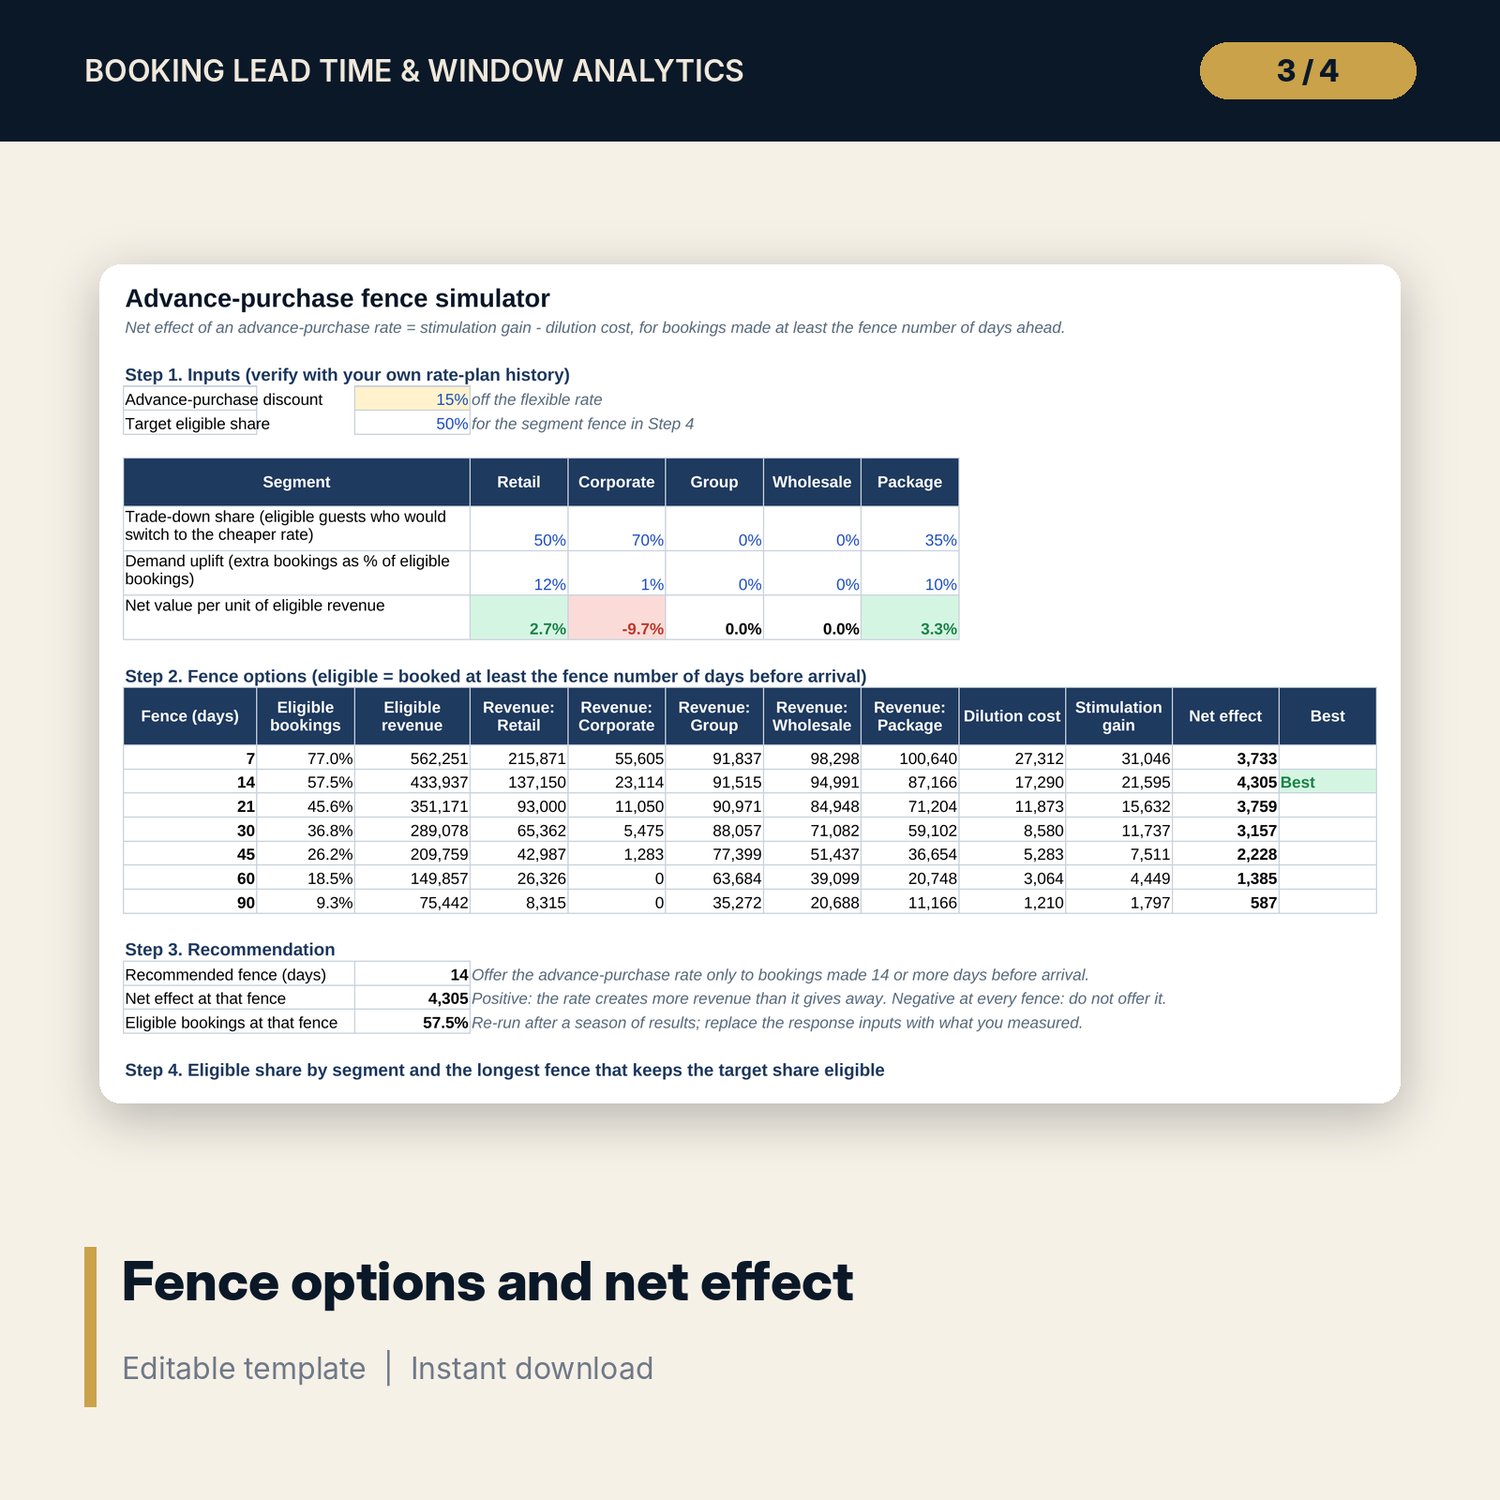
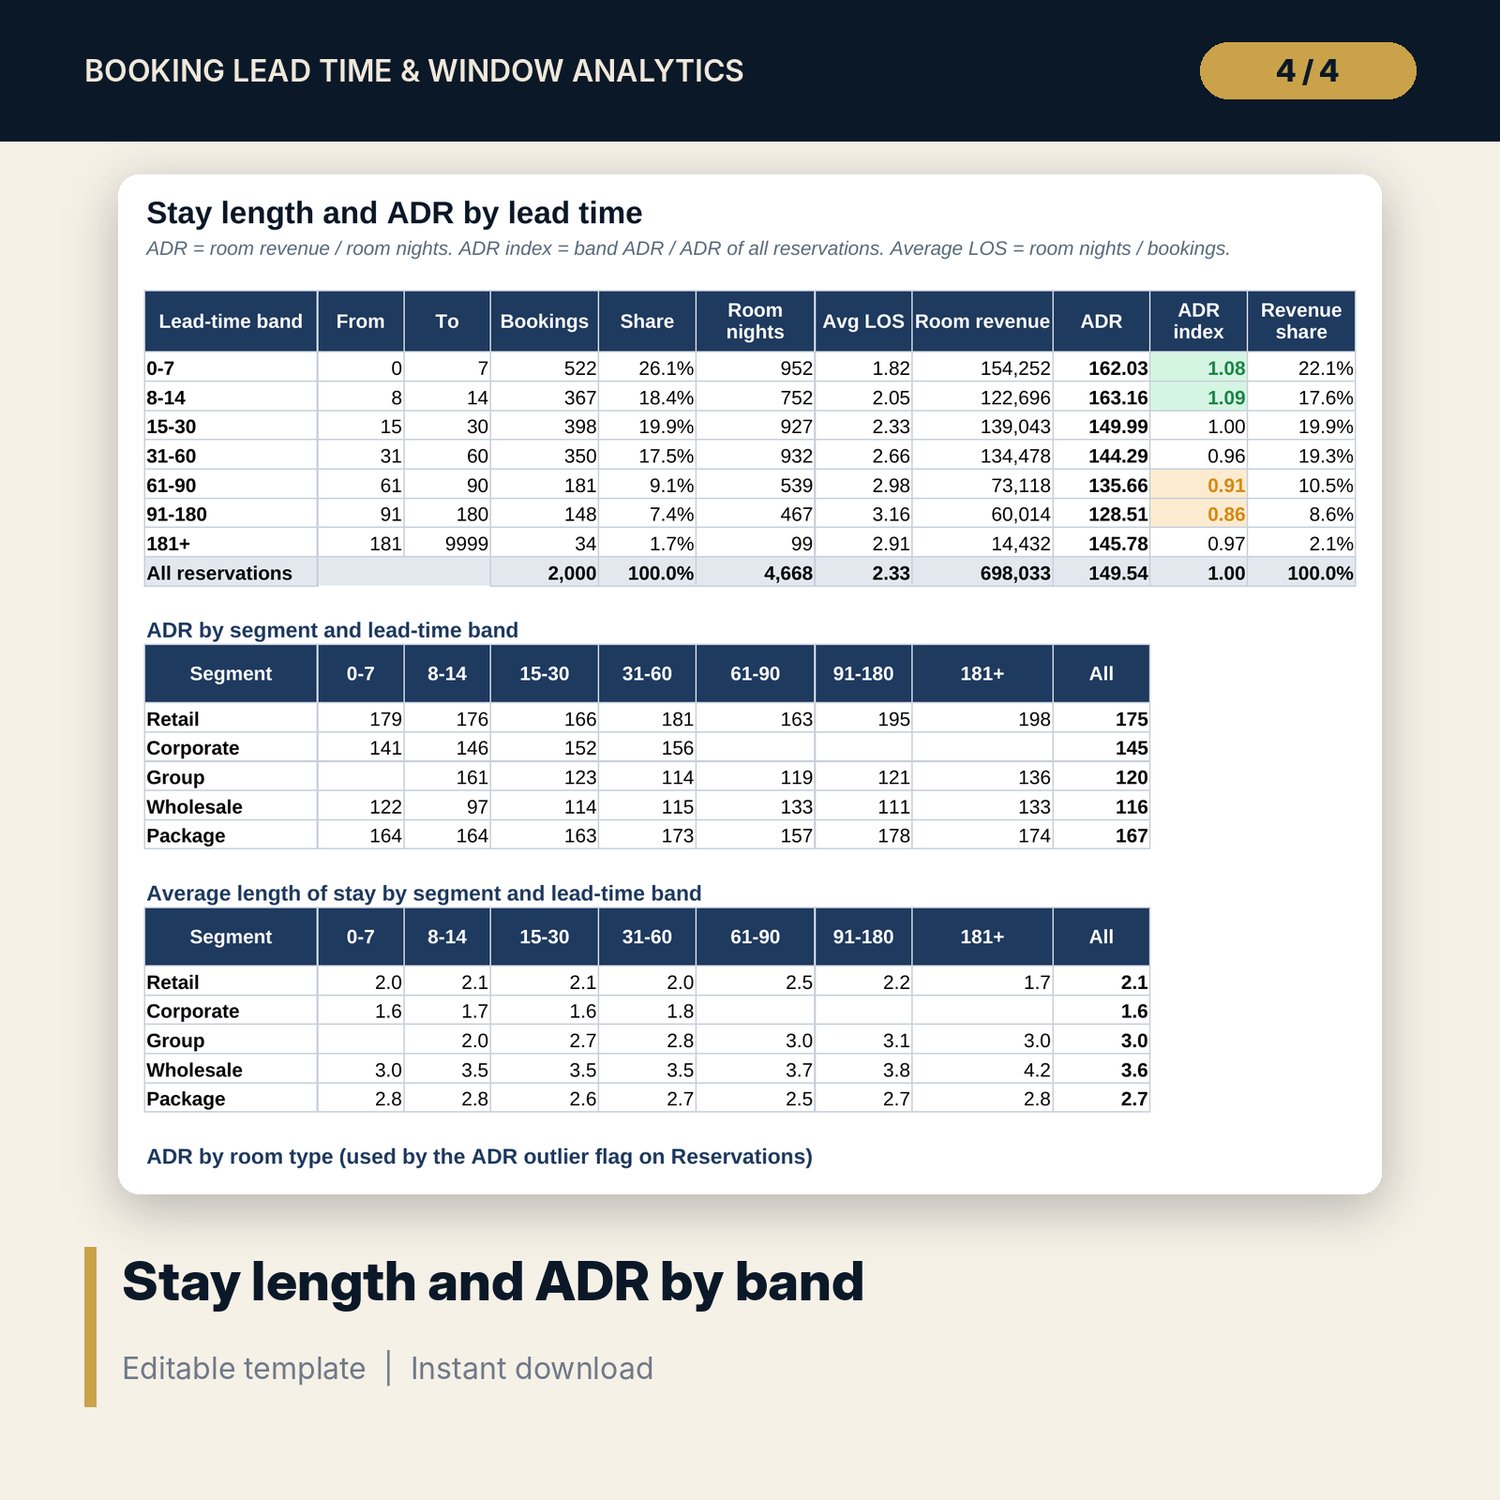
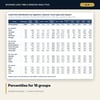
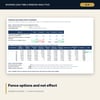
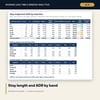
For revenue managers, directors of sales and marketing, general managers and commercial analysts who set rate fences, booking windows and promotion timing. You paste one row per reservation: booking date, arrival date, nights, segment, channel, room type and room revenue. The workbook calculates lead time, assigns the season from the arrival month and reports, for every segment, channel, room type and season, the bookings, room nights, mean lead time, P10, P25, median, P75 and P90 (PERCENTILE.INC results without array formulas) and the share booked inside 7, 14, 30, 60 and 90 days. A booking curve shows the share of final bookings on the books at each number of days before arrival. A band table shows length of stay and ADR by lead time. The fence simulator values each advance-purchase fence as stimulation gain minus dilution cost, using discount and response inputs you set, and recommends the fence with the highest net effect.
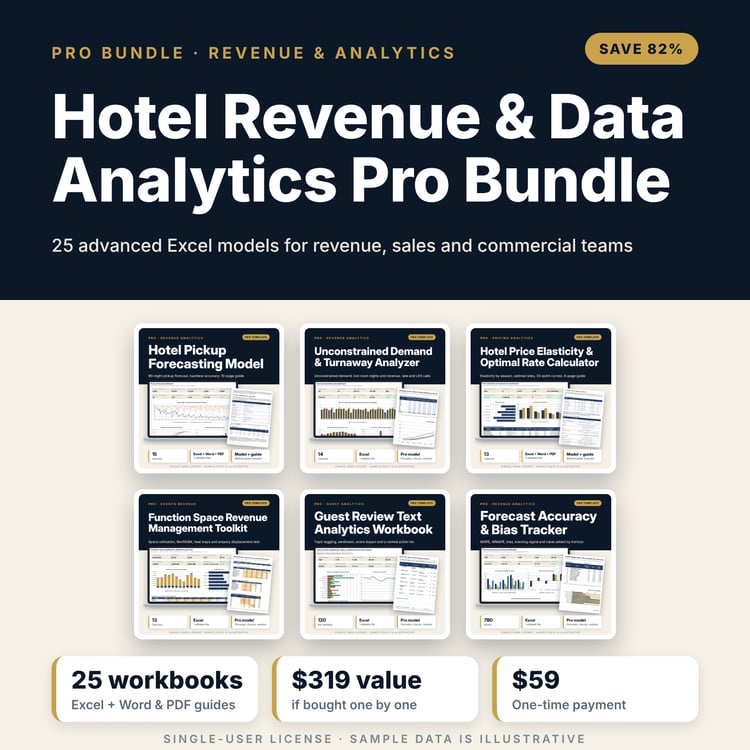
Save with a bundle: this workbook is also in the Hotel Revenue & Data Analytics Pro Bundle, 25 workbooks for $59 instead of $319. All 100 Pro workbooks are in the Pro Library for $119, and all 241 templates and workbooks are in the Ultimate Hospitality Library for $149.
What is inside
- Booking_Lead_Time_Analytics.xlsx: 10 tabs, 18,383 formulas, 5 native charts, 13 integrity checks, a Method tab with 18 calculation notes.
- Reservations: 2,000 sample reservations (illustrative) with 500 spare rows, lead time, season, 4 group keys and data flags.
- Lead_Stats: 18 groups plus the total, each with 5 percentiles, the mean and 5 booking-window shares; a method check row against PERCENTILE.
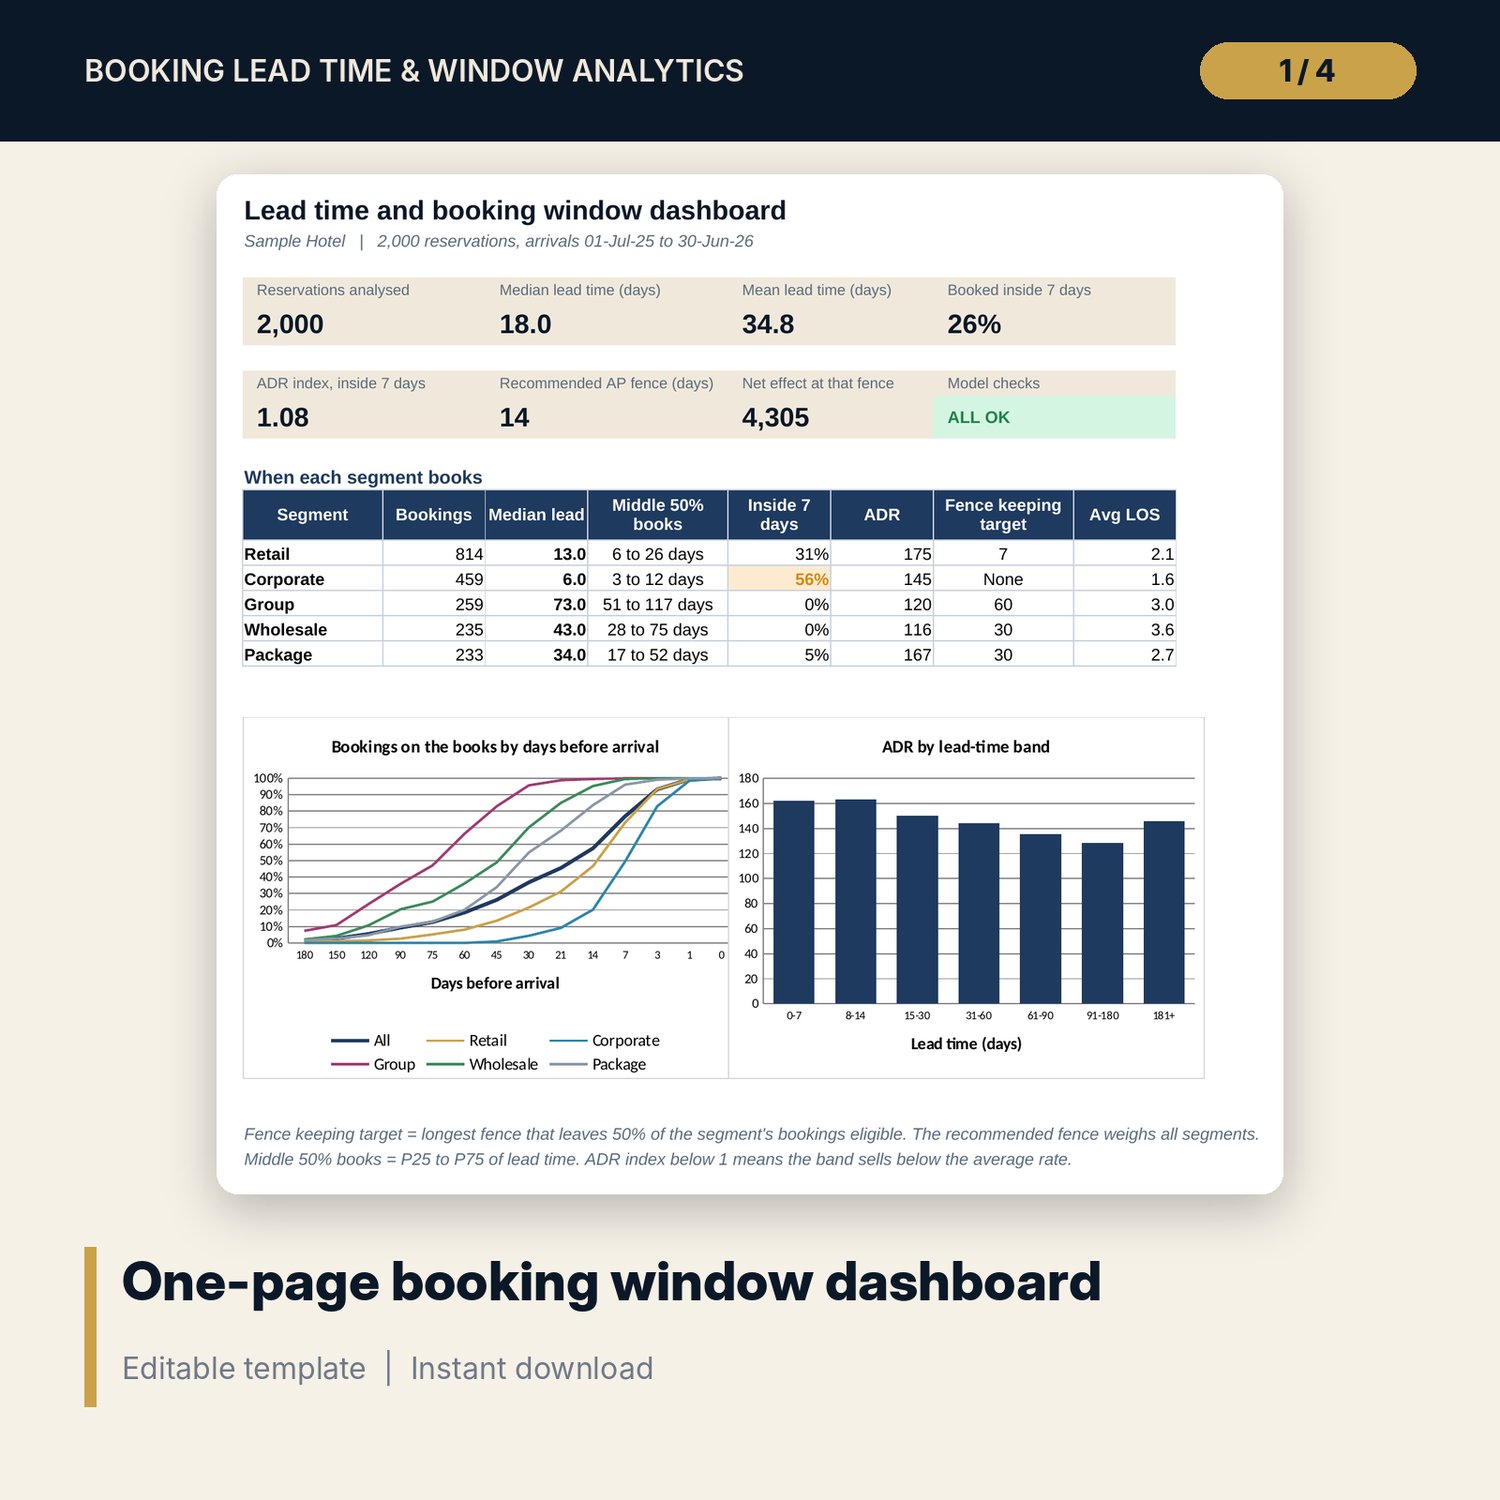
- Booking_Curve: 14 points from 180 days to arrival for all bookings, 5 segments and 4 seasons.
- LOS_ADR: 7 lead-time bands with bookings, room nights, average stay, ADR, ADR index and revenue share; ADR and stay length by segment and band.
- Fence_Simulator: 7 candidate fences with eligible demand, dilution cost, stimulation gain, net effect, the recommended fence and a fence per segment.
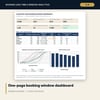
- Dashboard: 7 tiles, a check tile, when each segment books, the booking curve and ADR by lead-time band on one page.
- README.txt and LICENSE-and-Terms.txt.
How it works
- Set the lists, the season of each arrival month, the lead-time bands and the fences to test on Settings.
- Paste your reservations. Lead time, season and the group keys calculate on each row.
- Read when each group books on Lead_Stats and Booking_Curve, and how stay length and ADR move with lead time on LOS_ADR.
- Set the discount, trade-down and demand response on Fence_Simulator and read the recommended fence.
- Use the Dashboard for the summary and confirm the Checks tab shows ALL OK.
Details
- Format: XLSX workbook.
- Language: English.
- Software: Excel 2016 or later, or LibreOffice Calc. No macros, no add-ins, no array formulas.
- Up to 2,500 reservations; add rows by copying the last formula row down.
- Delivery: instant download.
Good to know
- Sample data is illustrative and does not describe any hotel or market. Replace it with your own figures.
- Not financial advice. The fence simulator depends on your trade-down and demand inputs; test them against your own results.
- The season map is an example; set the season of each month for your market.
- Single-user license.
FAQ
Which reservations should I paste?
Stayed reservations show when real demand books. All bookings, including cancelled ones, show when demand first arrives. Pick one and keep it consistent.
How are percentiles calculated by segment without array formulas?
Each reservation gets a key of group number x 1000 + lead time. SMALL on that key returns the k-th lead time of a group, and the workbook interpolates exactly as PERCENTILE.INC does. A check compares the method with PERCENTILE on all reservations.
Can I change the bands, windows and percentiles?
Yes. Bands, booking windows, percentiles and candidate fences are inputs on Settings, and every table follows them.
How is the recommended fence chosen?
For each fence, eligible revenue by segment is multiplied by your demand uplift and discount (gain) and by your trade-down share and discount (dilution). The fence with the highest gain minus dilution is recommended.
Can I add more segments or channels?
The lists hold 5 segments, 5 channels, 4 room types and 4 seasons. Rename them freely; adding a sixth needs one more row on Lead_Stats and the other summary tables.