Hotel Owner Monthly Report Builder with Departmental Schedules: monthly owner report and departmental P&L template for hotels
Full description
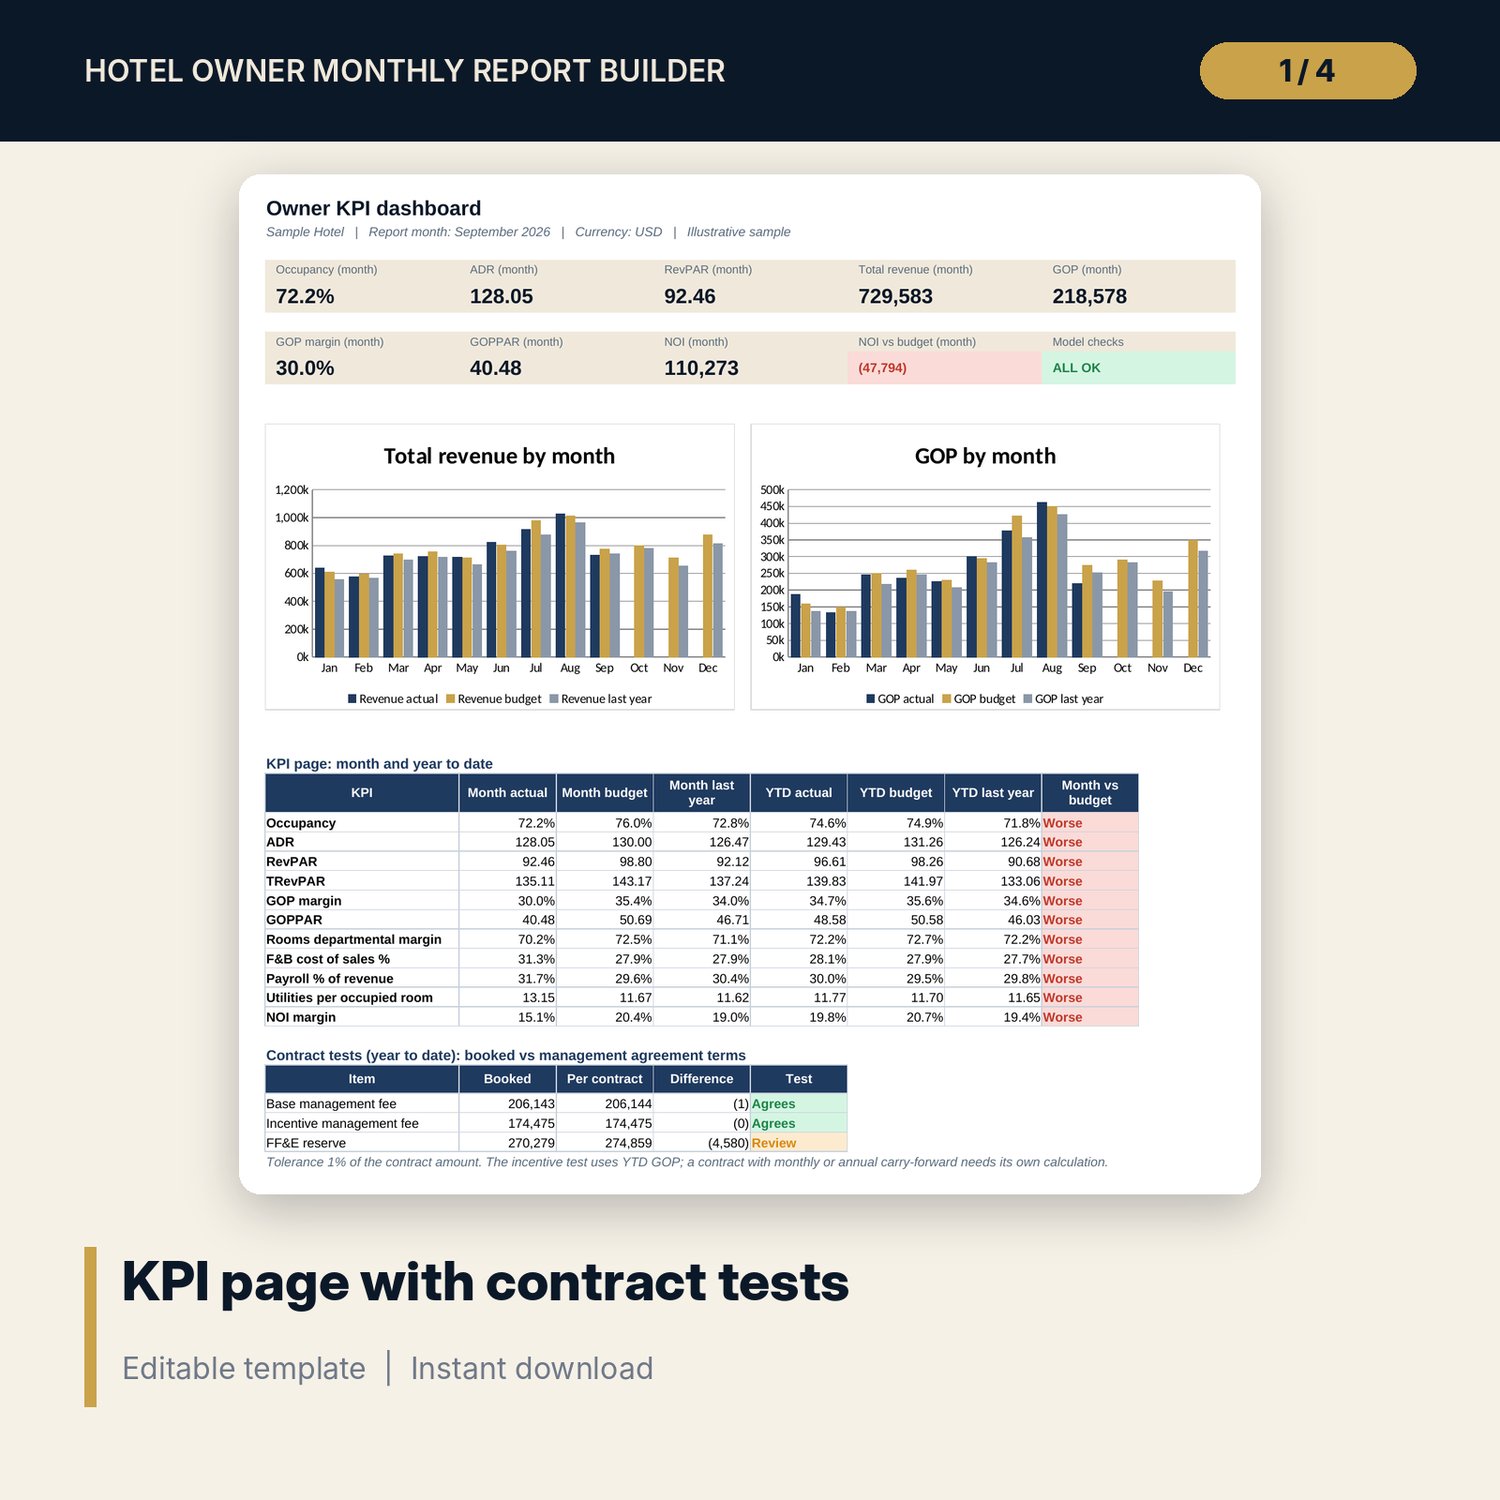
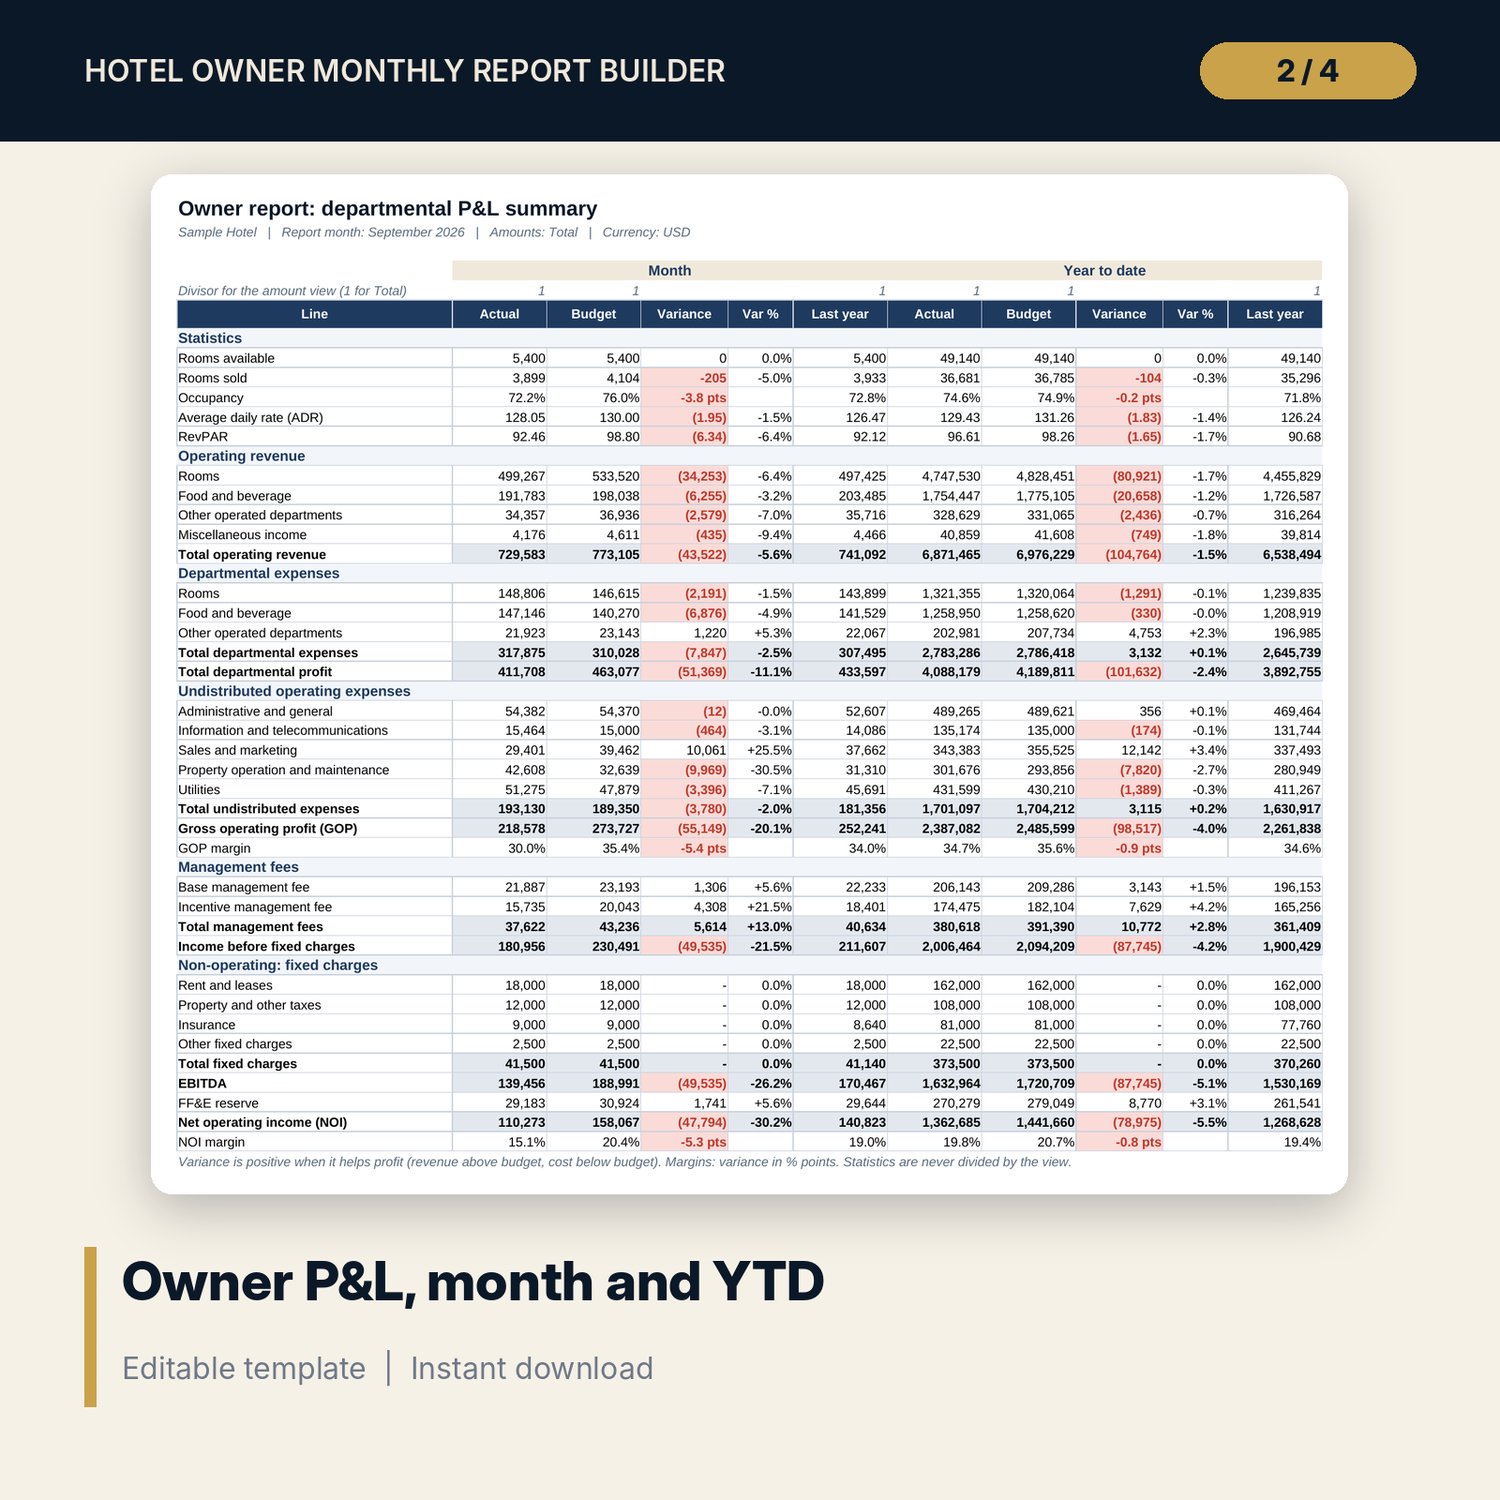
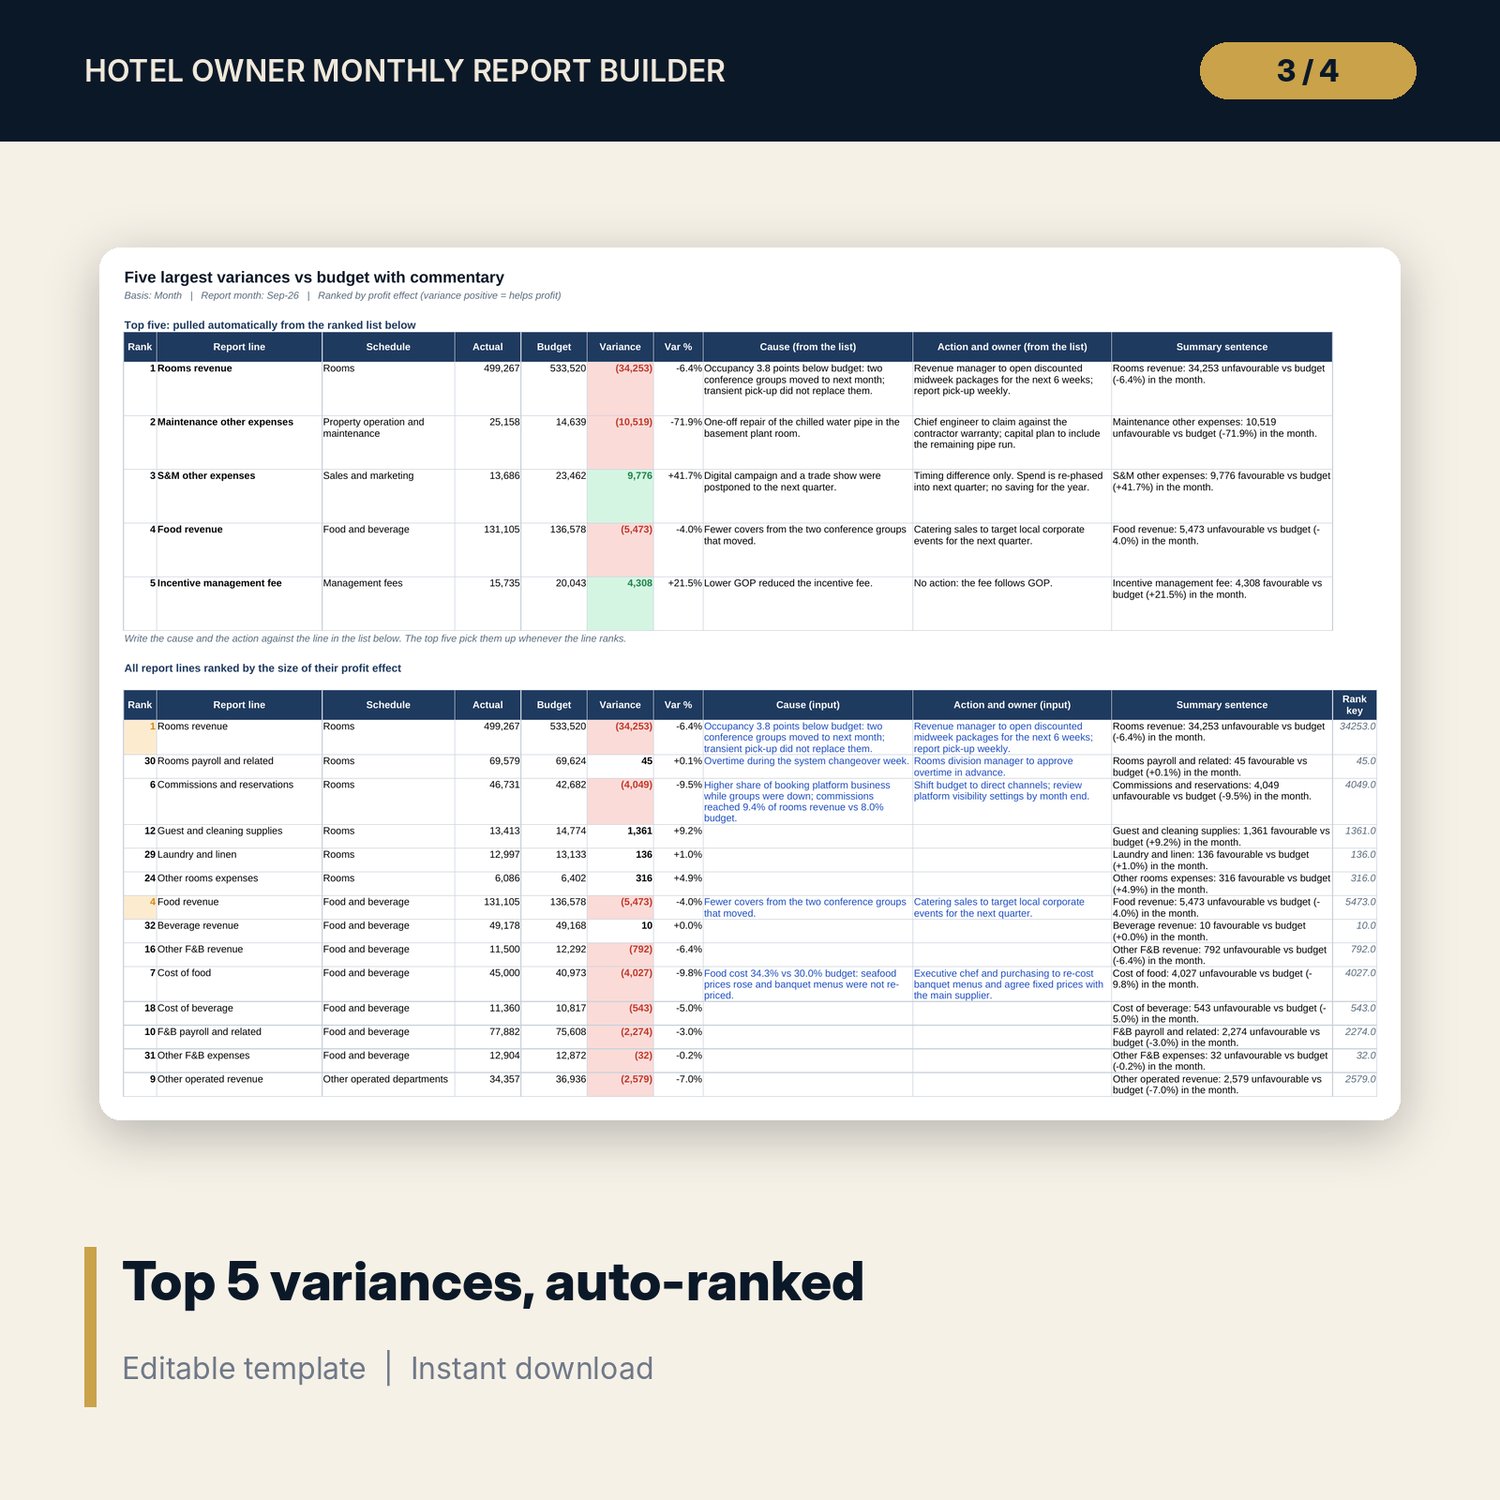
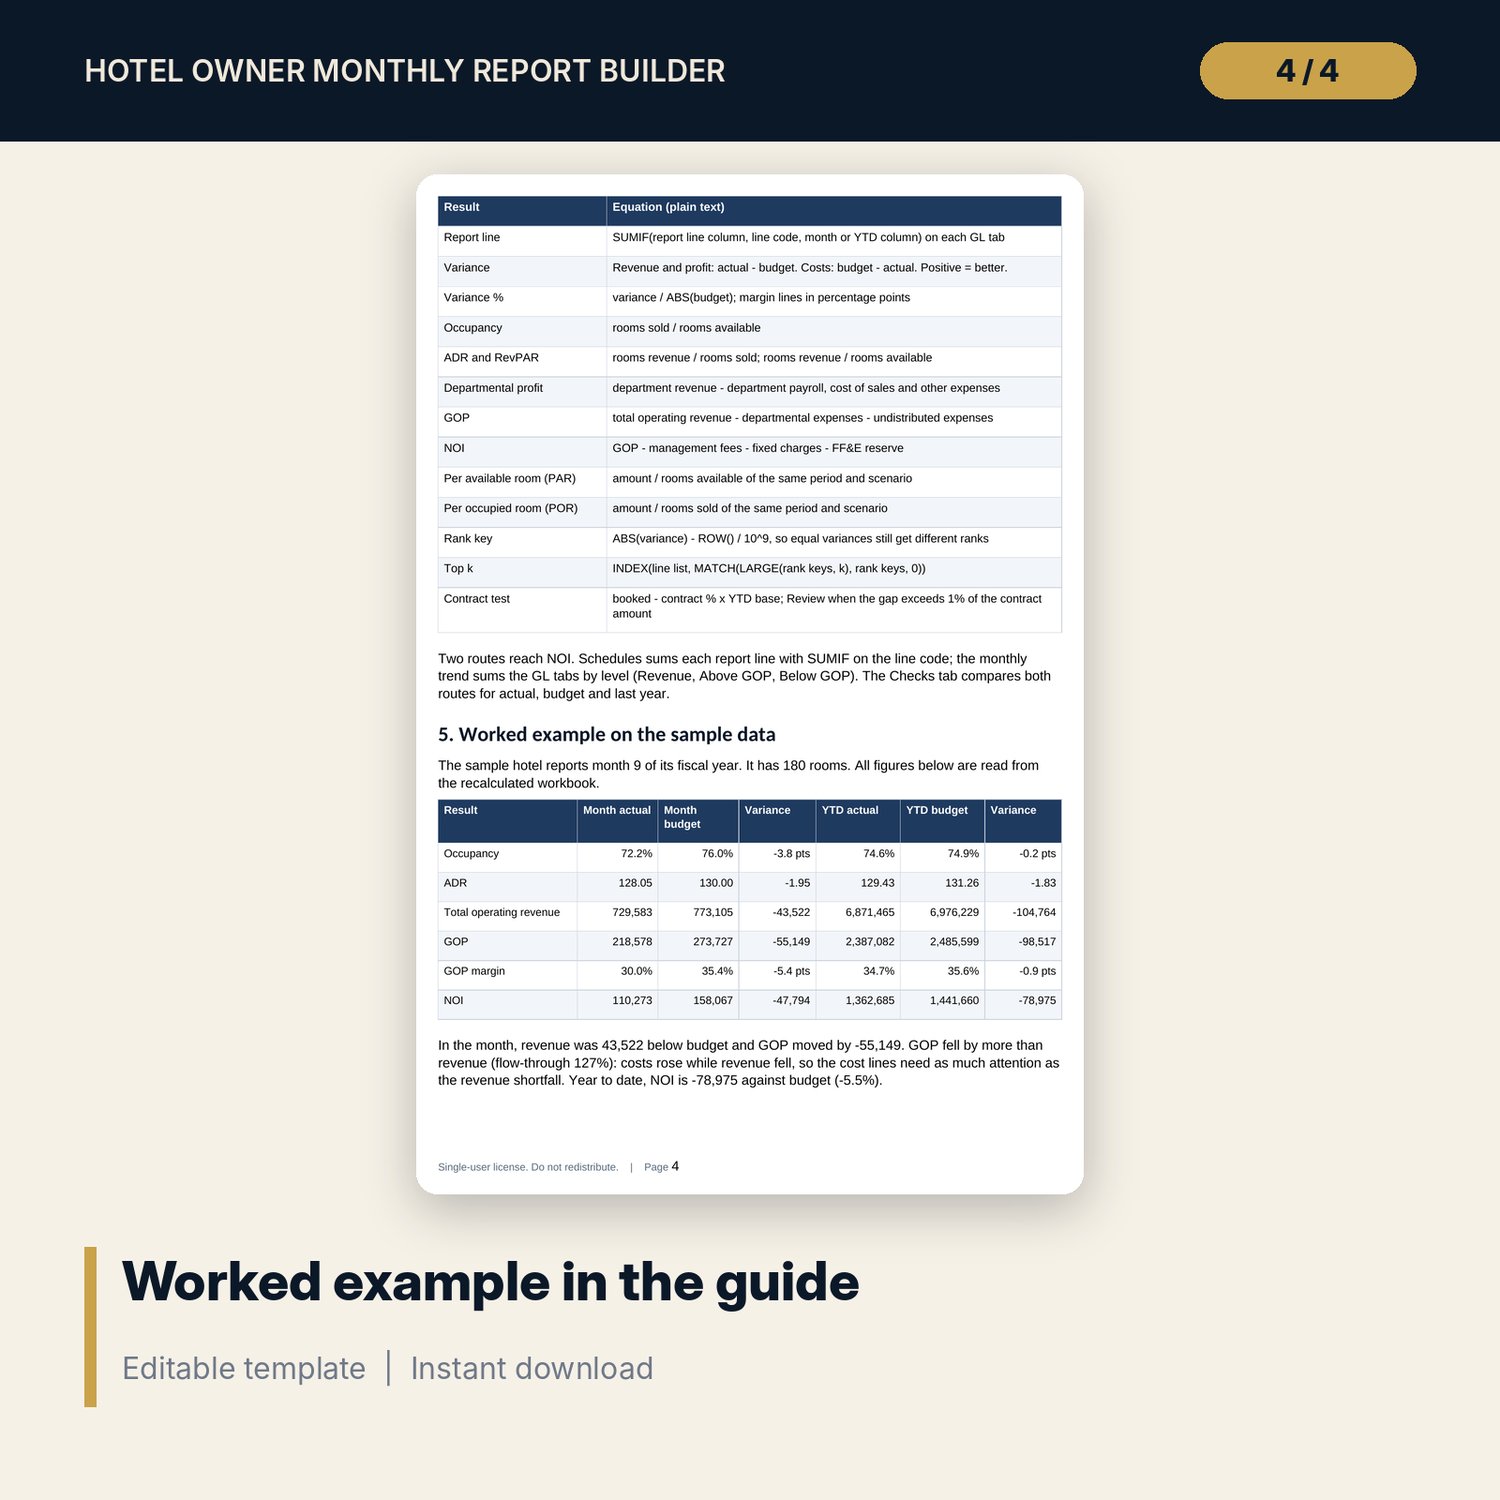
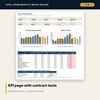
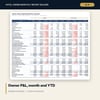
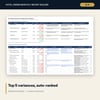
For financial controllers, general managers and asset managers who send a monthly report to a hotel owner. You map each account code to one of 40 report lines in the uniform system of accounts layout, then paste actual, budget and last-year amounts by account and month. The workbook picks the report month with INDEX, adds the year to date with SUMPRODUCT and builds departmental schedules for rooms, food and beverage, other operated departments, the undistributed departments, management fees, fixed charges and the FF&E reserve, each with month and YTD actual, budget, variance and last year, per occupied room and per available room. Summary_PL runs from revenue to GOP and NOI and can show every amount per available or per occupied room. Variances ranks all 36 money lines by profit effect and pulls the five largest, with the cause and action you wrote against each line. A KPI page tests the fees and reserve booked against your contract terms.
Save with a bundle: this workbook is also in the Hotel Finance & Investment Pro Bundle, 25 workbooks for $59 instead of $329. All 100 Pro workbooks are in the Pro Library for $119, and all 241 templates and workbooks are in the Ultimate Hospitality Library for $149.
What is inside
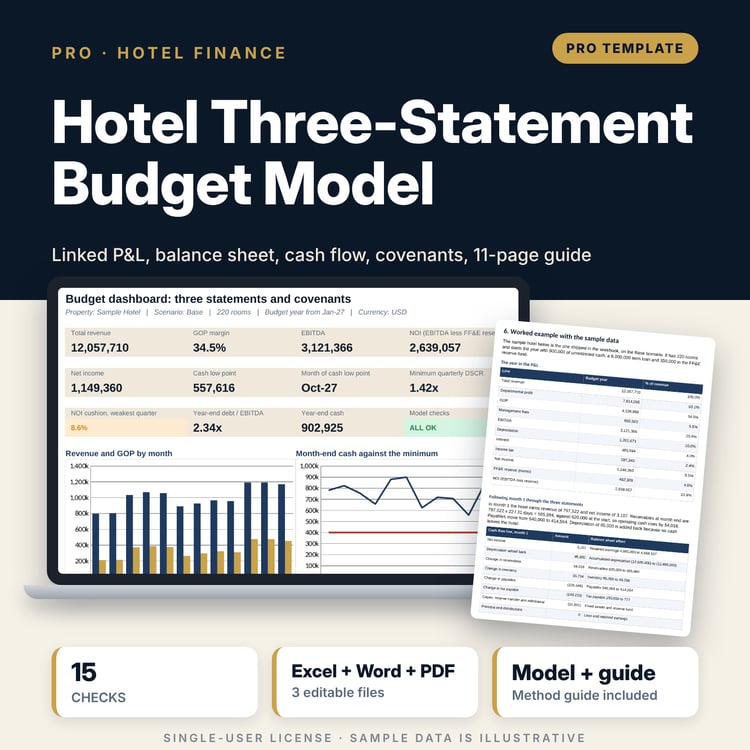
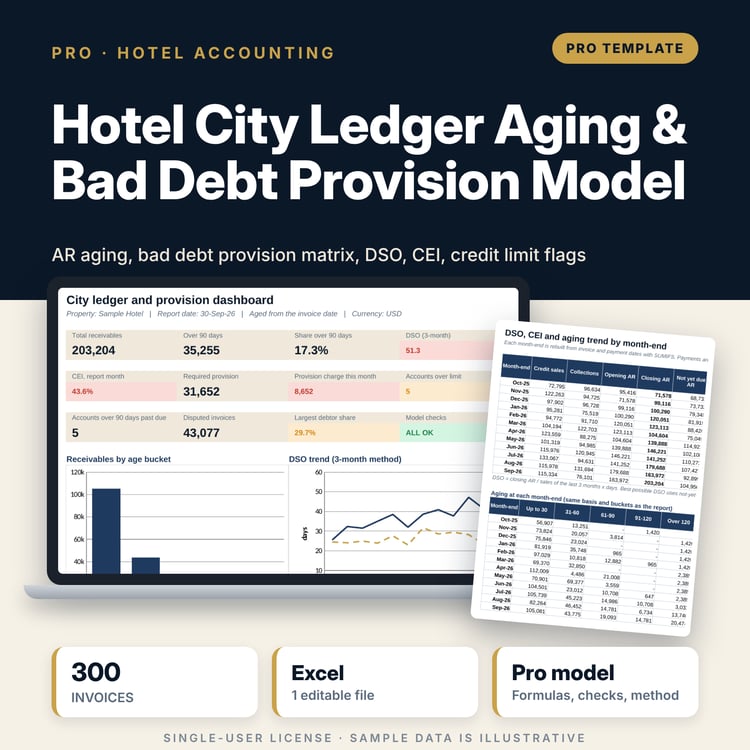
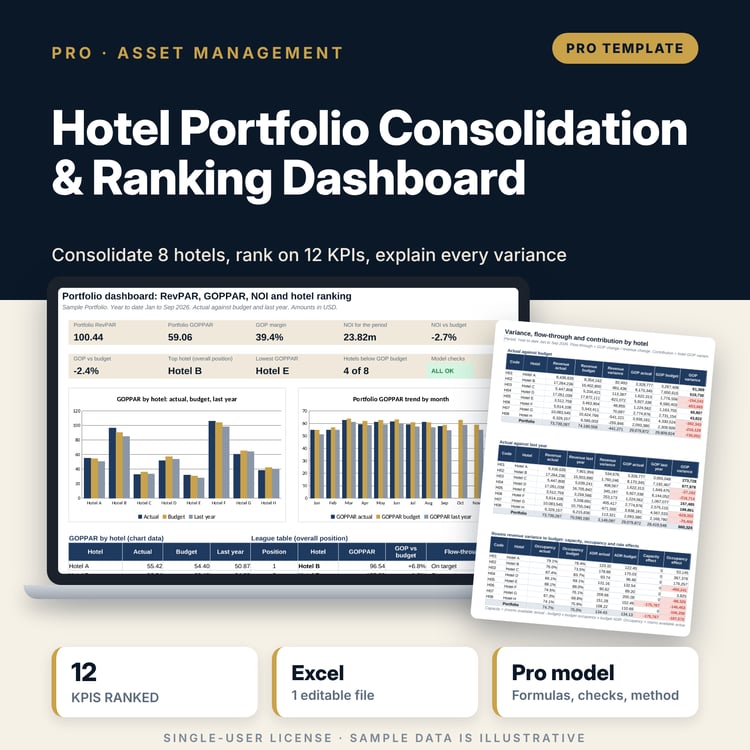
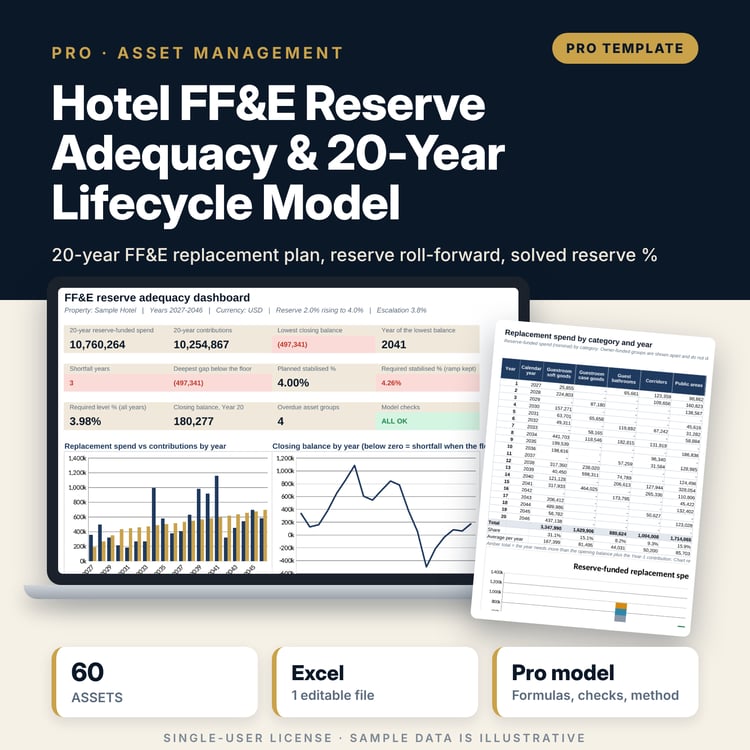
- Hotel_Owner_Monthly_Report_Builder.xlsx: 12 tabs, 5,834 formulas, 2 native charts, 13 integrity checks, 13 drop-down and input rules, a Method tab with 16 calculation notes.
- Mapping: 150 sample accounts mapped to 40 report lines in 13 schedules, 180 rows.
- GL_Actual, GL_Budget, GL_LastYear: 12 monthly columns per account (150 accounts each in the sample), report month and YTD columns.
- Schedules: 56 rows of departmental schedules with month and YTD actual, budget, variance, last year, POR and PAR.
- Summary_PL: owner P&L from rooms revenue to NOI (36 rows) and a 12-month trend of revenue, GOP and NOI.
- Variances: all 36 money lines ranked; the top 5 pulled automatically with commentary fields.
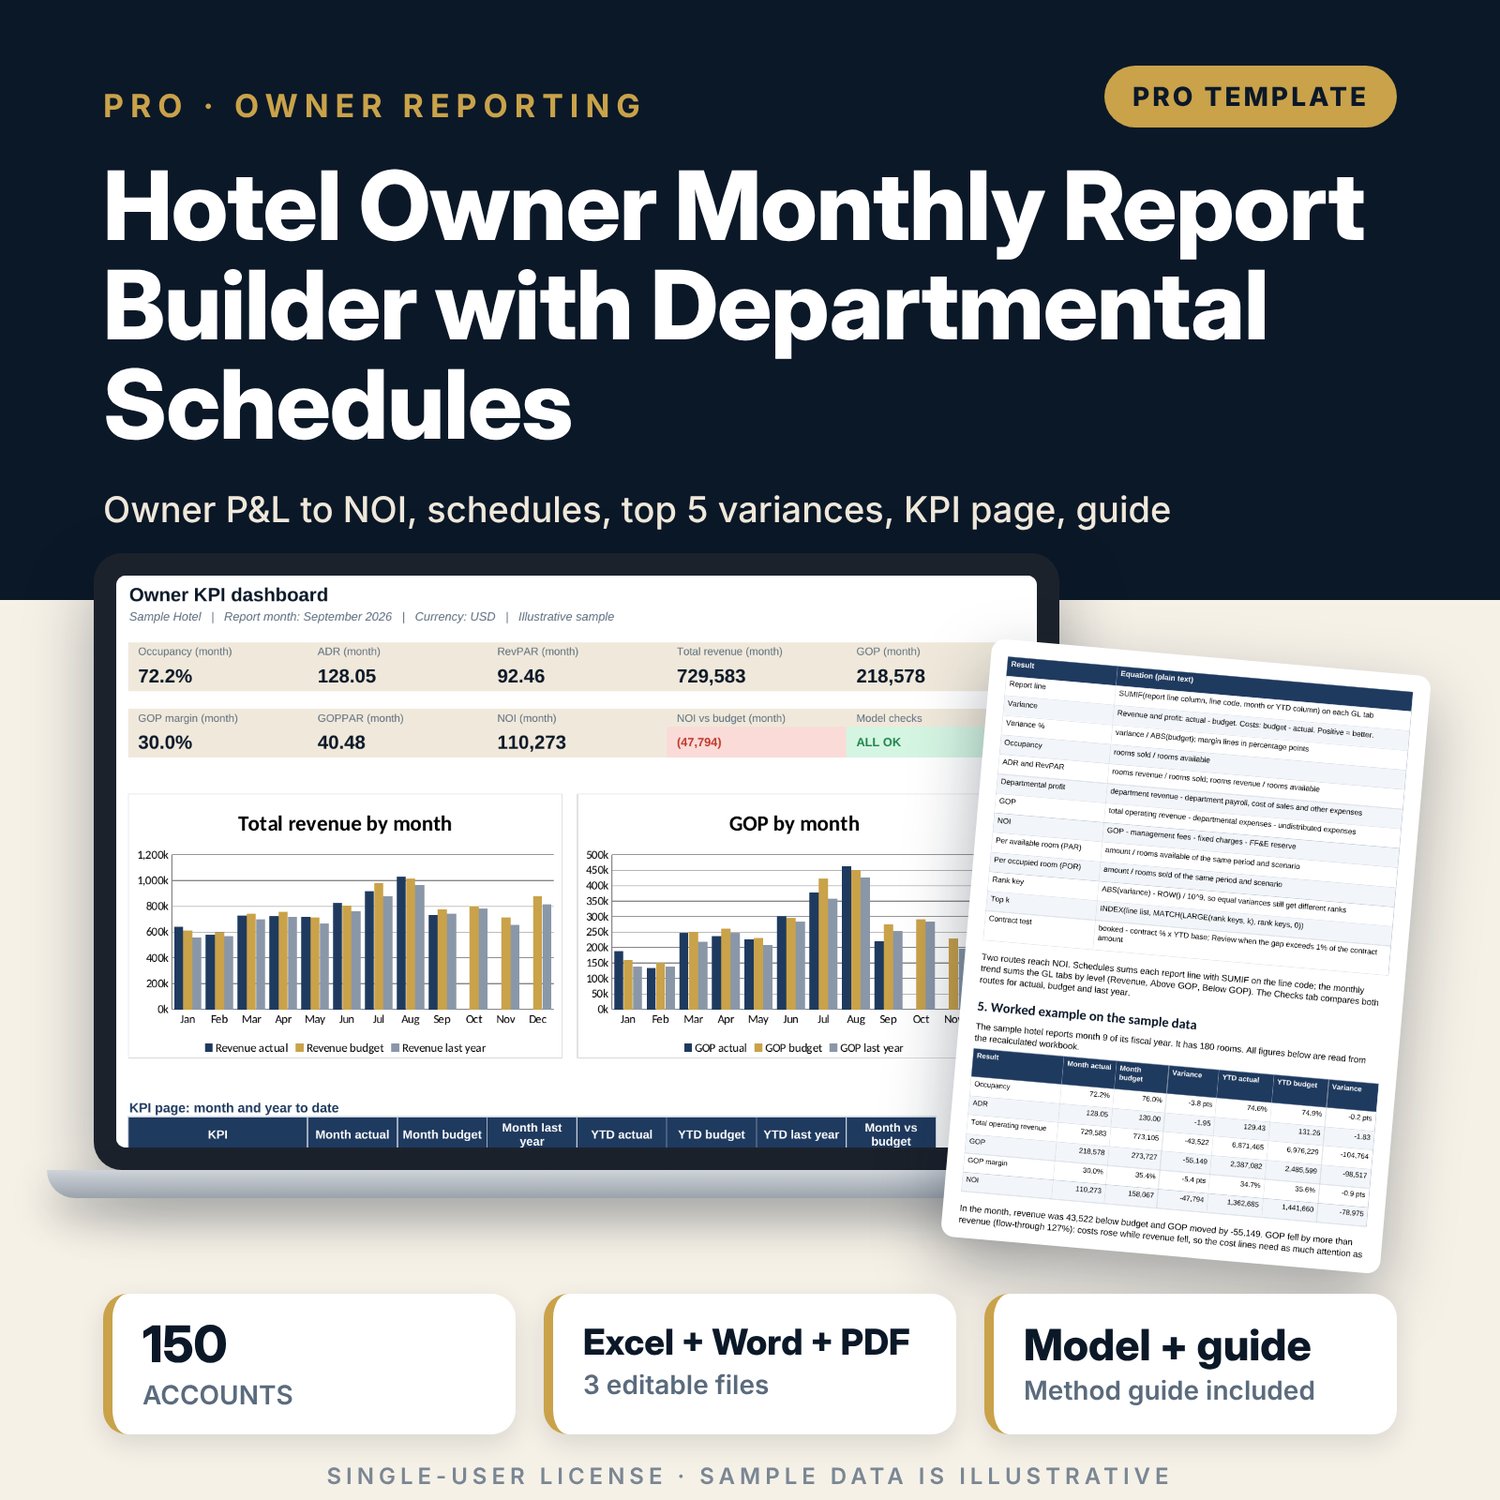
- Dashboard: 9 KPI tiles, a check tile, revenue and GOP charts, an 11-row KPI table and 3 contract tests.
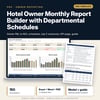
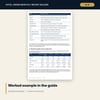
- Hotel_Owner_Monthly_Report_Guide.docx and Hotel_Owner_Monthly_Report_Guide.pdf: 10-page guide with the month-end routine, mapping rules, the method in equations, a worked example on the sample, an owner report template, commentary examples, a review checklist and a glossary.
- README.txt and LICENSE-and-Terms.txt.
How it works
- Set the rooms, fiscal year and report month on Settings.
- Map your account codes to report lines on Mapping.
- Paste actual, budget and last-year amounts by account and month.
- Read Schedules, Summary_PL and the KPI page; switch the amount view to per available or per occupied room when needed.
- Write cause and action for the top five variances, confirm Checks shows ALL OK and print the owner pack.
Details
- Formats: XLSX workbook, DOCX guide, PDF guide.
- Language: English.
- Software: Excel 2016 or later, or LibreOffice Calc 7 or later.
- No macros, no data tables, no pivot tables, no add-ins.
- Any currency; one property and one fiscal year per workbook.
- Delivery: instant download.
Good to know
- Sample data is illustrative and does not describe any real hotel.
- Not accounting, tax or legal advice. Fee and reserve terms are inputs: verify them against your agreements.
- Enter revenue and costs as positive amounts; allowances and credits as negatives.
- Single-user license.
FAQ
Can I use my own chart of accounts?
Yes. List your account codes on Mapping and pick a report line for each. The Checks tab flags any account in the ledger that is not mapped.
How are the five largest variances chosen?
Every money line gets a profit-signed variance (revenue above budget or cost below budget is positive). The workbook ranks the absolute values and pulls the top five with INDEX, MATCH and LARGE, month or YTD as you choose.
Does the commentary stay with the right line when the ranking changes?
Yes. Cause and action are typed against each line in the ranked list, and the top five read them from there.
Can it show per available room and per occupied room?
Yes. One drop-down on Settings switches Summary_PL between totals, per available room and per occupied room. Schedules always shows YTD POR and PAR.
How do I know the totals are right?
The Checks tab runs 13 tests, including NOI reached by two independent routes for actual, budget and last year, and a test that all line variances add up to the NOI variance.