
Owner-Operator Financial Dashboard Spreadsheet
On Sale
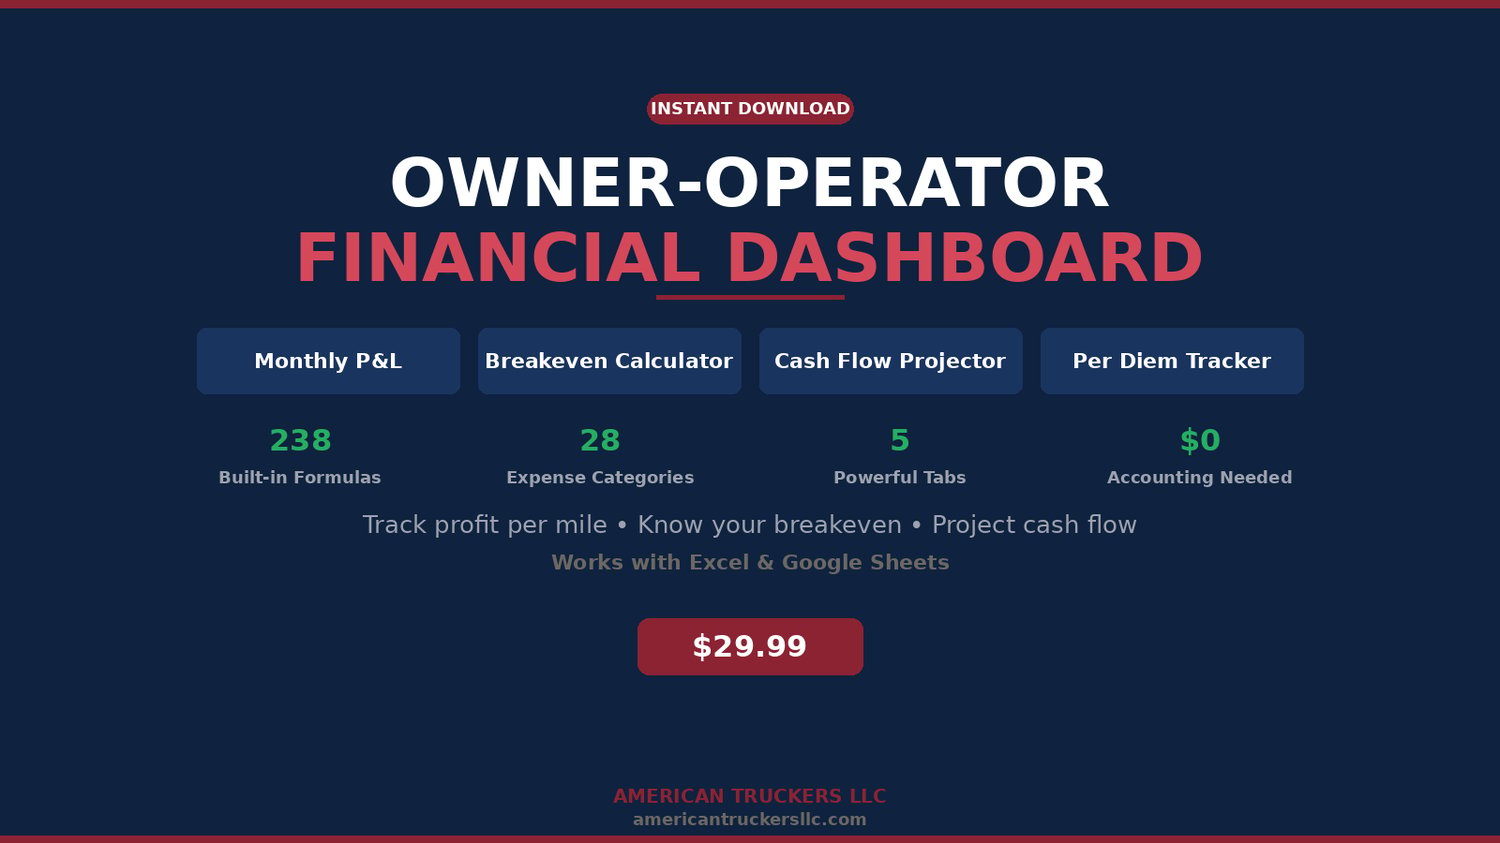
$29.99
$29.99
Stop guessing if you're making money. Start knowing.
The Owner-Operator Financial Dashboard is an all-in-one Excel spreadsheet that tracks your profit, calculates your cost per mile, and shows you exactly where every dollar goes — automatically.
WHAT'S INSIDE (5 TABS):
- KPI Dashboard — YTD revenue, net profit, profit margin, revenue per mile, cost per mile, profit per mile, and breakeven RPM. All auto-calculated.
- Monthly P&L — 28 trucking-specific expense categories (fuel, truck payment, insurance, maintenance, tires, tolls, dispatch fees, factoring, ELD, load boards, and 18 more). Enter your numbers monthly — everything else calculates.
- Breakeven Calculator — Enter your costs and rate per mile. Instantly see your breakeven miles per month, breakeven revenue, and projected annual profit.
- 12-Month Cash Flow Projector — See your cash position month by month before problems happen. Critical for new carriers.
- Per Diem Tracker — Auto-calculates your $80/day × 80% tax deduction based on days away from home.
- Instructions Tab — Step-by-step guide. No accounting experience needed.
THE NUMBERS:
- 238 built-in formulas
- 28 expense categories built for trucking
- 5 tabs covering every financial angle
- Works with Excel, Google Sheets, Apple Numbers & LibreOffice
- Blue cells = your inputs. Everything else calculates automatically.
Instant download. Start tracking today.