Restaurant Sales Forecast with Seasonality & Weekday Factors: Daily Covers and Sales Forecast Template for Restaurants
Full description
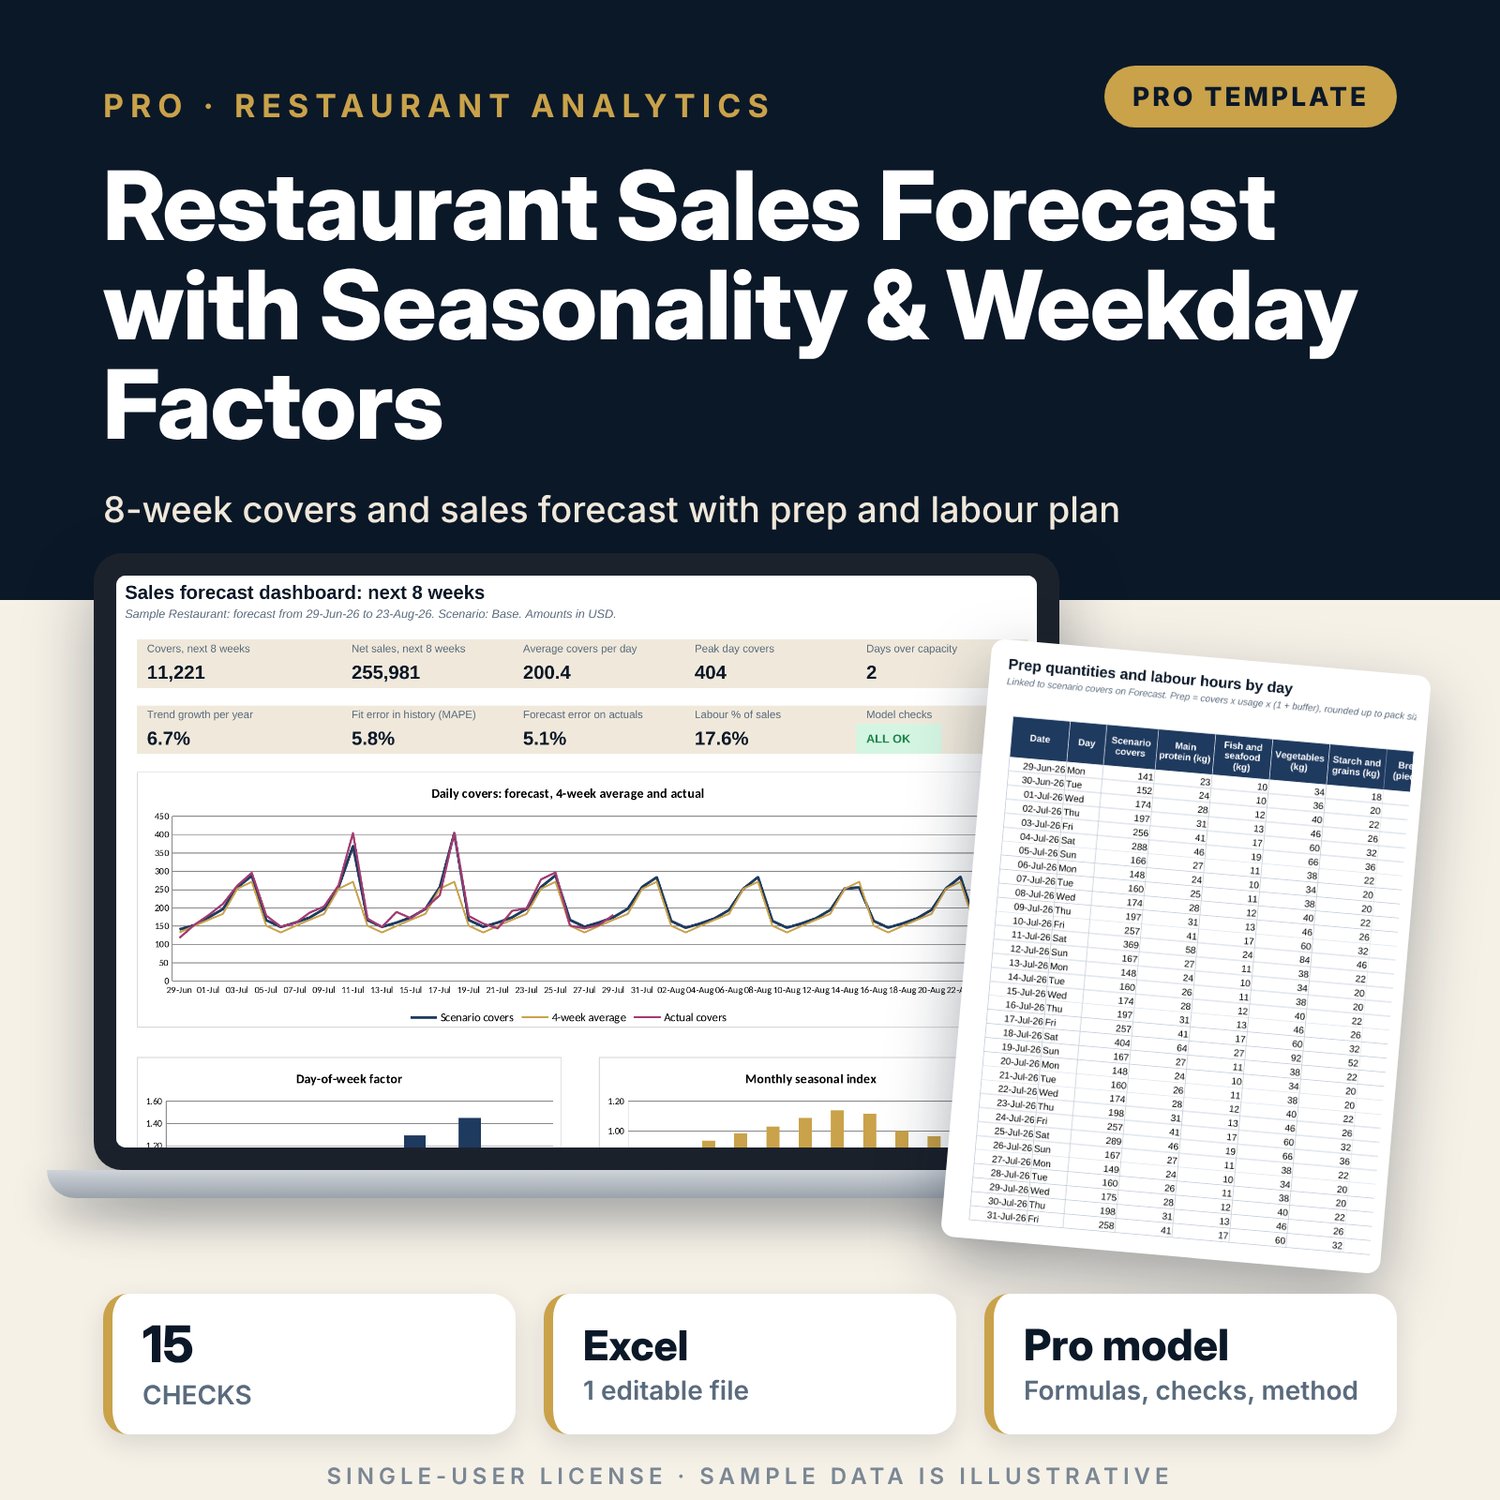
For restaurant general managers, executive chefs, financial controllers and revenue managers who schedule staff and order food from a forecast. The workbook splits 728 days of covers into event adjustment, day-of-week factor, two-pass regression trend (SLOPE, INTERCEPT, RSQ) and monthly seasonal index, then forecasts the next 56 days. It adds an average check by weekday and a planned price change to give daily sales, tracks accuracy against a 4-week average and the same day last year as actuals arrive, and links each day's covers to prep quantities and kitchen and floor labour hours with capacity and minimum-crew flags. Each step has its own column, so every number can be audited.
Save with a bundle: this workbook is also in the F&B Control & Audit Pro Bundle, 25 workbooks for $59 instead of $310. All 100 Pro workbooks are in the Pro Library for $119, and all 241 templates and workbooks are in the Ultimate Hospitality Library for $149.
What is inside
- Restaurant_Sales_Forecast_Model.xlsx: 12 tabs, 22,787 formulas, 5 native charts, 16 drop-down and input rules
- History: 728 sample days of covers and net sales (104 weeks) plus 42 spare rows
- Engine: 770 rows by 22 columns, one step per column, with outlier flags
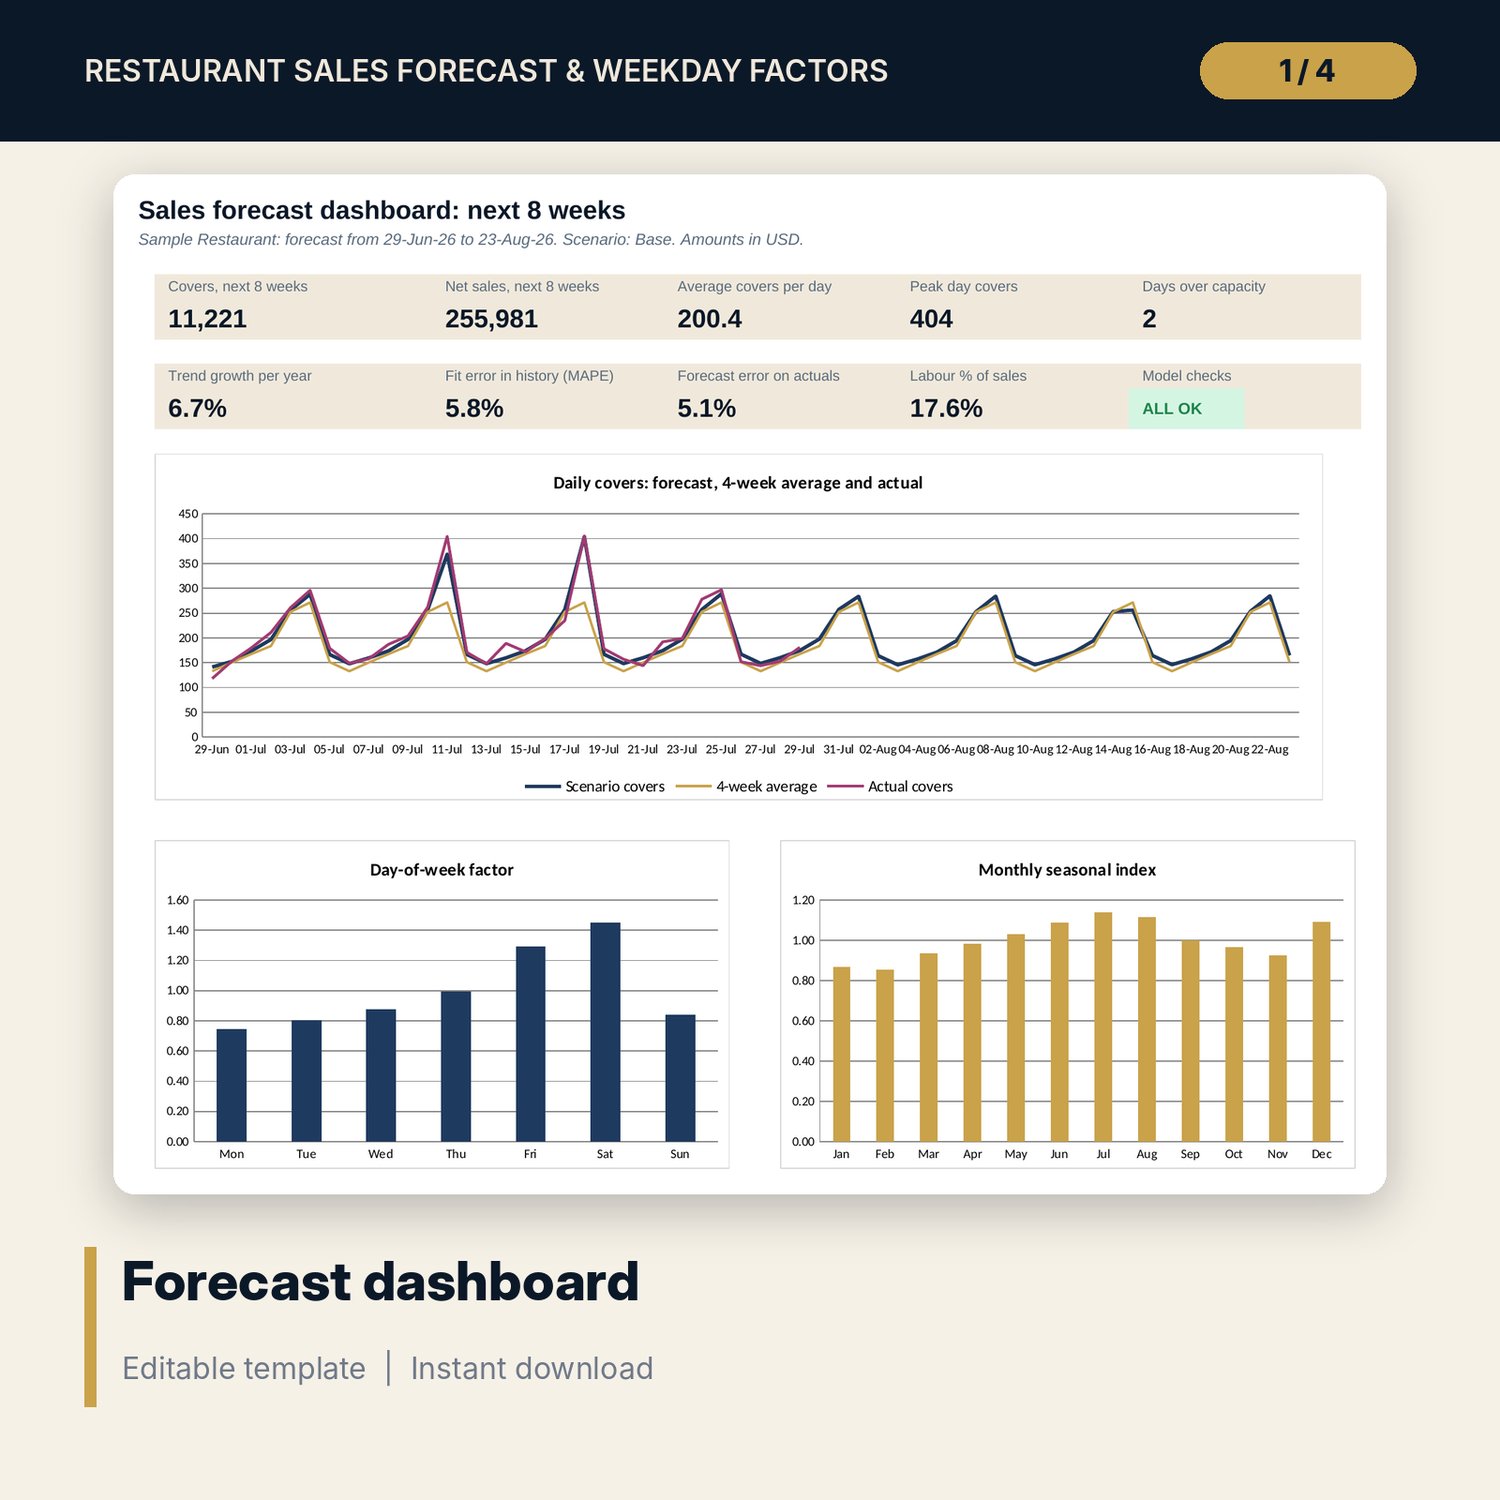
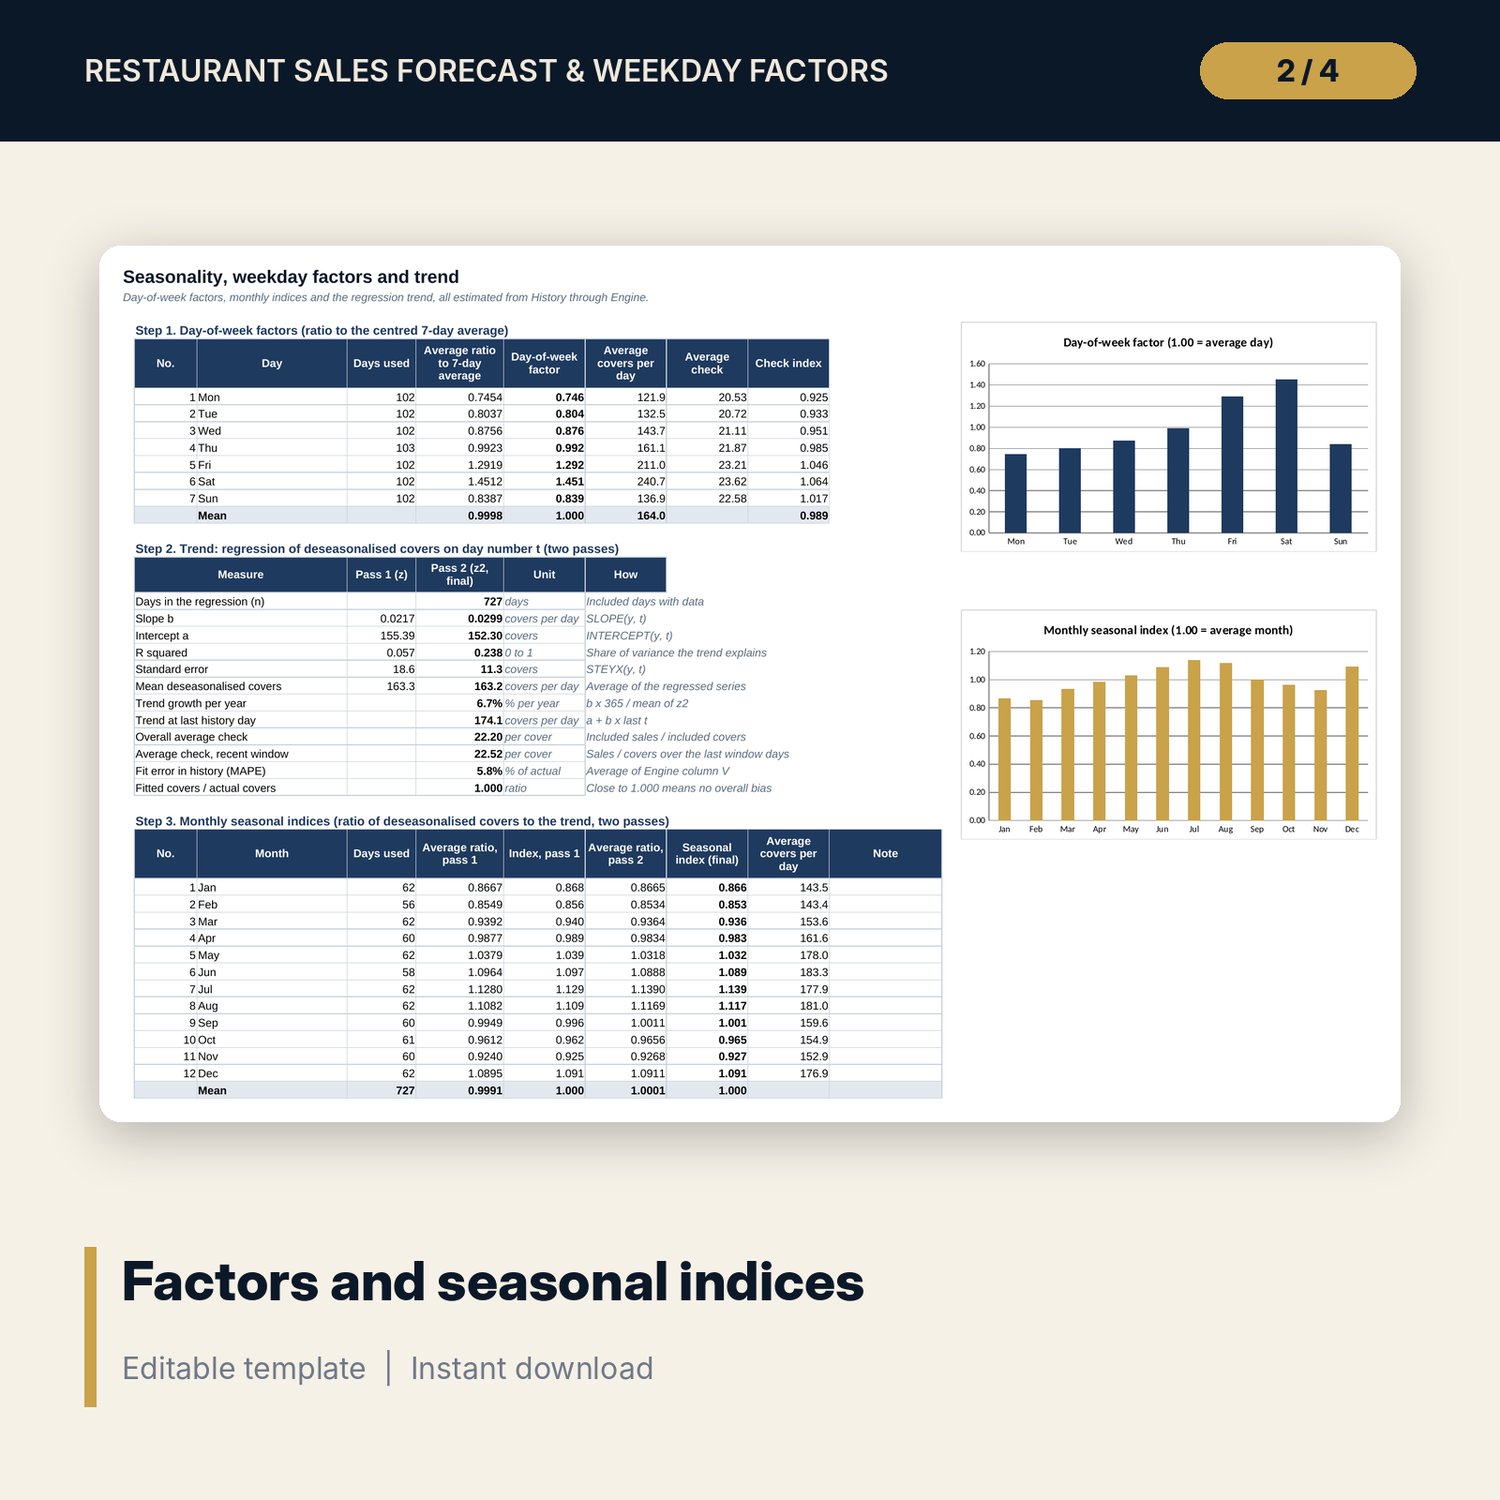
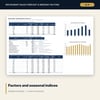
- Factors: 7 day-of-week factors, 12 monthly indices, trend regression block and average check by weekday
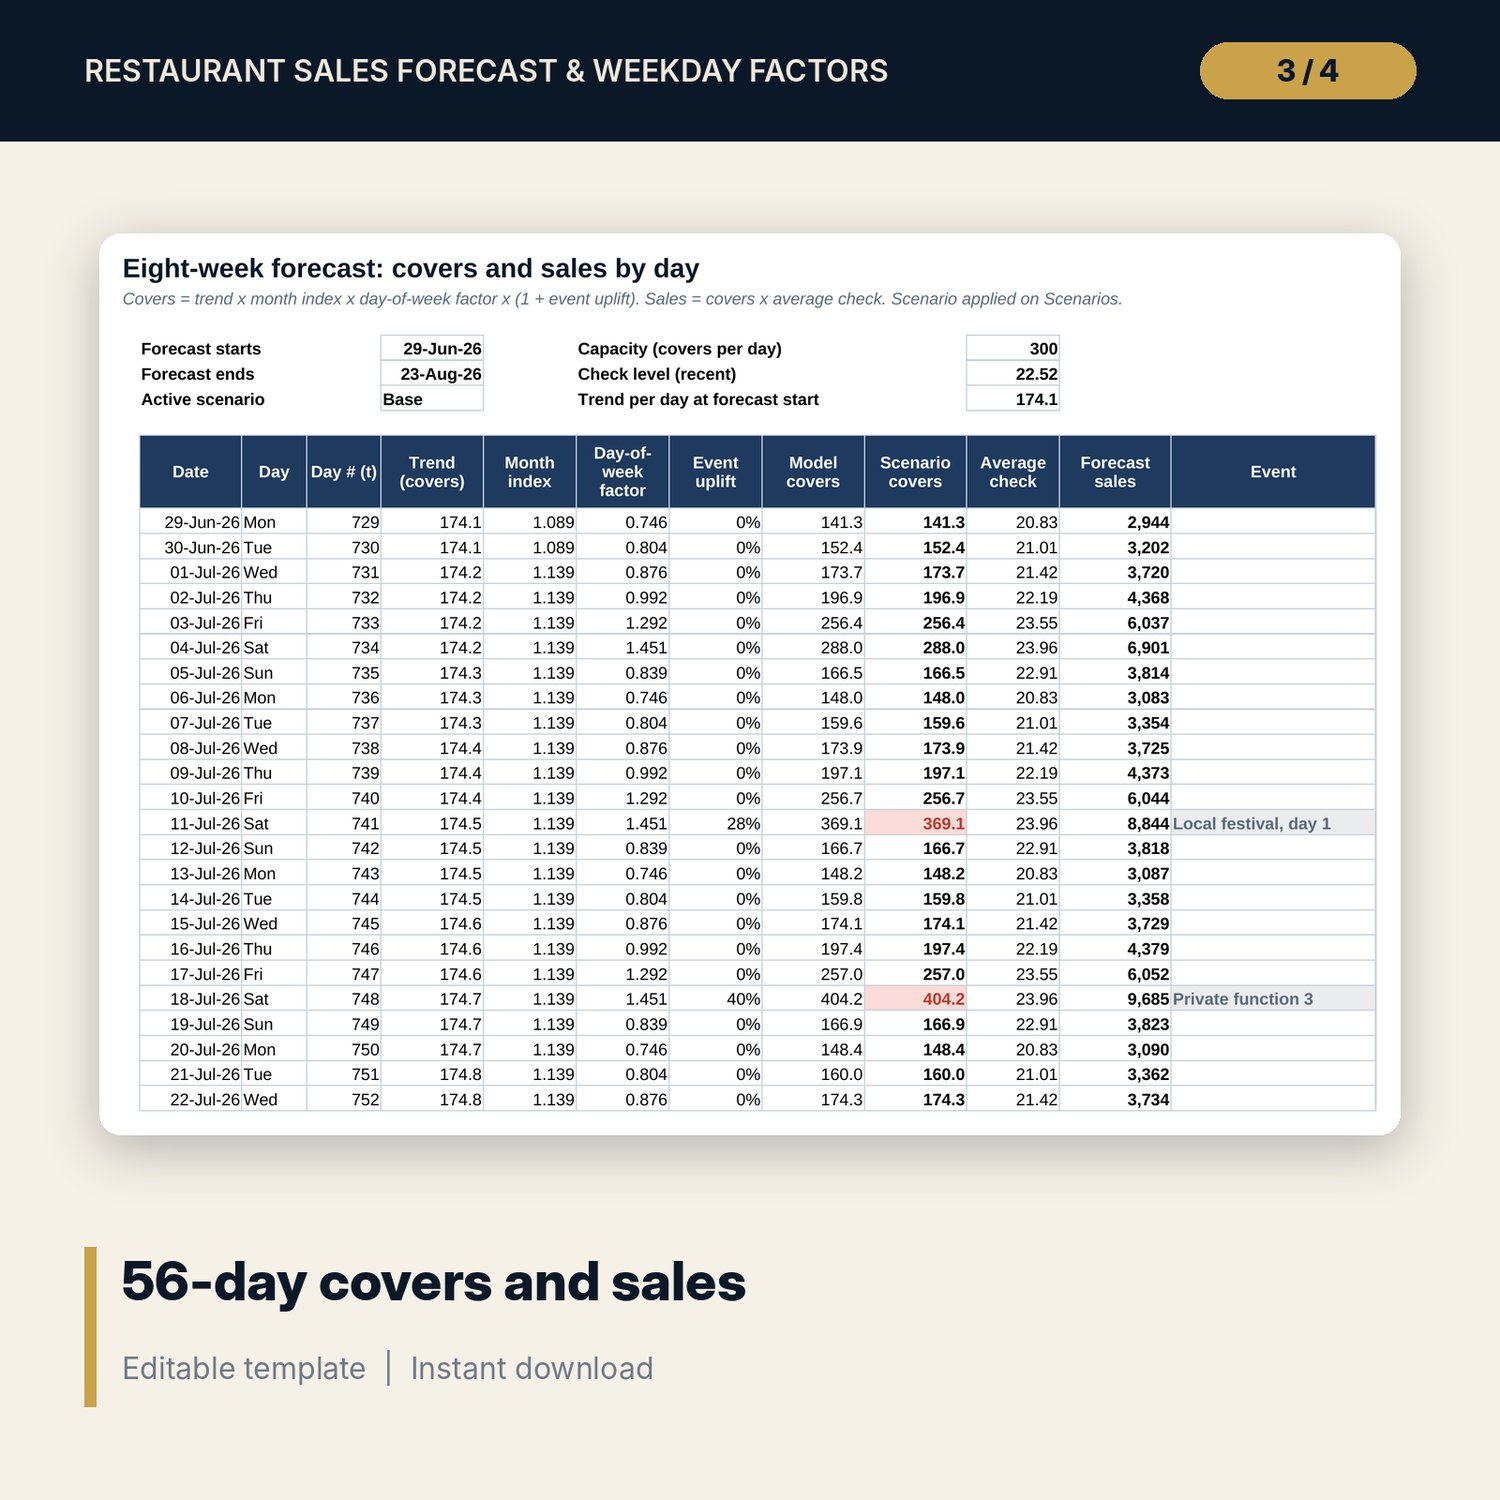
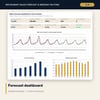
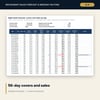
- Forecast: 56 days of covers, sales and event uplift; weekly summary
- Accuracy: 56 rows for actuals, three-method comparison, bias z-score and weekly status
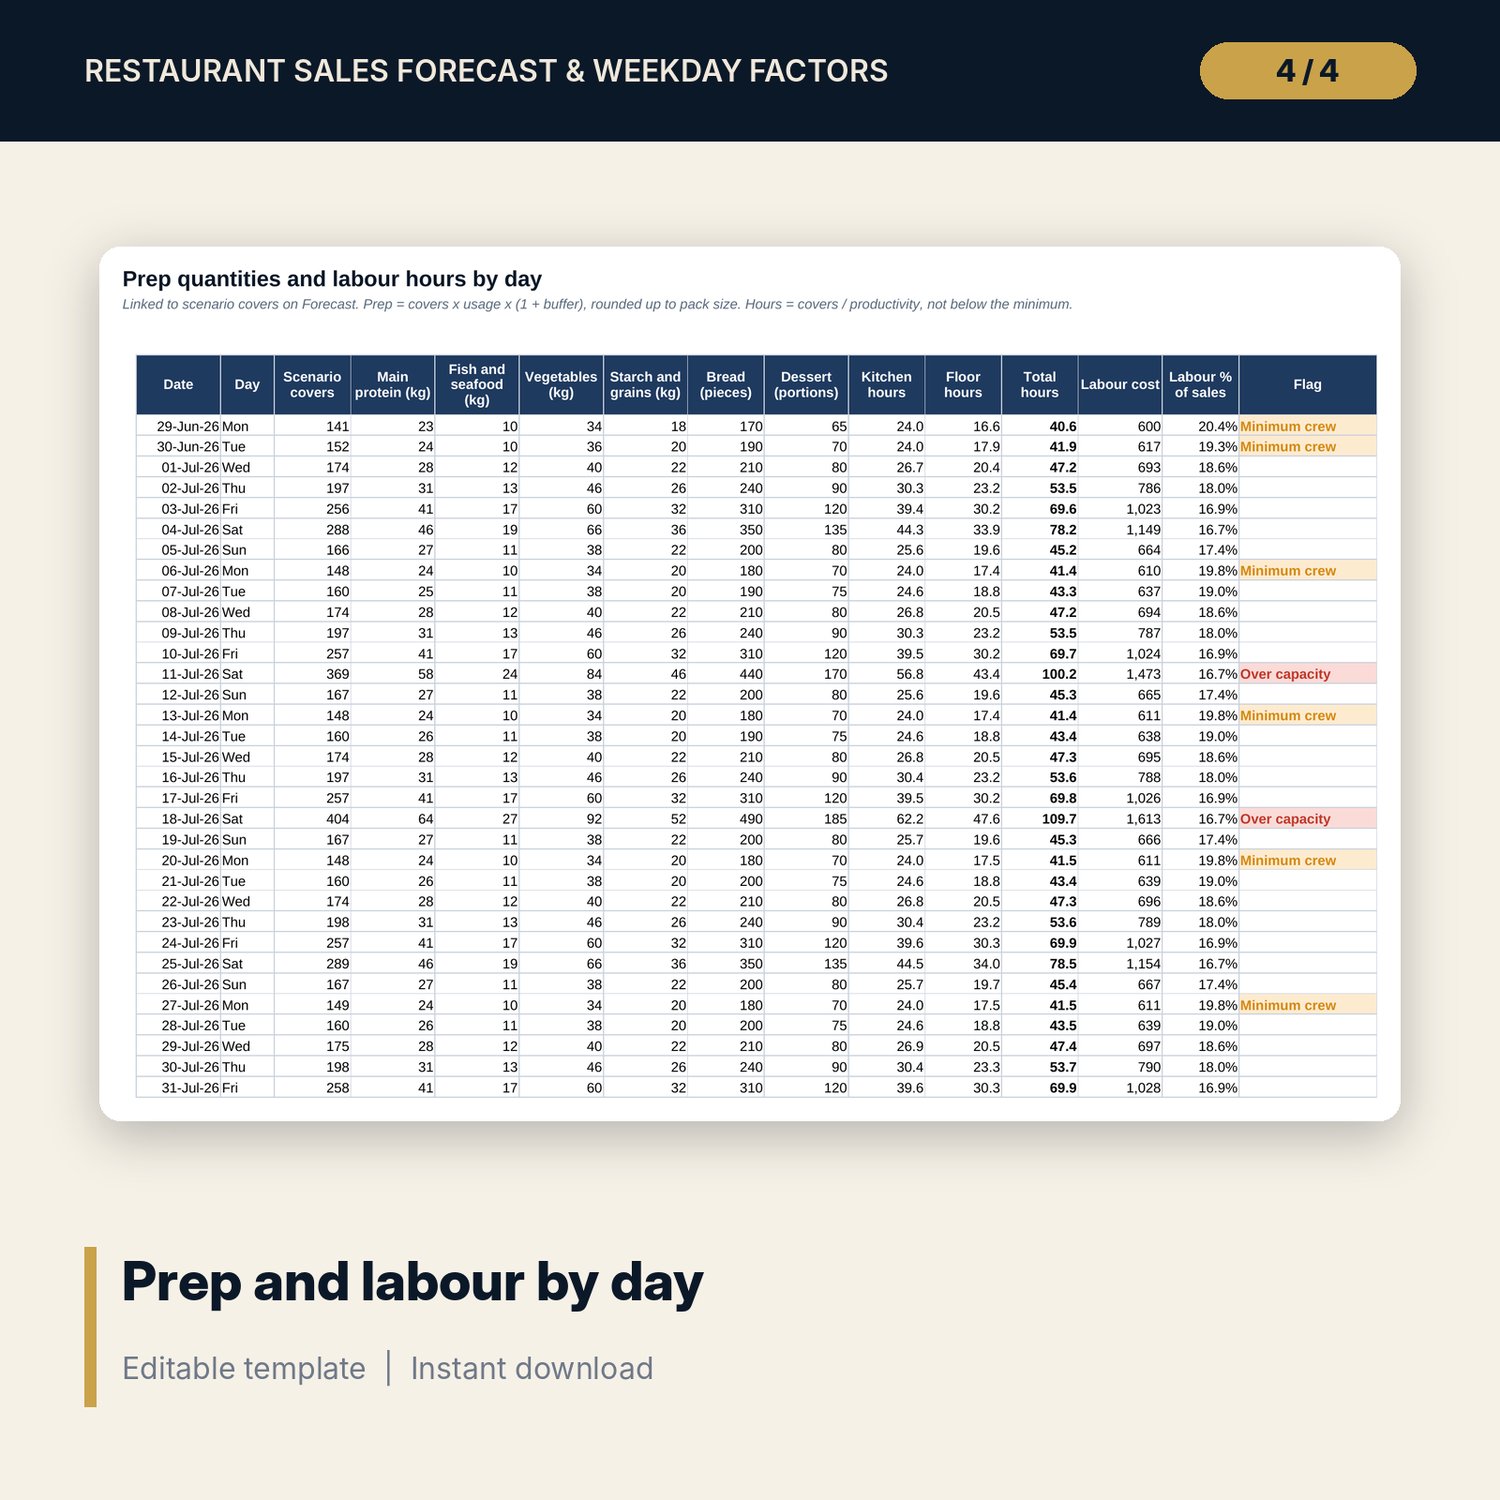
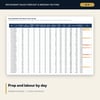
- Prep_Labour: 6 prep items and kitchen and floor hours for each of 56 days
- Scenarios: 3 scenarios, a comparison table and 2 sensitivity grids
- Event and holiday calendar with 40 rows and observed uplift for past events
- Dashboard (one printed page), 15 integrity checks and a Method tab with 18 documented calculations
- README.txt and LICENSE-and-Terms.txt
How it works
- Enter seats, thresholds, prep usage per cover and labour inputs on Assumptions.
- Paste at least 364 days of daily covers and net sales into History. List events and holidays with an expected uplift.
- Read the factors, trend and fit error on Factors, then the 8-week forecast on Forecast and Dashboard.
- Use Prep_Labour for daily prep quantities and labour hours. Test demand, check and productivity changes on Scenarios.
- Enter actual covers and sales on Accuracy as days pass and watch MAPE and the bias test.
Details
- Format: one .xlsx workbook, English
- Software: Excel 2016 or later, or LibreOffice Calc 7 or later
- No macros, no external links, no data tables, no array formulas
- Instant digital download
Good to know
- Sample data is illustrative. Replace it with your own figures.
- Prep usage, pack sizes, productivity and hourly costs are sample inputs. Verify them with your own recipes, rosters and local labour requirements.
- The model assumes patterns repeat. A new menu, a rebuild or a change in opening hours needs a fresh look at the history.
- This is a planning tool, not financial advice.
- Single-user license. Do not redistribute.
FAQ
How much history do I need?
At least 364 days so each month has data. Two years give steadier monthly indices. The tab holds up to 770 days.
How does it handle holidays and events?
List each date with an expected uplift. History is adjusted before the factors are estimated, and the forecast applies the uplift again. The calendar shows the observed uplift for past events so you can revise your guess.
How do I know if the forecast is any good?
Type actual covers and sales on Accuracy. It reports MAPE for the model, a 4-week average and the same day last year, plus a bias z-score that flags a forecast leaning one way.
Can I run what-if cases?
Yes. Pick Base, Upside or Downside on Scenarios, or edit the drivers. Two grids show 8-week sales and labour cost % across a range of changes.
Does it need macros or add-ins?
No. Every result is a standard worksheet formula.