
Cooling & Reheating Validation Log with Cooling Curve Analysis: Two-Stage Cooling Log
Full description
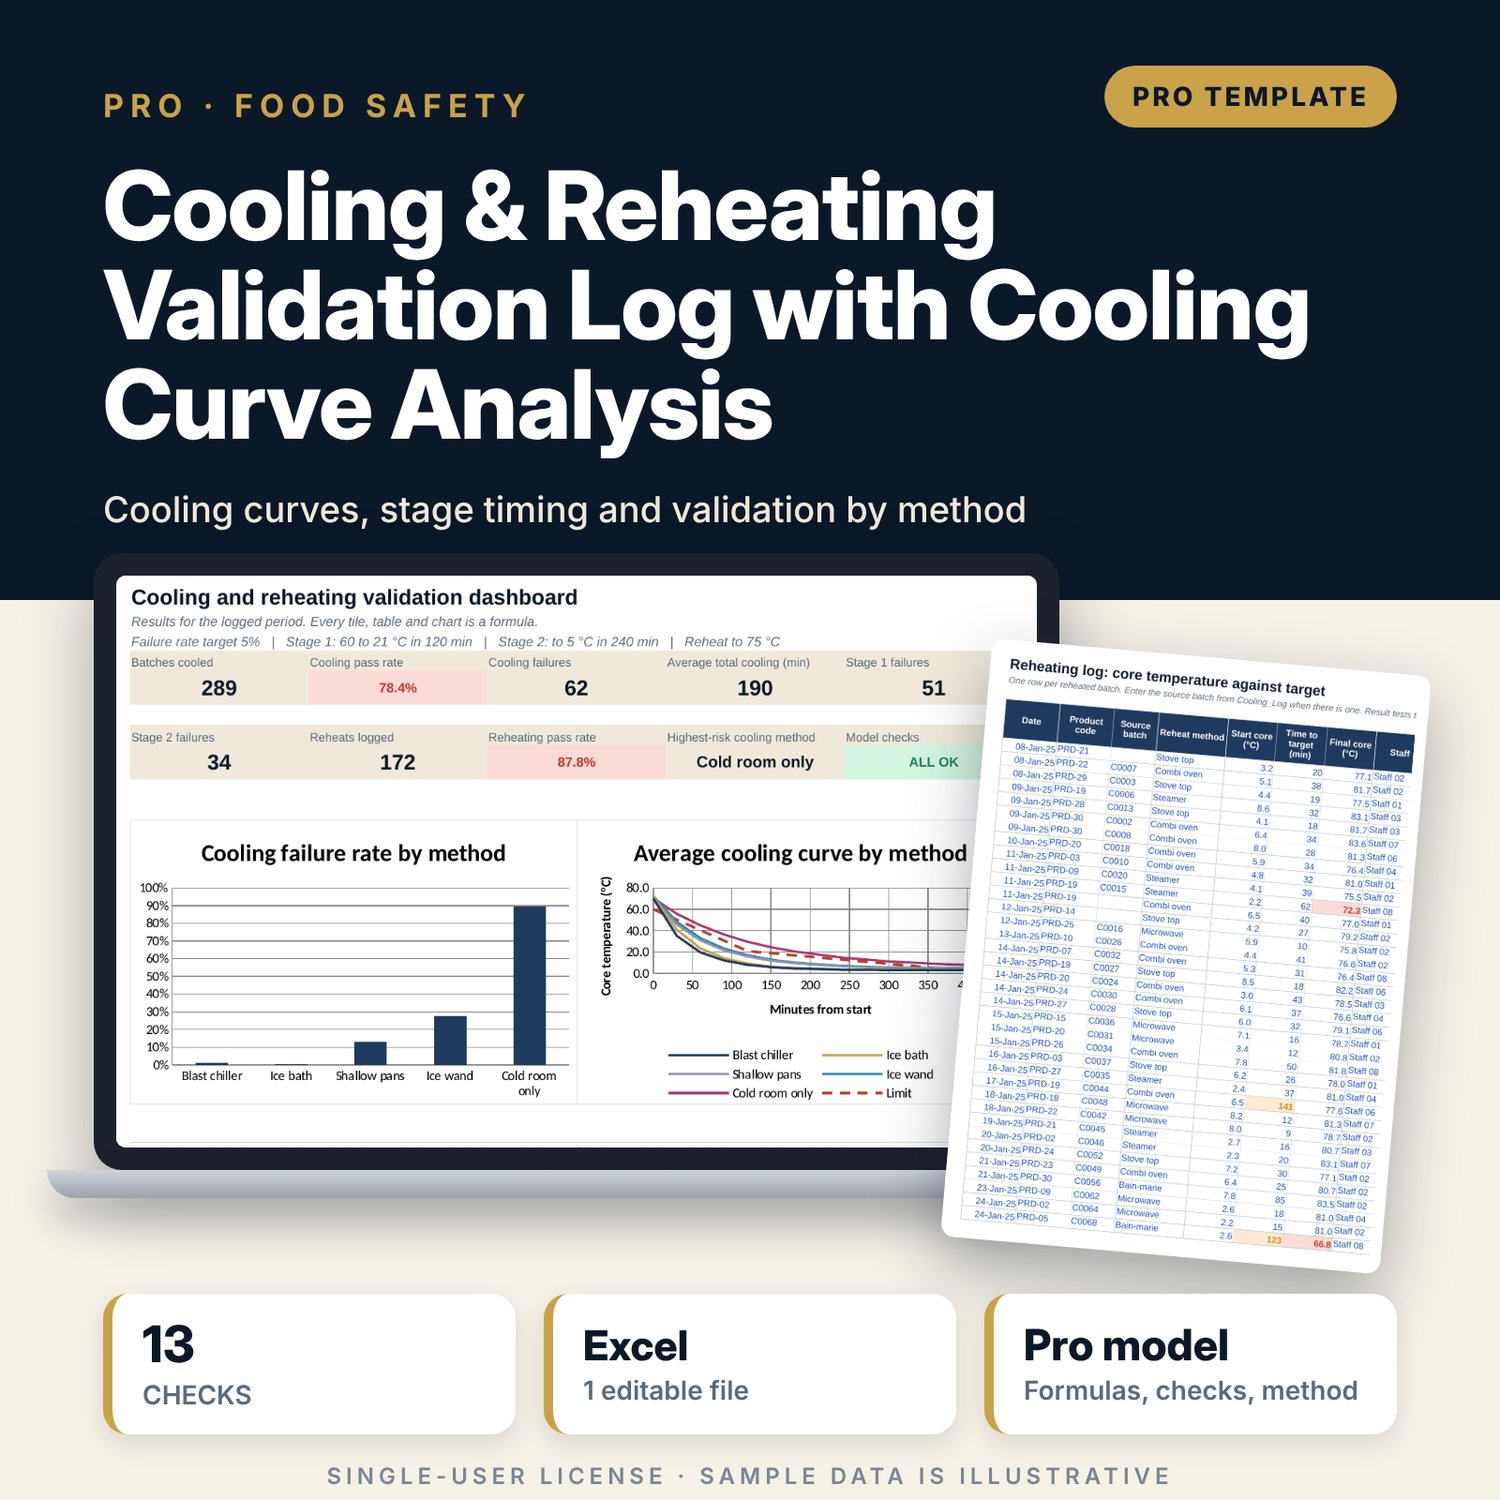
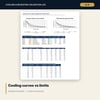
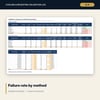
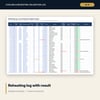
This workbook is for executive chefs, food safety managers, quality leads and kitchen managers who must prove that cooked food cools safely. You log the core temperature at scheduled minutes for each batch, along with method, depth and product. The engine finds the time the core crosses each critical limit by straight-line interpolation, then works out the stage 1 and stage 2 times, the cooling rate in each stage and a pass, fail or incomplete result against limits you set. A reheating log tests core temperature, time to target and the age of the source batch. The summary shows the failure rate by method and by product and says whether each method is validated on enough batches. Cooling curves plot any batches you pick and the average curve for each method against the limit envelope.
Save with a bundle: this workbook is also in the F&B Control & Audit Pro Bundle, 25 workbooks for $59 instead of $310. All 100 Pro workbooks are in the Pro Library for $119, and all 241 templates and workbooks are in the Ultimate Hospitality Library for $149.
What is inside
- 1 Excel workbook with 12 tabs and 15,074 formulas, no macros
- Settings: stage 1 and stage 2 limits, reheating target, reading schedule (11 readings), validation targets and lists
- Products: 30 sample cooked products in 6 categories, with 20 spare rows
- Cooling_Log: 289 sample batches (room for 350) with 11 core temperature readings each
- Cooling_Calc: engine with crossing times, stage times, rates and results for every batch; Curve_Data fills each curve for plotting
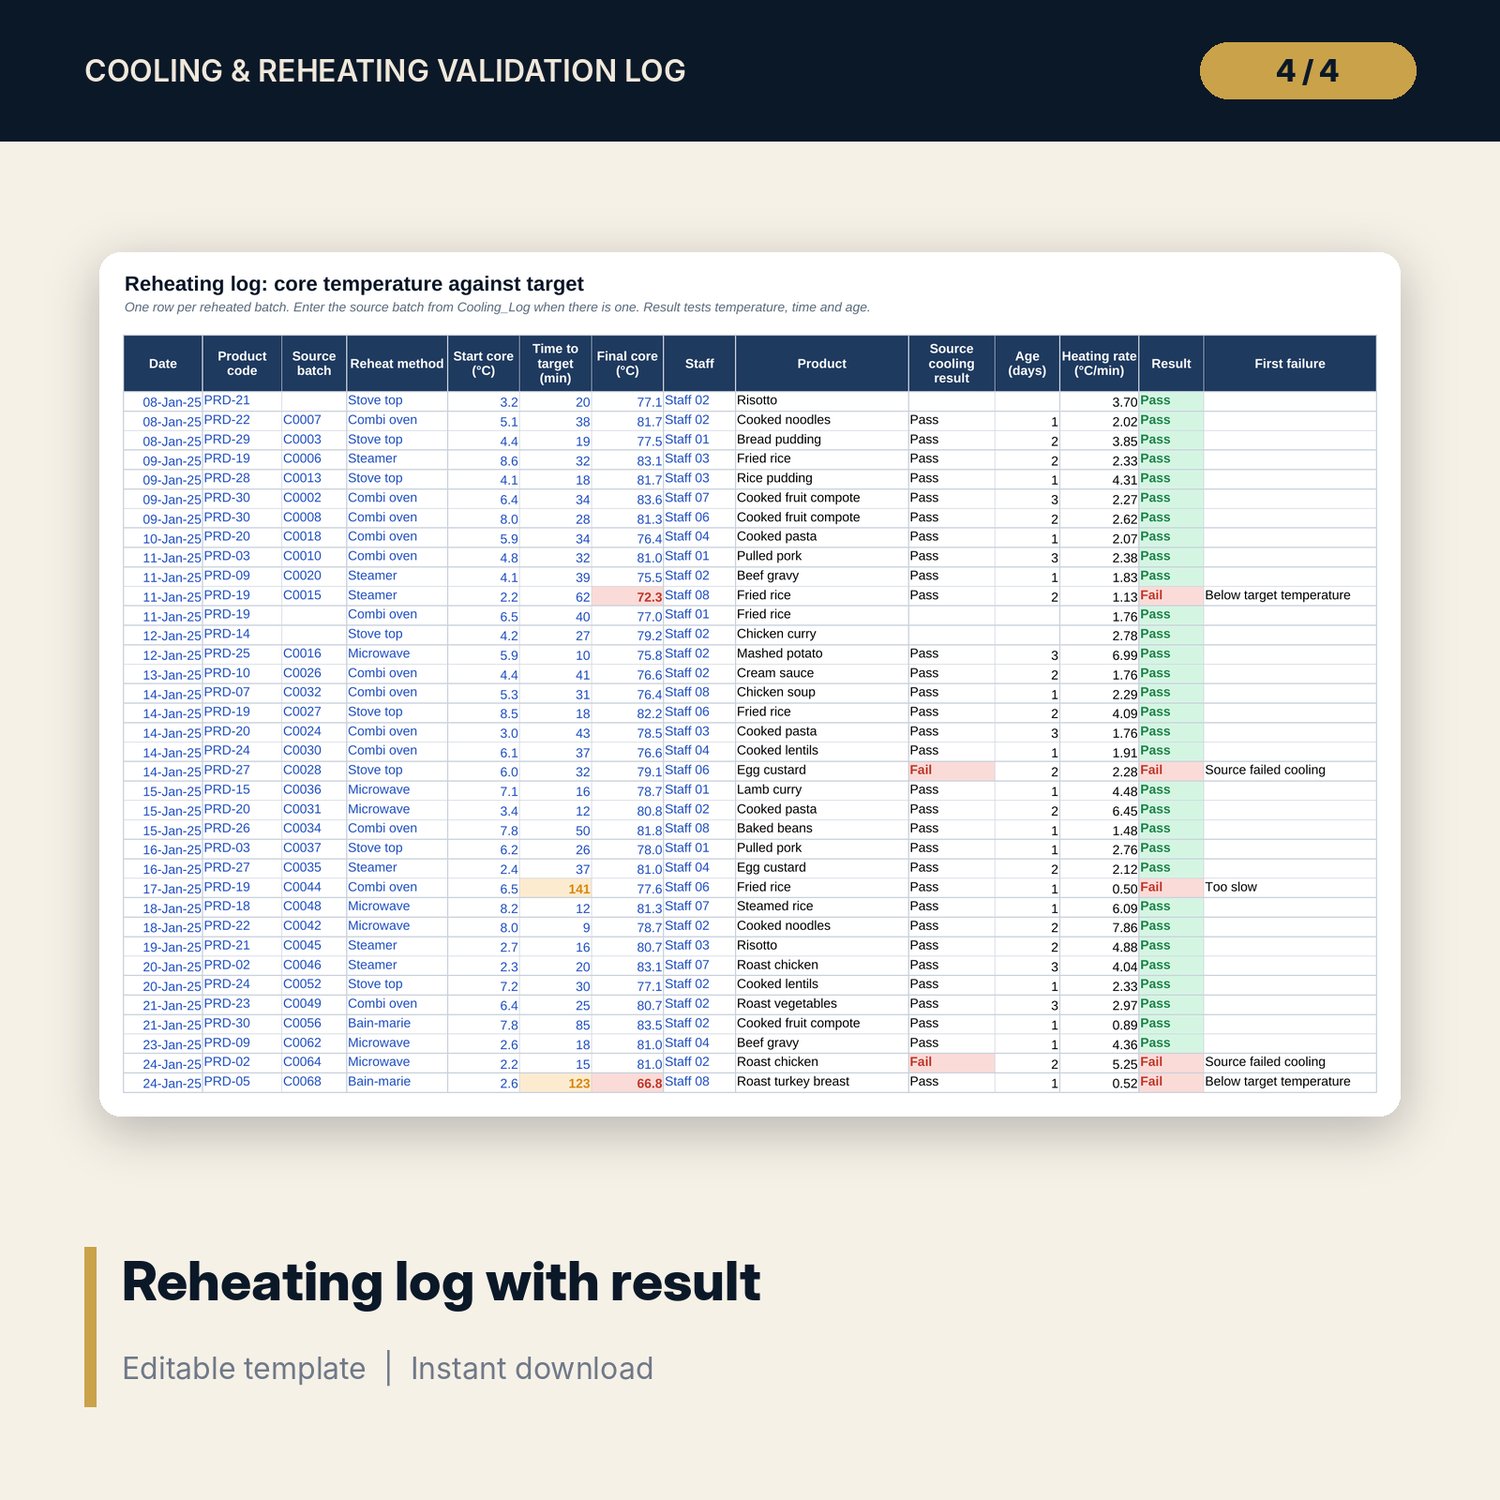
- Reheating_Log: 172 sample reheats (room for 250) with source batch, age, heating rate and result
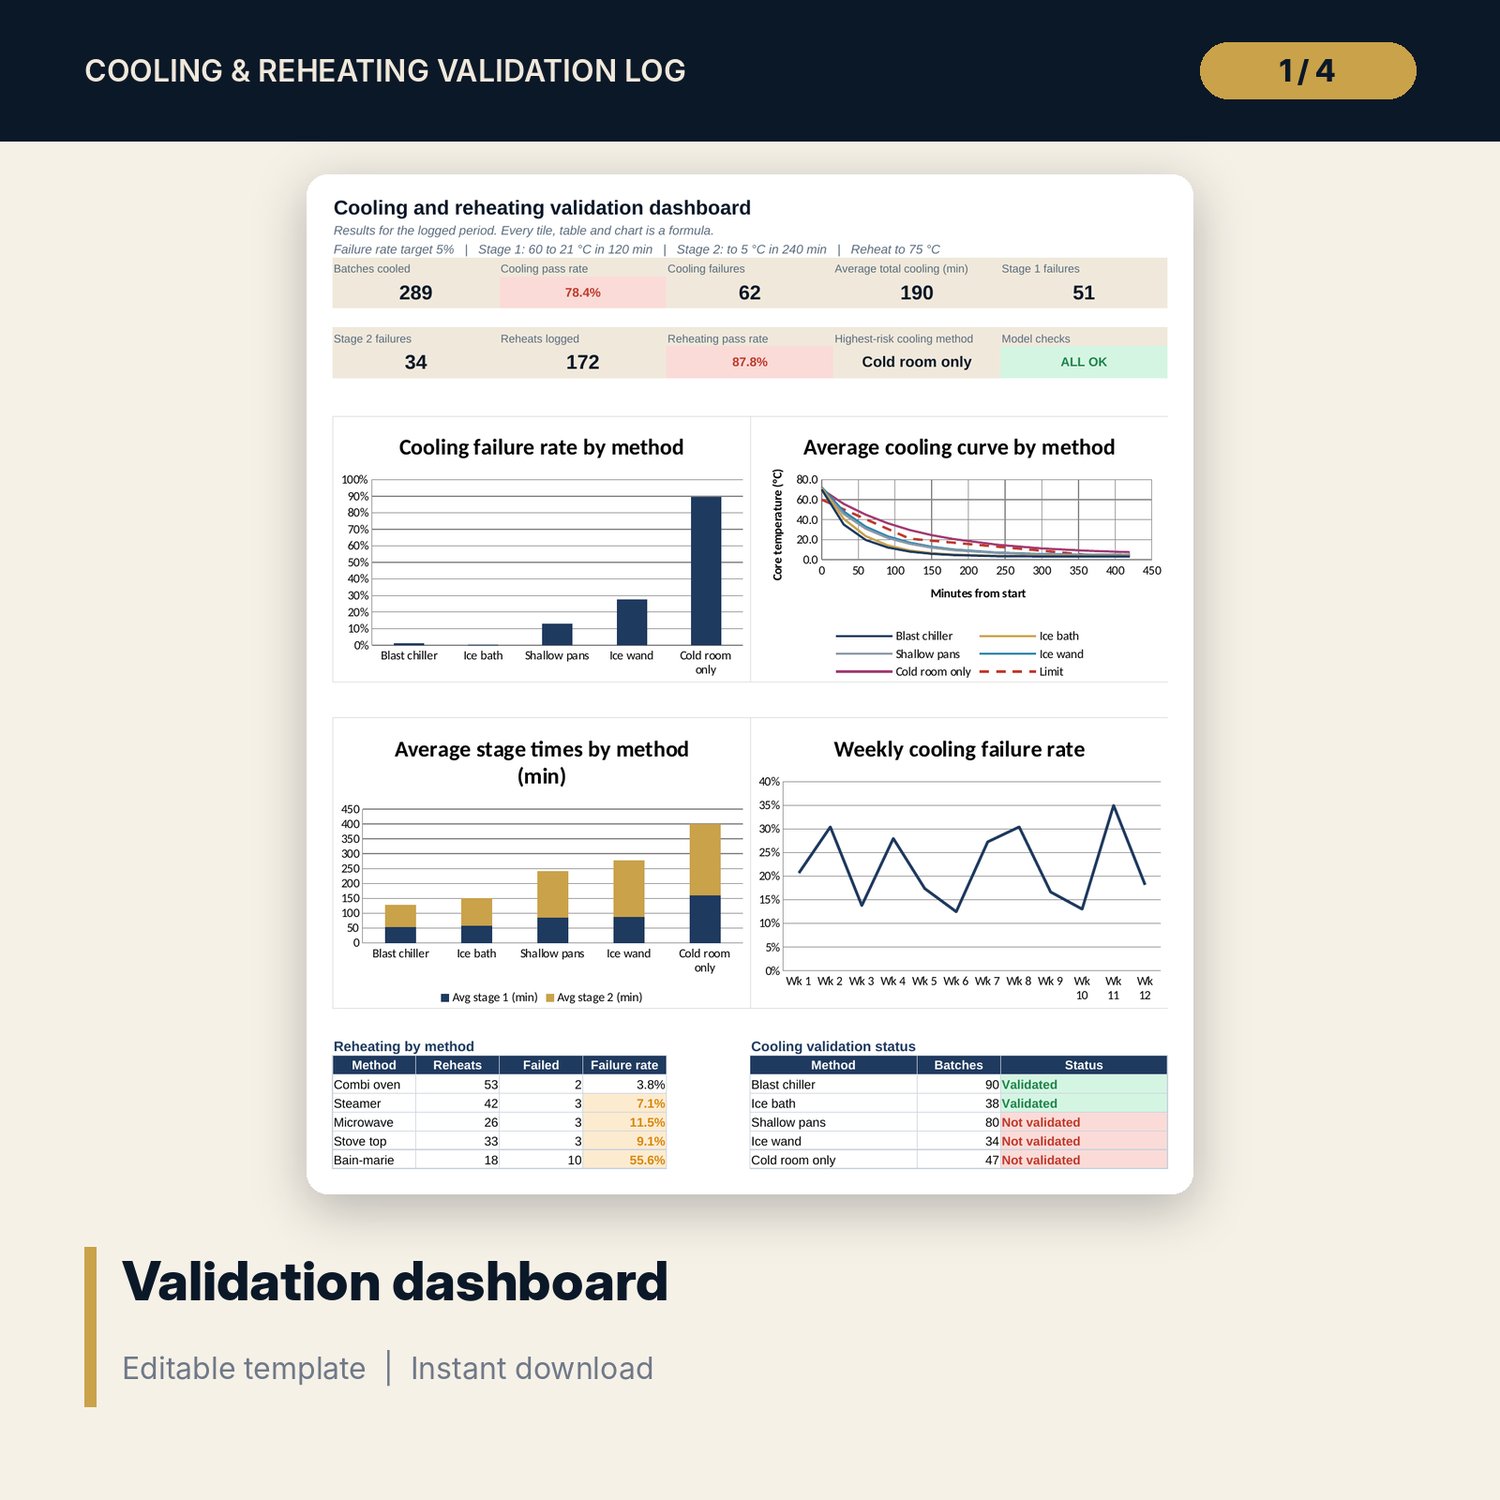
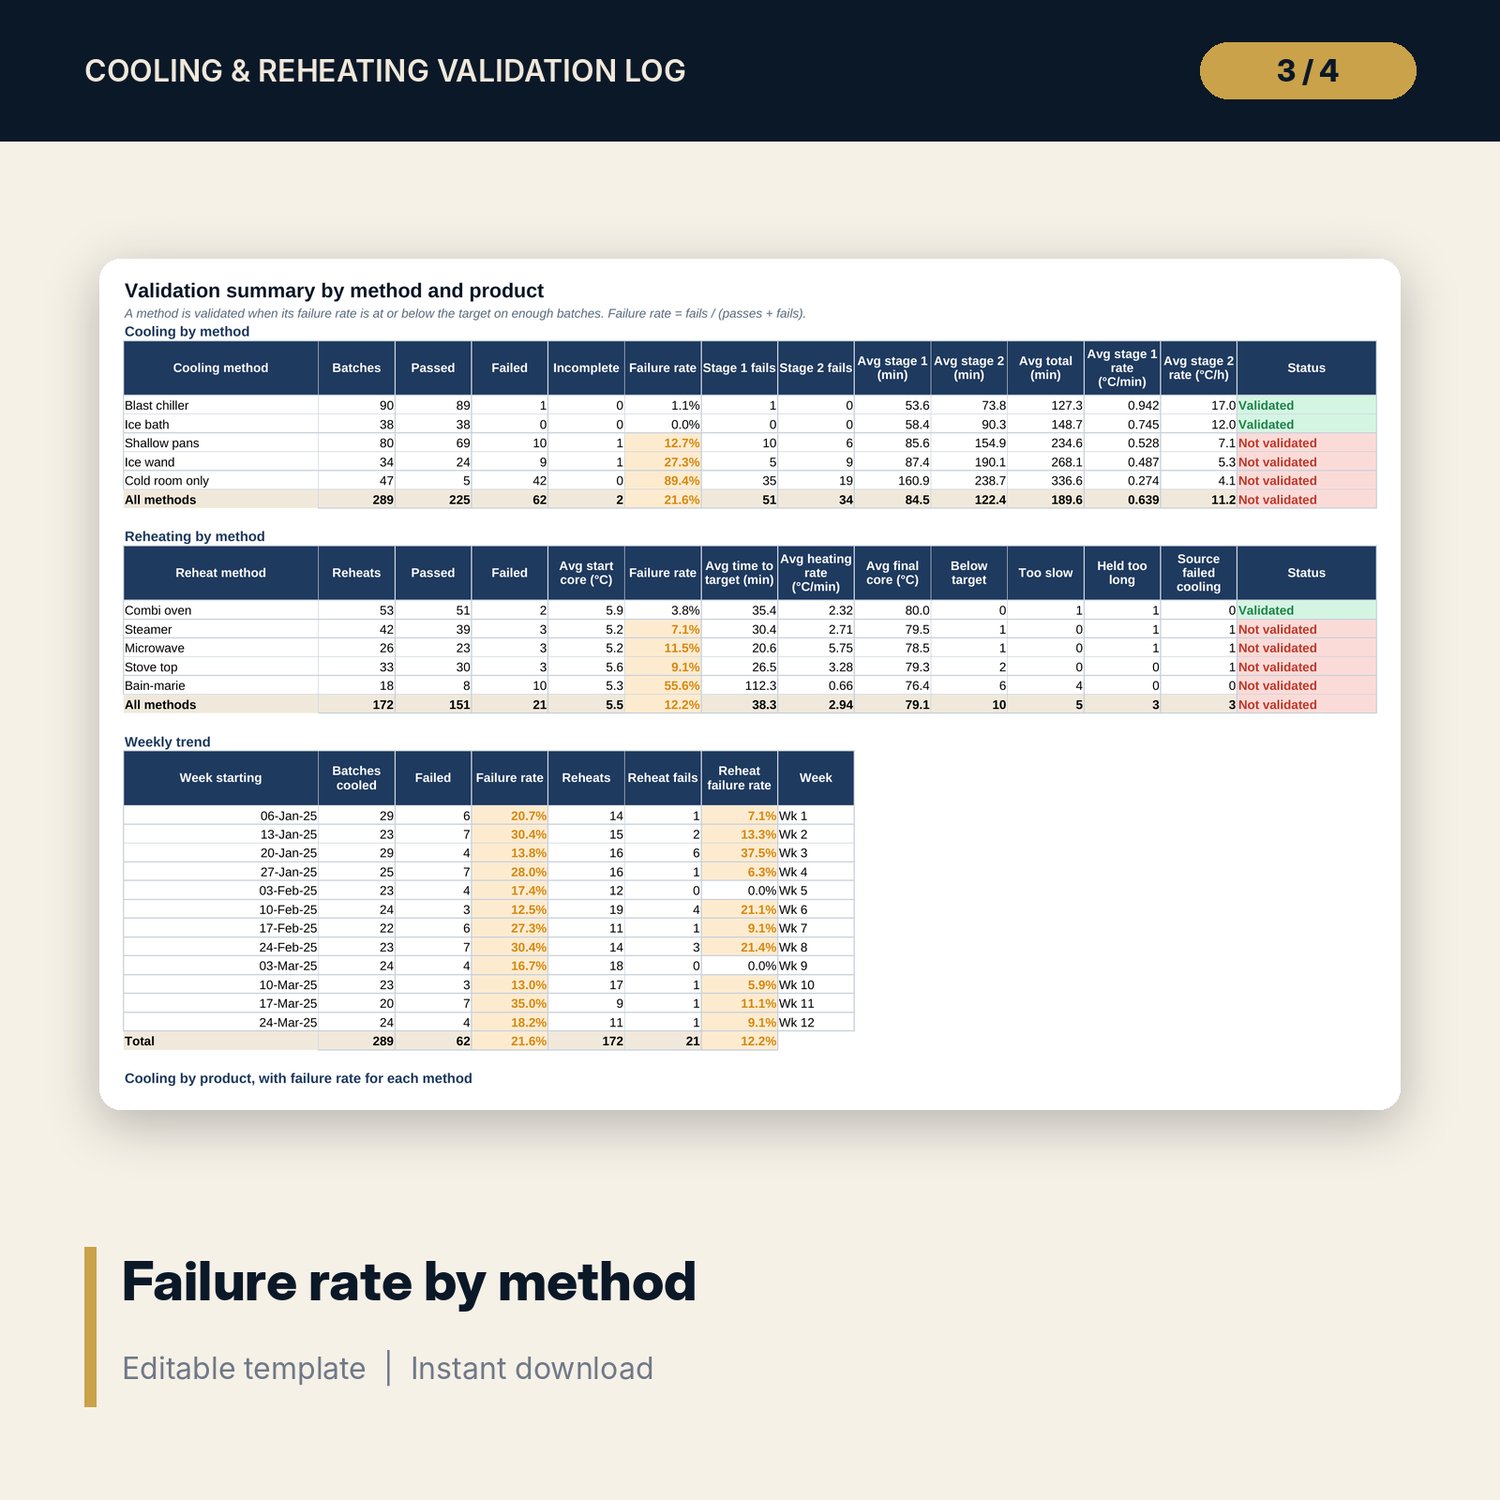
- Validation_Summary: failure rate by method, by product and by product and method, reheating by method, and a 12-week trend
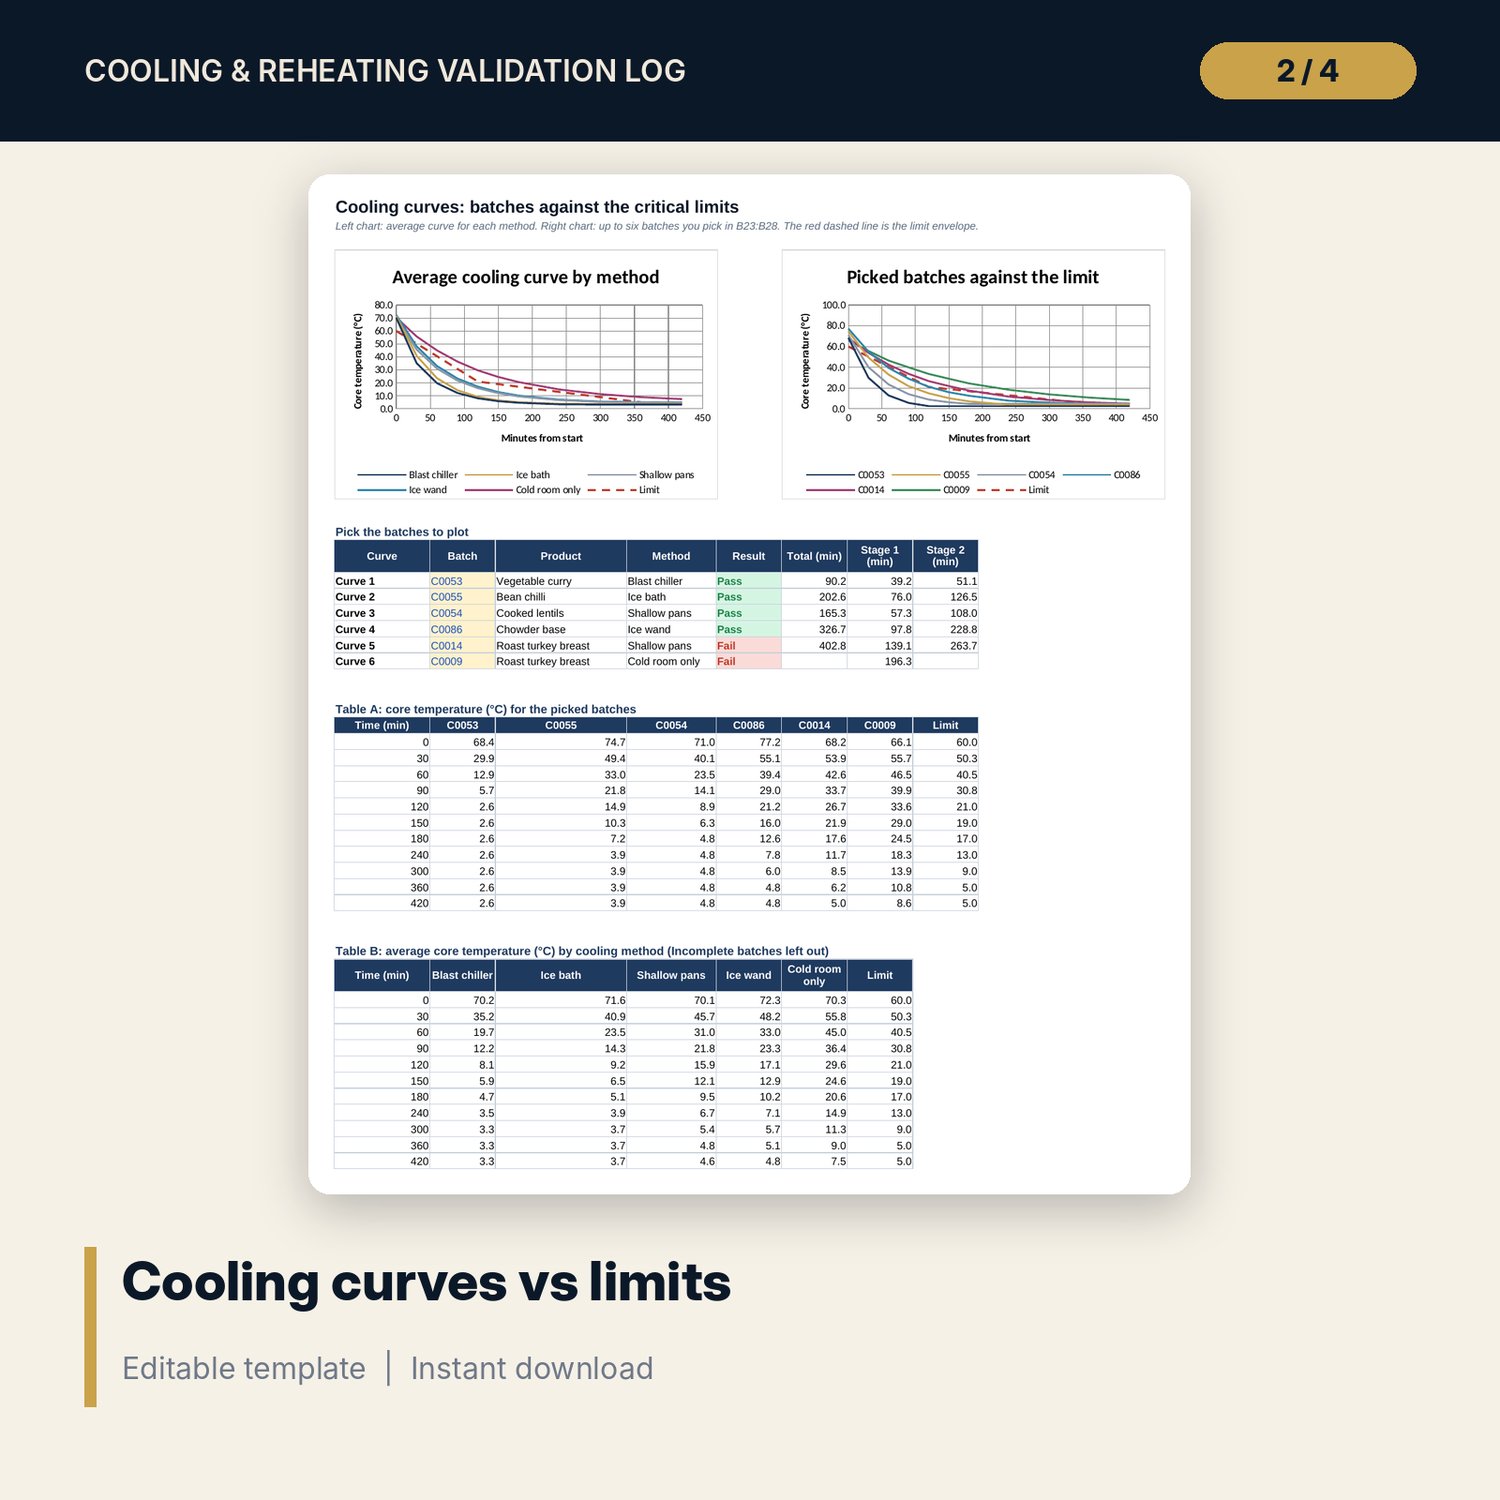
- Cooling_Curves: 2 native scatter charts, with 6 batches you pick. Dashboard: 9 KPI tiles, 4 native charts and 2 tables
- Checks with 13 integrity checks; Method with 16 documented results
- 14 drop-down and number validations; conditional formats for failed stages, slow reheats and over-age batches
- README.txt and LICENSE-and-Terms.txt
How it works
- On Settings, enter your cooling limits, reheating target and the minutes at which you take readings.
- Replace the sample products. Log each cooled batch with its readings. Cooling_Calc shows stage times, rates and the result.
- Log each reheat and name the source batch. Age and cooling result are tested for you.
- Read Validation_Summary to see which methods and products fail more often than your target.
- Pick batches on Cooling_Curves to see where a failing batch left the limit, and check the Dashboard.
Details
- Format: one Excel workbook (.xlsx). English. Metric units (°C, kg, cm, minutes).
- Software: Excel 2016 or later (Windows or Mac) or LibreOffice Calc. Opens in Google Sheets; chart styling may differ.
- No macros, no add-ins, no external links. Formulas only.
- Digital download. Nothing is shipped.
Good to know
- Sample data is illustrative. Replace it with your own readings.
- Limits, temperatures and times are editable placeholders. Verify local requirements and set them from your food safety plan.
- Times are interpolated between readings, so more frequent readings give a more accurate result.
- This workbook is a record-keeping and analysis tool. It is not food-safety advice.
- Single-user license. Do not redistribute.
FAQ
Can I change the cooling limits?
Yes. The start and end temperatures and the time for each stage are inputs on Settings. Set them from your own food code and verify local requirements.
How are the stage times calculated?
The workbook finds the two readings either side of each limit and interpolates a straight line between them. The Method tab shows the equation and the cells.
What does Incomplete mean?
A batch is Incomplete when it has not yet reached a limit and the time allowed has not run out. It becomes a fail once the limit time has passed.
Can I compare cooling methods?
Yes. Validation_Summary gives the failure rate, average stage times and average cooling rates for each method. Cooling_Curves plots the average curve for each one.
Does it need macros?
No. It uses standard formulas and works in Excel 2016 or later.