

Electrical Thermography & Switchboard Maintenance Log: infrared survey and switchboard maintenance log in Excel
Full description
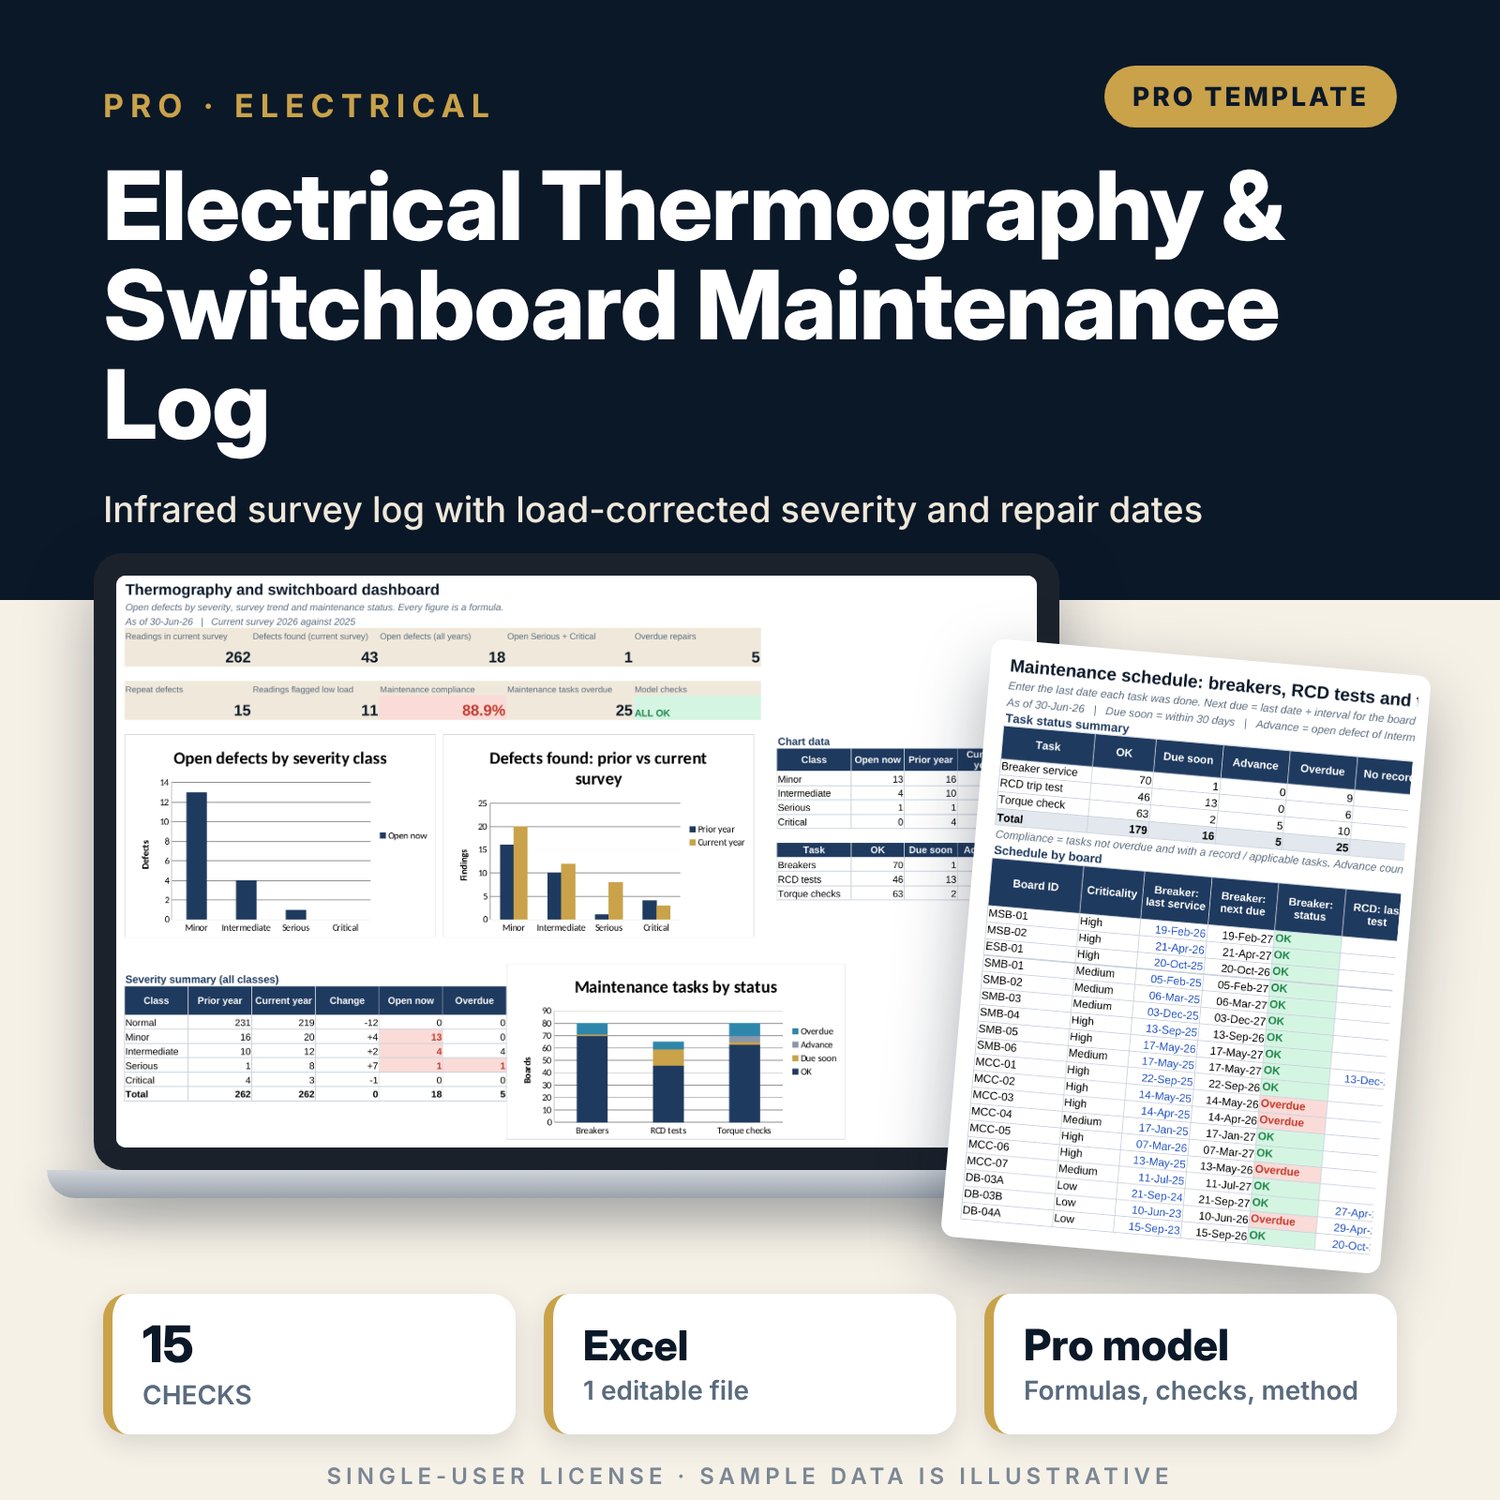
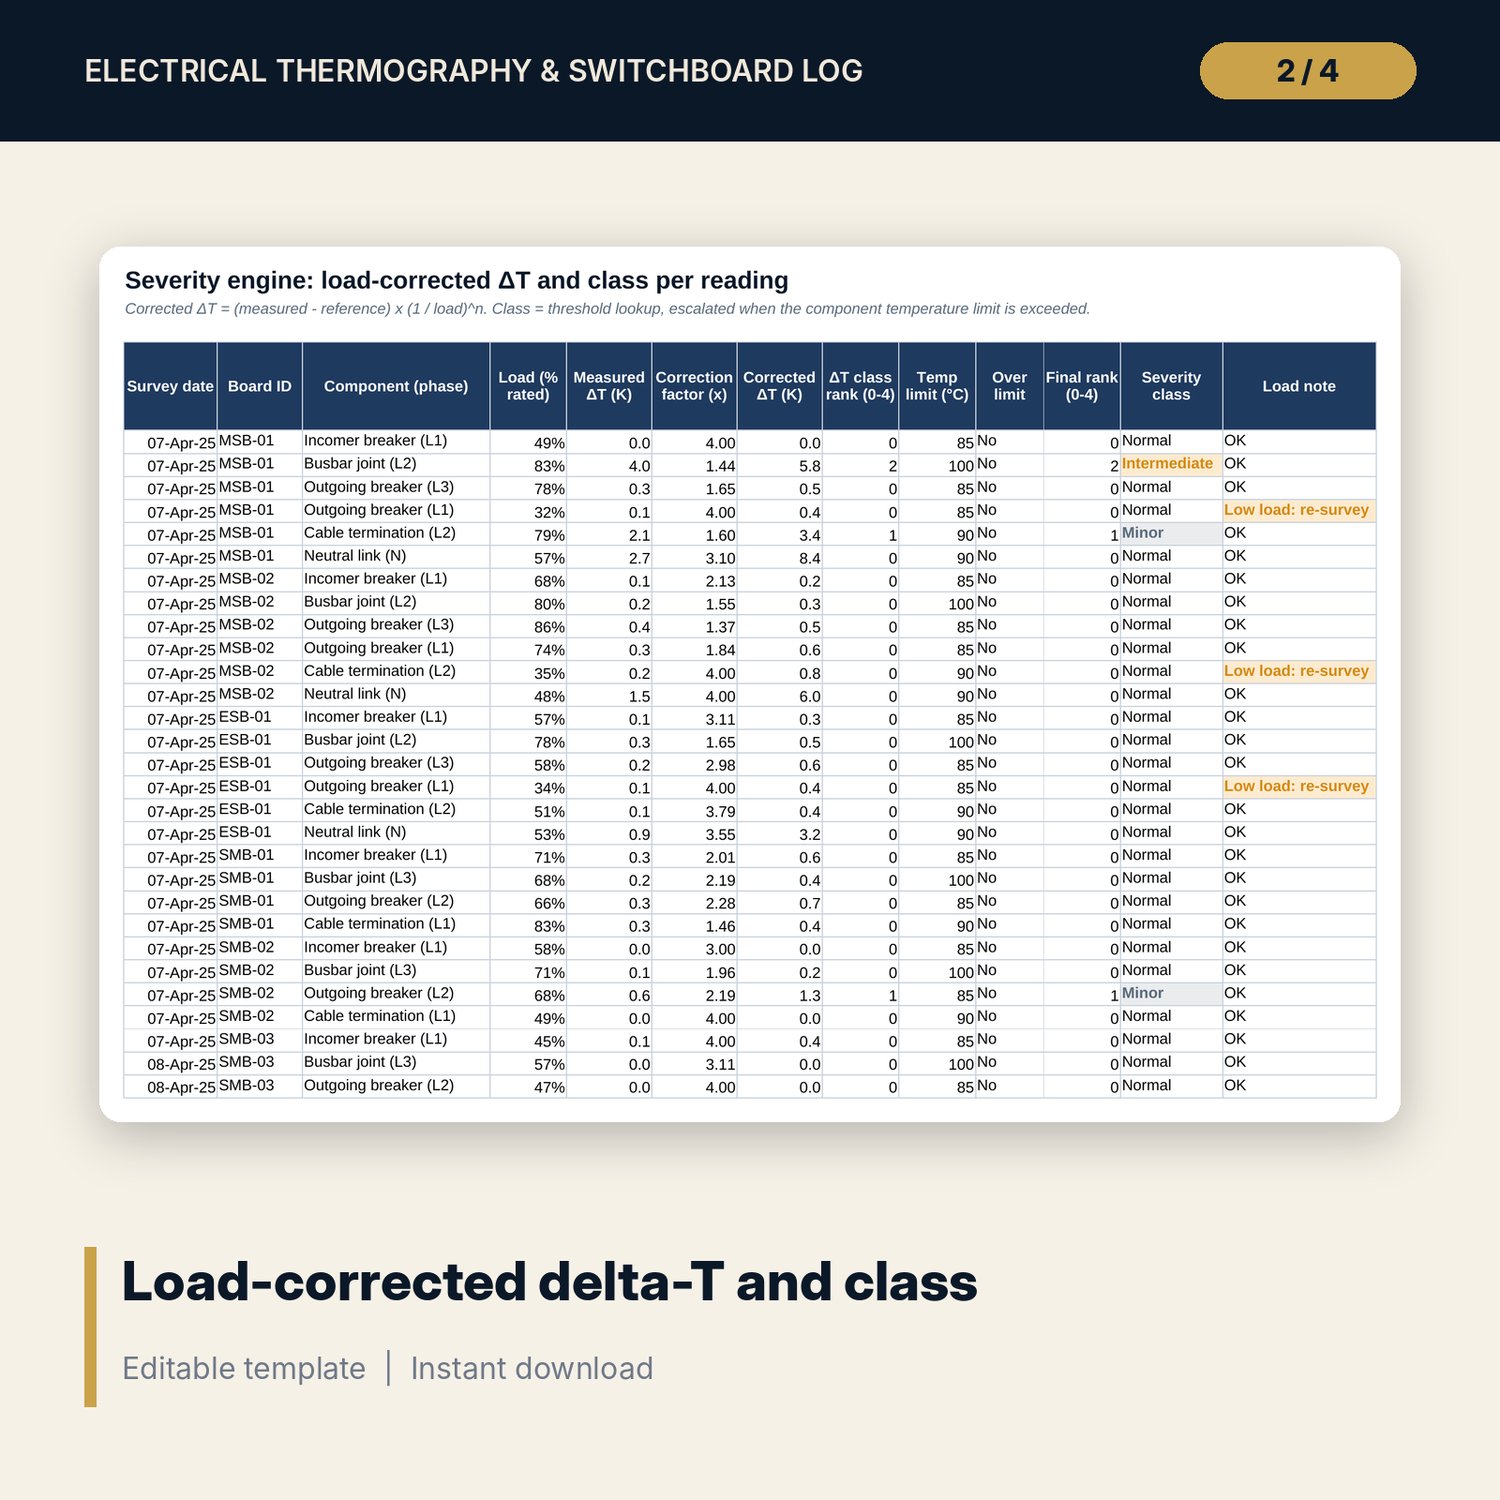
For chief engineers, electrical supervisors, engineering managers and the general managers and insurers' contacts who ask for proof that switchboards are under control. You keep a register of switchboards, motor control centres and distribution boards, then log each infrared survey reading: measured temperature, reference temperature (a similar component on another phase, or ambient), the current at the time and the rated current. The workbook calculates load %, measured delta-T and a load-corrected delta-T (measured delta-T x (1 / load)^n, with an editable exponent and cap), looks up the severity class from editable thresholds, and escalates any component above its temperature limit. Each defect gets a priority, a repair due date, an open or overdue flag and a repeat-defect flag when the same board, component and phase was a defect in an earlier survey. An action list sorts open defects by priority and due date, a comparison tab sets this year's survey against last year's board by board, and a schedule tracks breaker service, RCD tests and torque checks by board criticality.
Save with a bundle: this workbook is also in the Hotel Engineering & MEP Pro Bundle, 25 workbooks for $59 instead of $319. All 100 Pro workbooks are in the Pro Library for $119, and all 241 templates and workbooks are in the Ultimate Hospitality Library for $149.
What is inside
- Electrical_Thermography_Switchboard_Log.xlsx: 12 tabs, 29,352 formulas, 3 native charts, 15 integrity checks, 18-row Method tab
- Boards: register for up to 100 boards, with 80 illustrative boards (main, emergency, sub-main, motor control centres, distribution boards)
- Survey_Log: 1,000 rows, with 524 illustrative readings from two annual surveys (262 per survey)
- Survey_Calc engine: 13 columns per reading (load %, measured delta-T, correction factor, corrected delta-T, class rank, temperature limit, escalation, final class, load note)
- Defect_Status engine: 13 columns per reading (priority, repair due date, status, open flag, days to due, overdue, repeat defect, sort key)
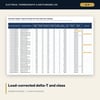
- Action_List: up to 50 open defects sorted by priority and due date, with a review sign-off line
- Survey_Compare: findings by severity class, by board type and board by board (mean corrected delta-T, worst class, trend)
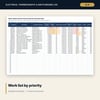
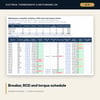
- Maint_Schedule: breaker service, RCD test and torque check due dates and status for every board, with a compliance summary
- Settings: 8 editable inputs with units, 5 severity classes, 9 component temperature limits, 3 x 3 maintenance interval table, 6 x 8 load correction grid
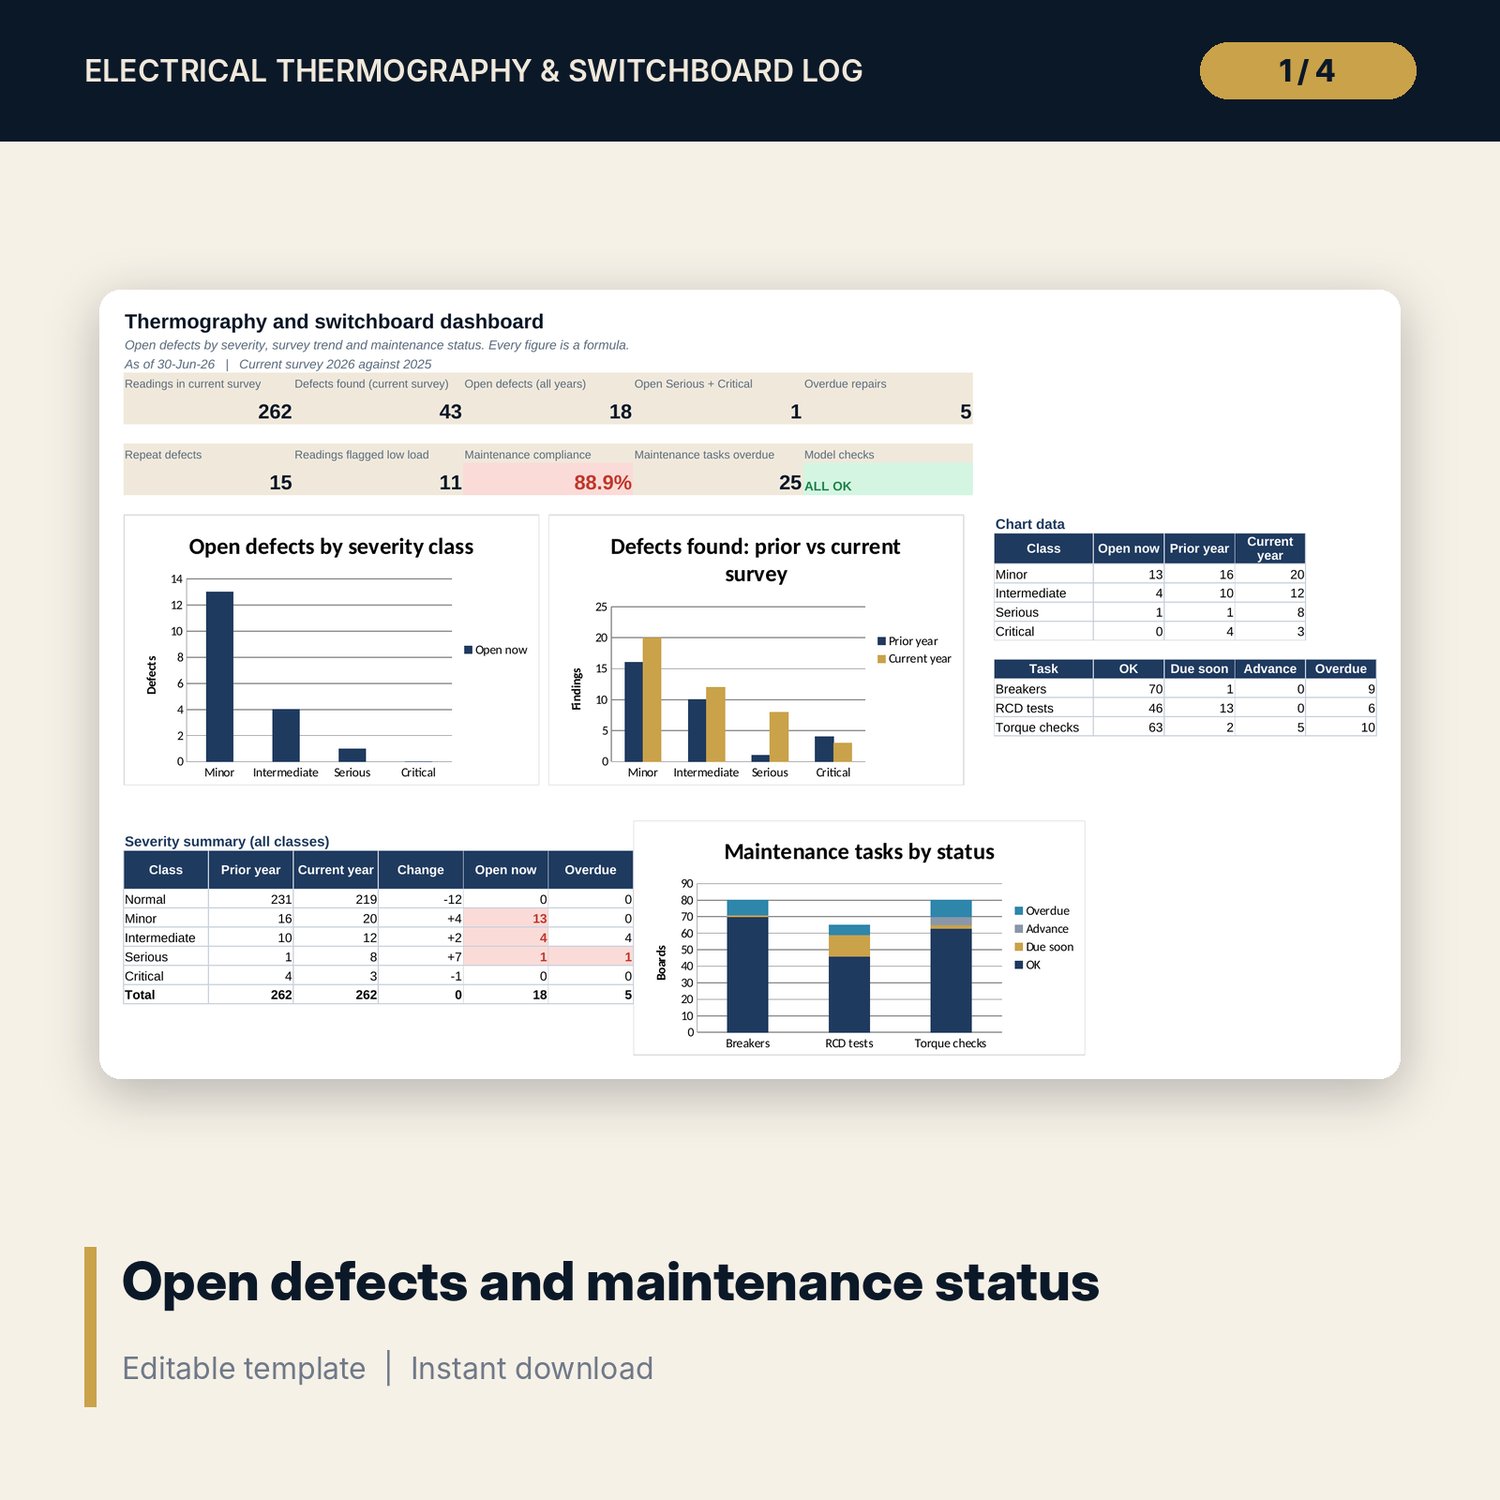
- Dashboard: 9 KPI tiles, check status, 3 charts and a severity summary on one page
- README.txt and LICENSE-and-Terms.txt
How it works
- Set the current survey year, the as-of date, the load correction exponent, thresholds, temperature limits and maintenance intervals on Settings.
- Enter your boards on Boards, then log each survey reading on Survey_Log with both temperatures and both currents.
- Read the severity class on Survey_Calc, set a status for each defect and add the repair date when it is fixed.
- Print Action_List for the repair team and review repeat defects and trends on Survey_Compare.
- Enter the last maintenance dates on Maint_Schedule and track compliance and open defects on the Dashboard.
Details
- Format: one XLSX workbook
- Language: English
- Units: °C, K for temperature differences, A for current
- Software: Excel 2016 or later (Windows or Mac) or LibreOffice Calc; also opens in Google Sheets, where chart styling may differ
- No macros, no array formulas, no external links
- Delivery: instant download
Good to know
- Sample data is illustrative. Replace it with your own register and readings.
- This is a record and planning tool, not engineering advice or an inspection certificate. Results depend on camera settings, emissivity and the load at the time of the survey.
- Severity thresholds, component temperature limits and maintenance intervals are editable inputs. Verify local requirements, your insurer's requirements and the manufacturer data.
- Infrared surveys of live equipment need trained, authorised staff and the right protective equipment.
- Single-user license.
FAQ
Why correct the delta-T for load?
Heat in a loose or dirty joint follows I²R. A joint surveyed at 50% load shows about a quarter of its full-load rise, so the raw reading understates the risk. The workbook scales it to 100% load with an exponent you can change.
What if the load is very low on the survey day?
Readings below the minimum load (40% by default) are flagged for a re-survey at peak load, and the correction factor is capped so a tiny reading is not blown up into a false alarm.
Can I use my insurer's or my own severity table?
Yes. Change the delta-T thresholds for similar-component and ambient references, the priority labels and the repair days on Settings. Every class, due date and count updates.
How is a repeat defect defined?
A defect is a repeat when the same board, component and phase was a defect (Minor or above) in an earlier survey. It points to a repair that did not hold.
Does it handle more than two surveys?
Yes. The log holds 1,000 readings across any number of surveys. Survey_Compare sets the current survey year against the year before; change the year on Settings to compare other years.