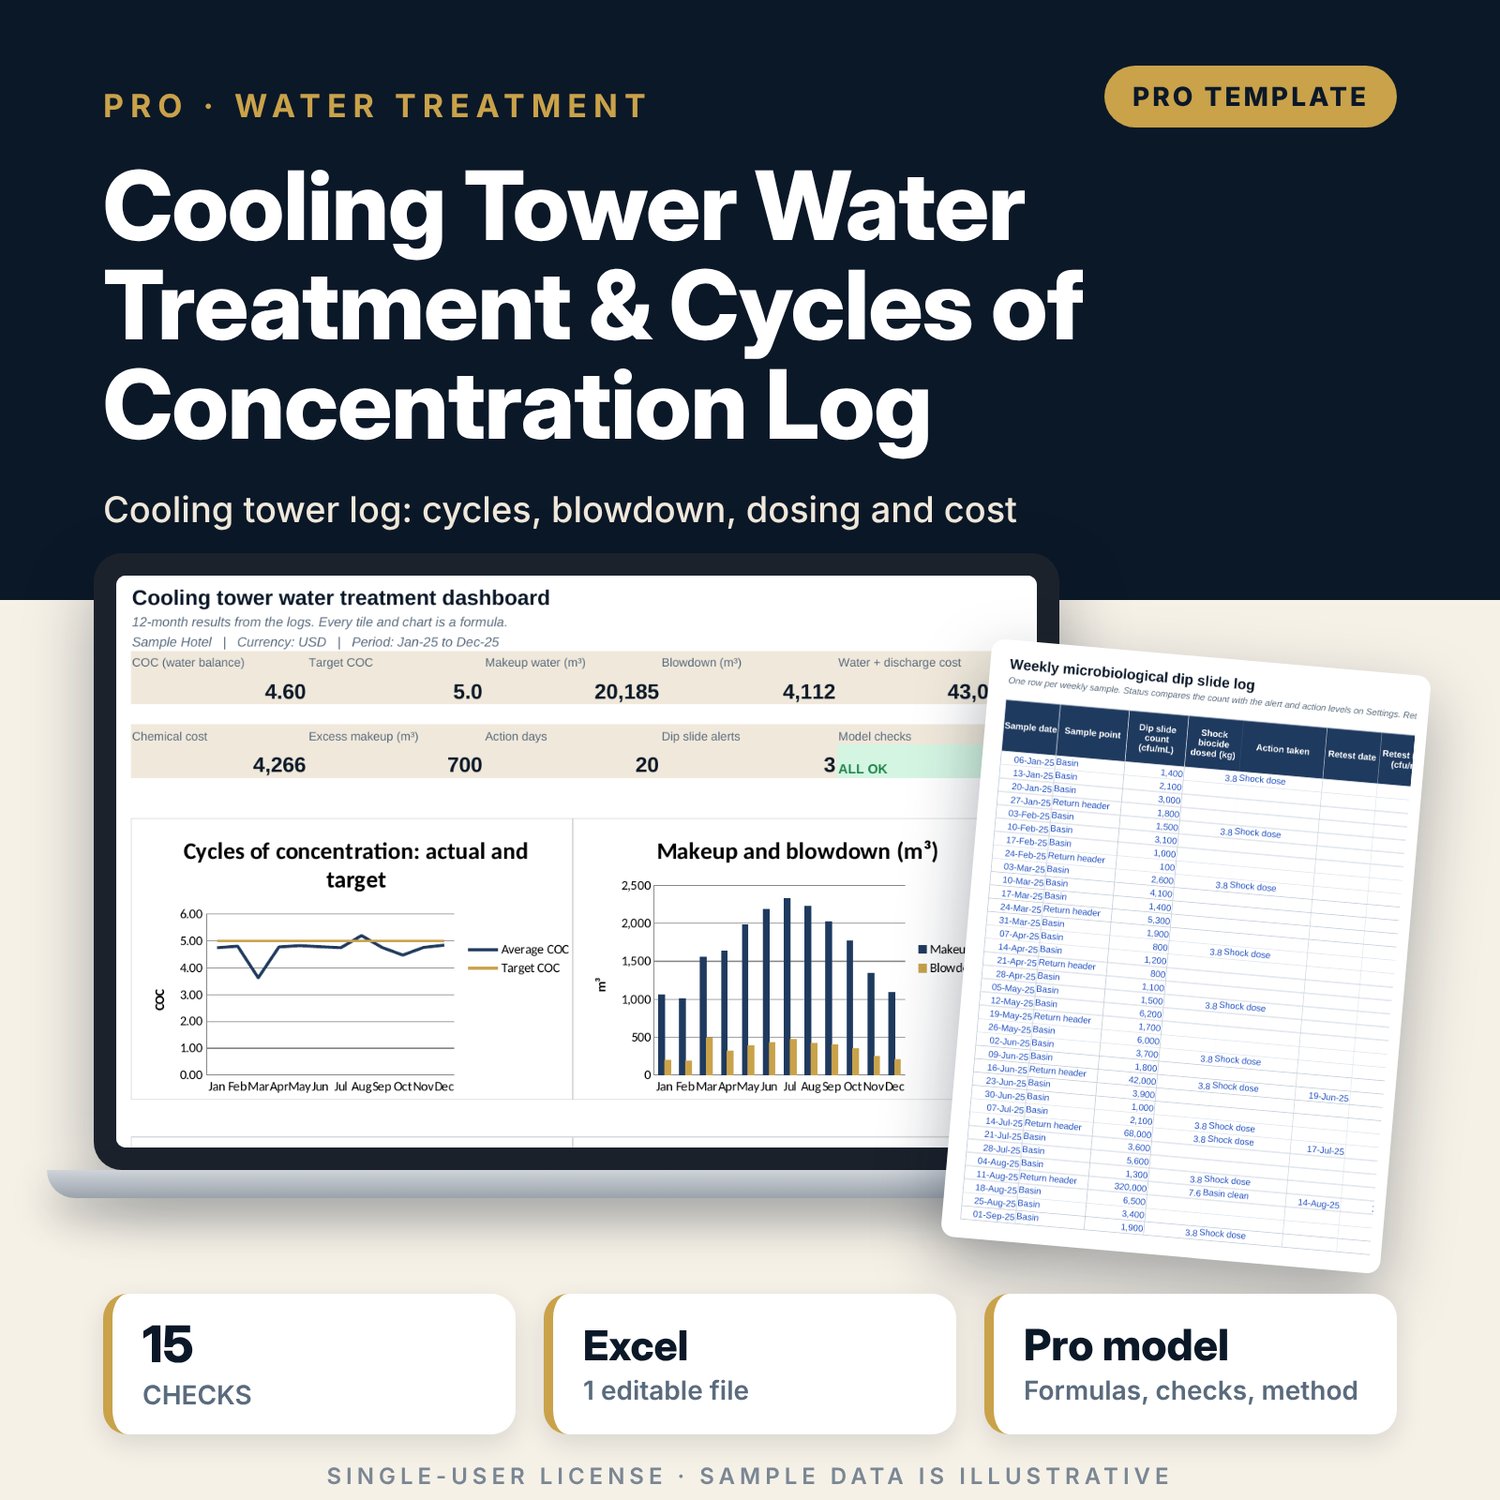
Cooling Tower Water Treatment & Cycles of Concentration Log: cooling tower water treatment log in Excel
Full description
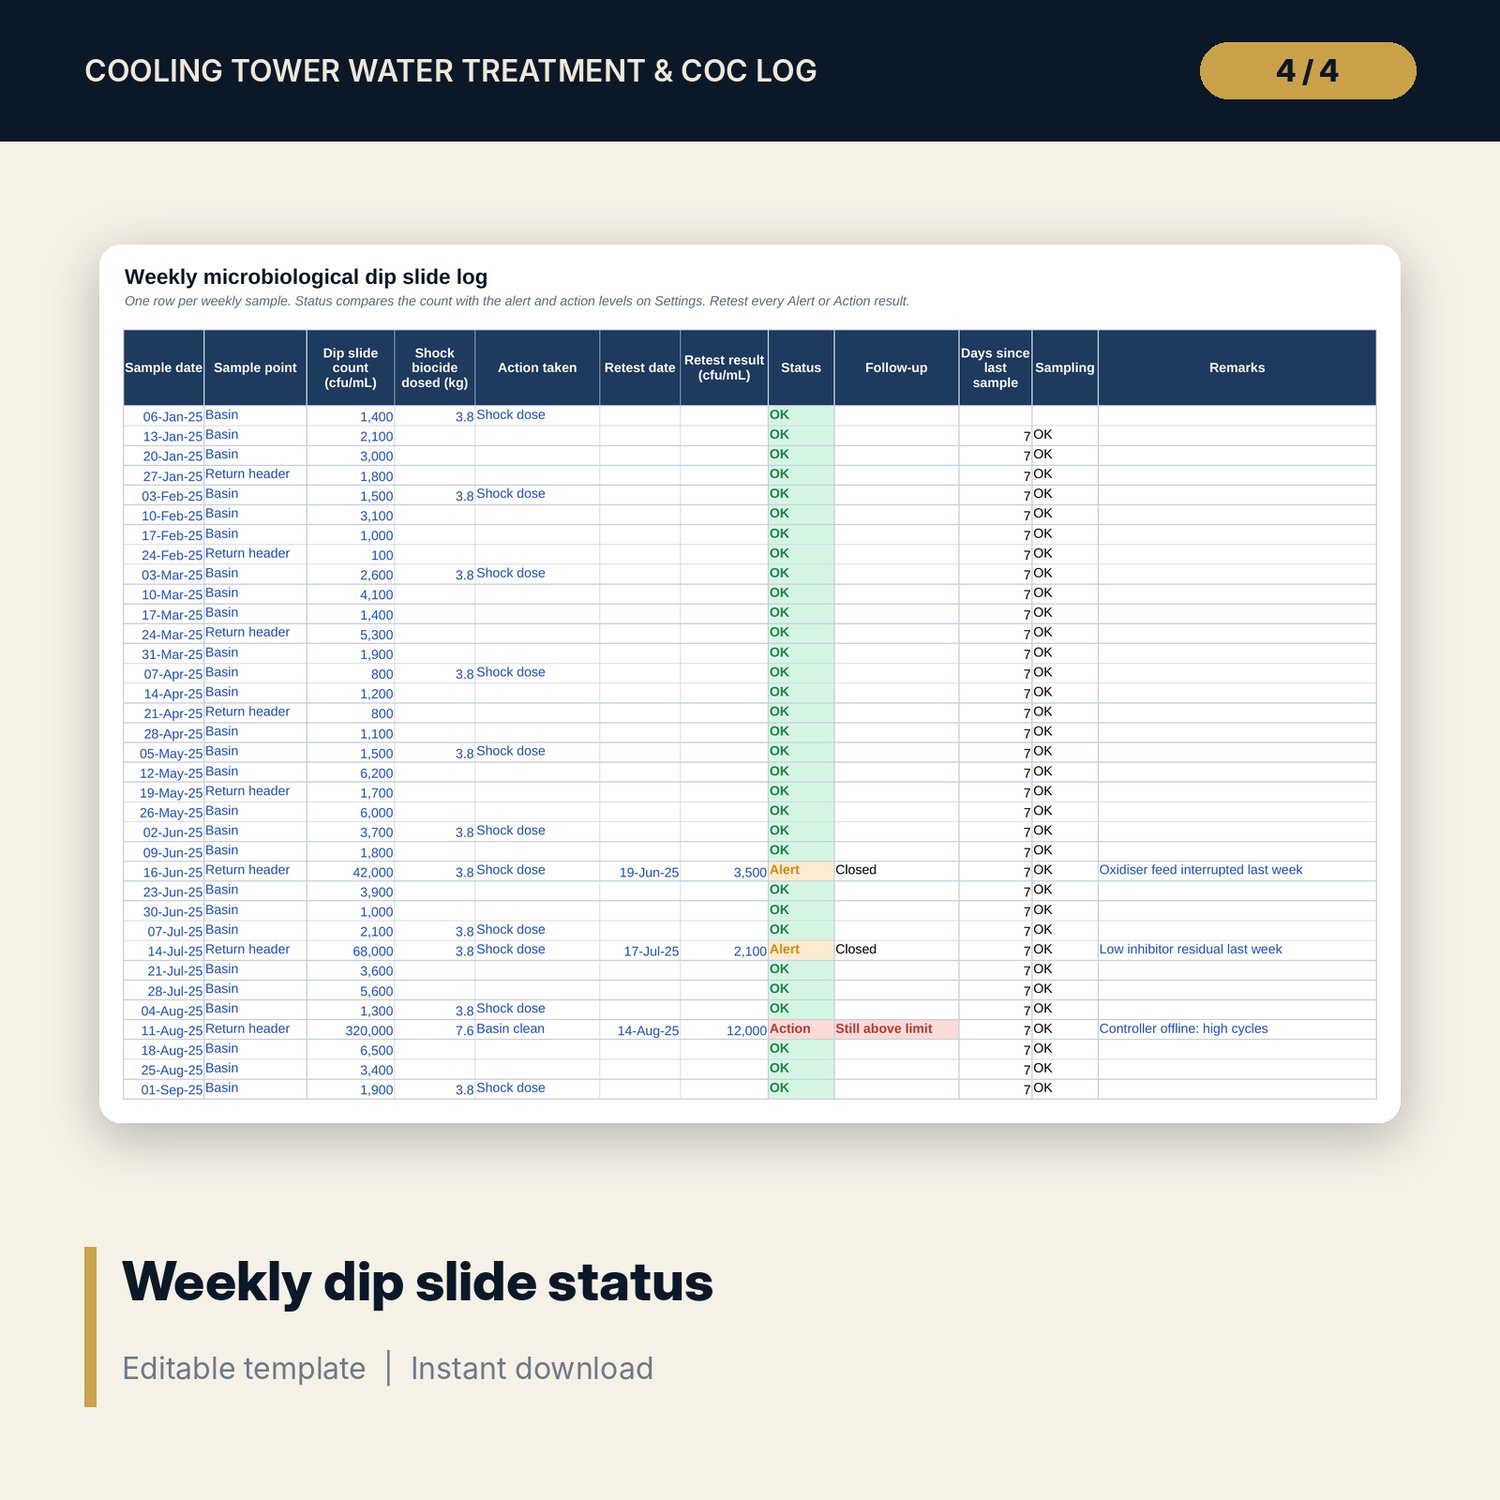
For chief engineers, engineering managers, general managers and water treatment coordinators who run a cooling tower and need to show that it is metered and treated correctly. The workbook logs daily meters, conductivity, pH, temperatures, load, residuals and chemical doses, then calculates evaporation from heat load, drift, cycles of concentration by conductivity and by water balance, the blowdown and makeup needed at your target cycles, the inhibitor quantity for your ppm target, and water and chemical cost. 9 flags per day check conductivity, pH, inhibitor and oxidiser residuals, basin temperature, meters, cycles and dosing against limits you set. A weekly dip slide log tracks alert and action levels, shock doses and retests. A savings model prices higher cycles of concentration and shows where the conductivity limit stops you.
Save with a bundle: this workbook is also in the Hotel Engineering & MEP Pro Bundle, 25 workbooks for $59 instead of $319. All 100 Pro workbooks are in the Pro Library for $119, and all 241 templates and workbooks are in the Ultimate Hospitality Library for $149.
What is inside
- Cooling_Tower_Water_Treatment_Log.xlsx: 12 tabs, 17,885 formulas, 6 native charts, 15 integrity checks, 18-row Method tab
- Daily_Log: 400 rows (365 sample days), 15 columns, limit breaches shaded on the input cells
- Water_Calc (18 columns), Dosing_Cost (13 columns) and Limit_Flags (12 columns): engine tabs with one column per step and 400 rows each
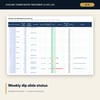
- Micro_Log: 60 rows (51 sample weekly dip slides) with status, follow-up and late-sample flag
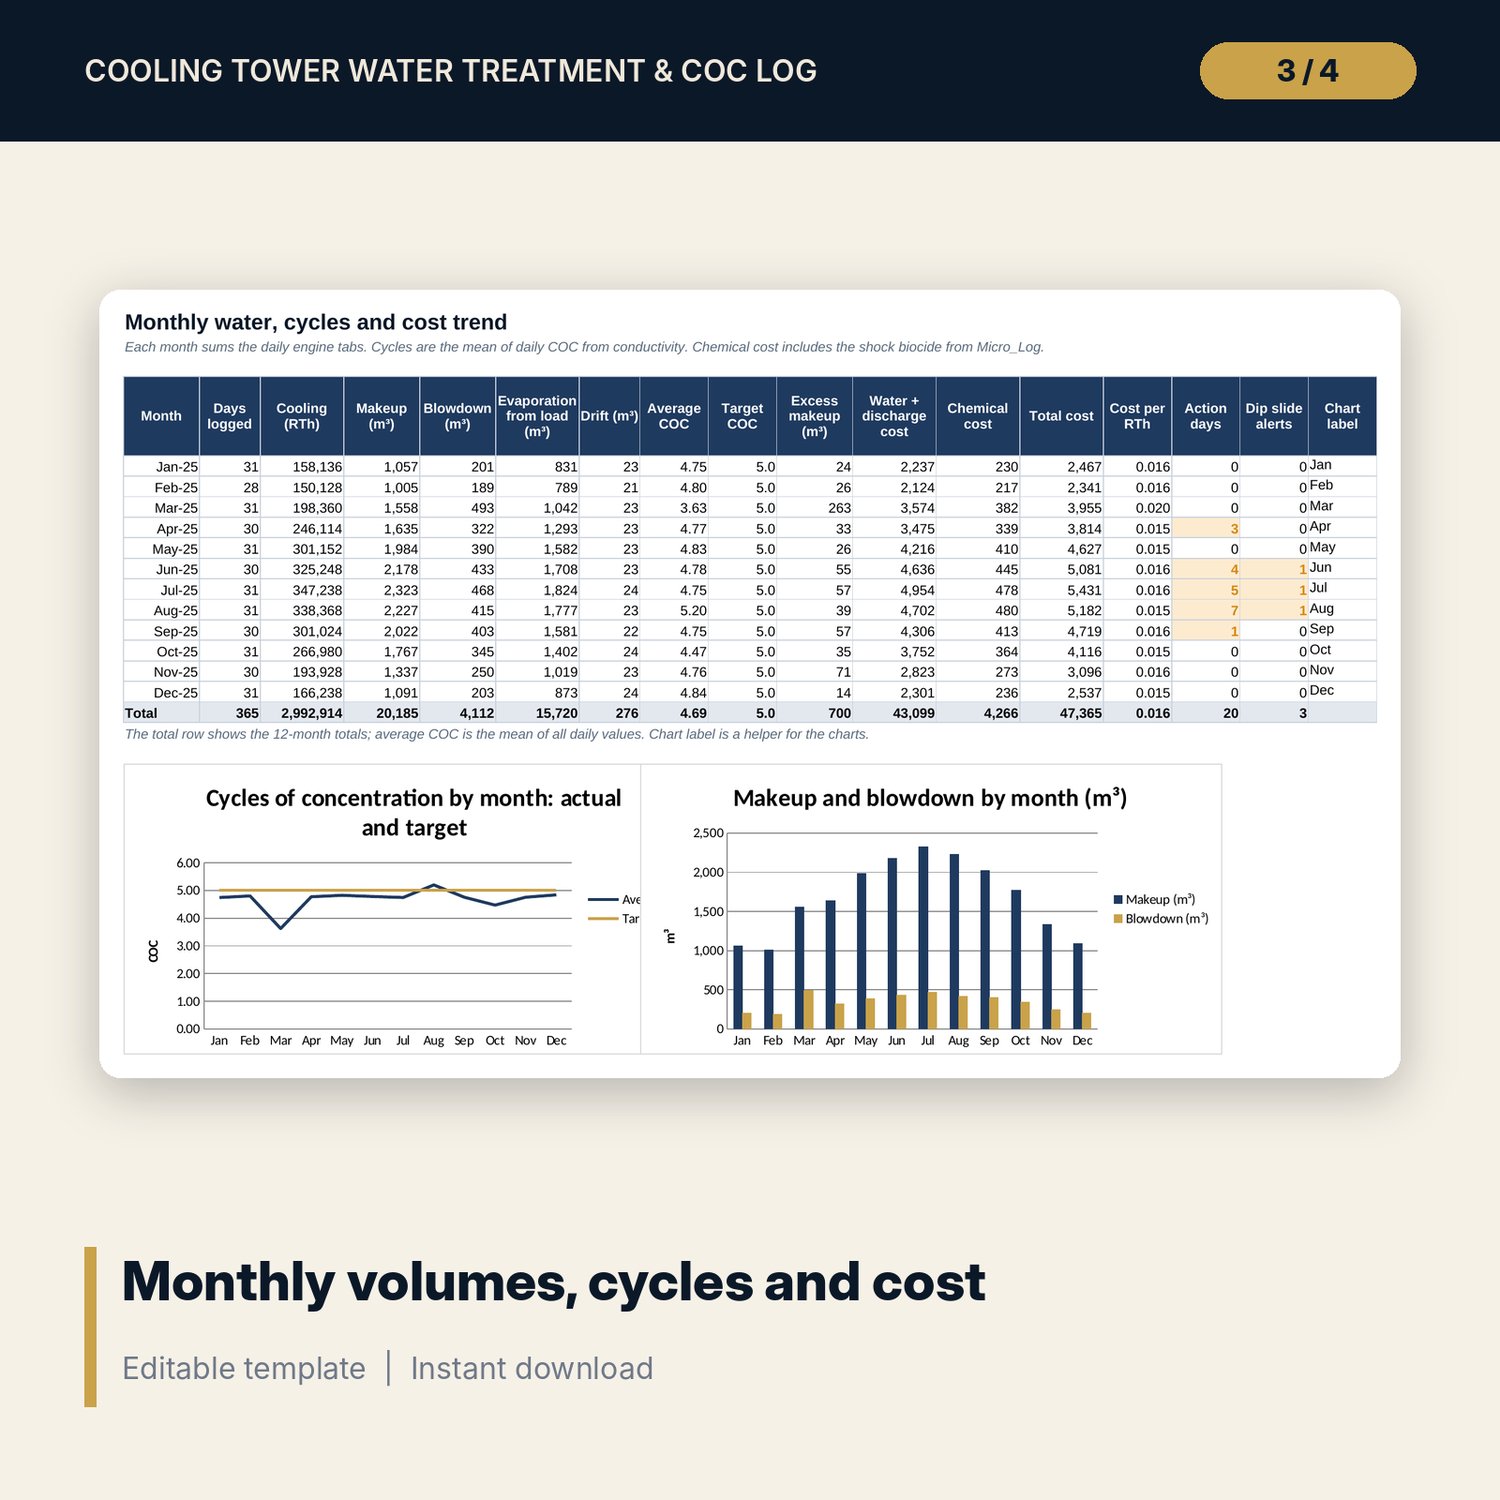
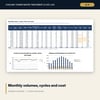
- Monthly_Trend: 12 months of volumes, cycles, cost, action days and alerts, with 2 charts
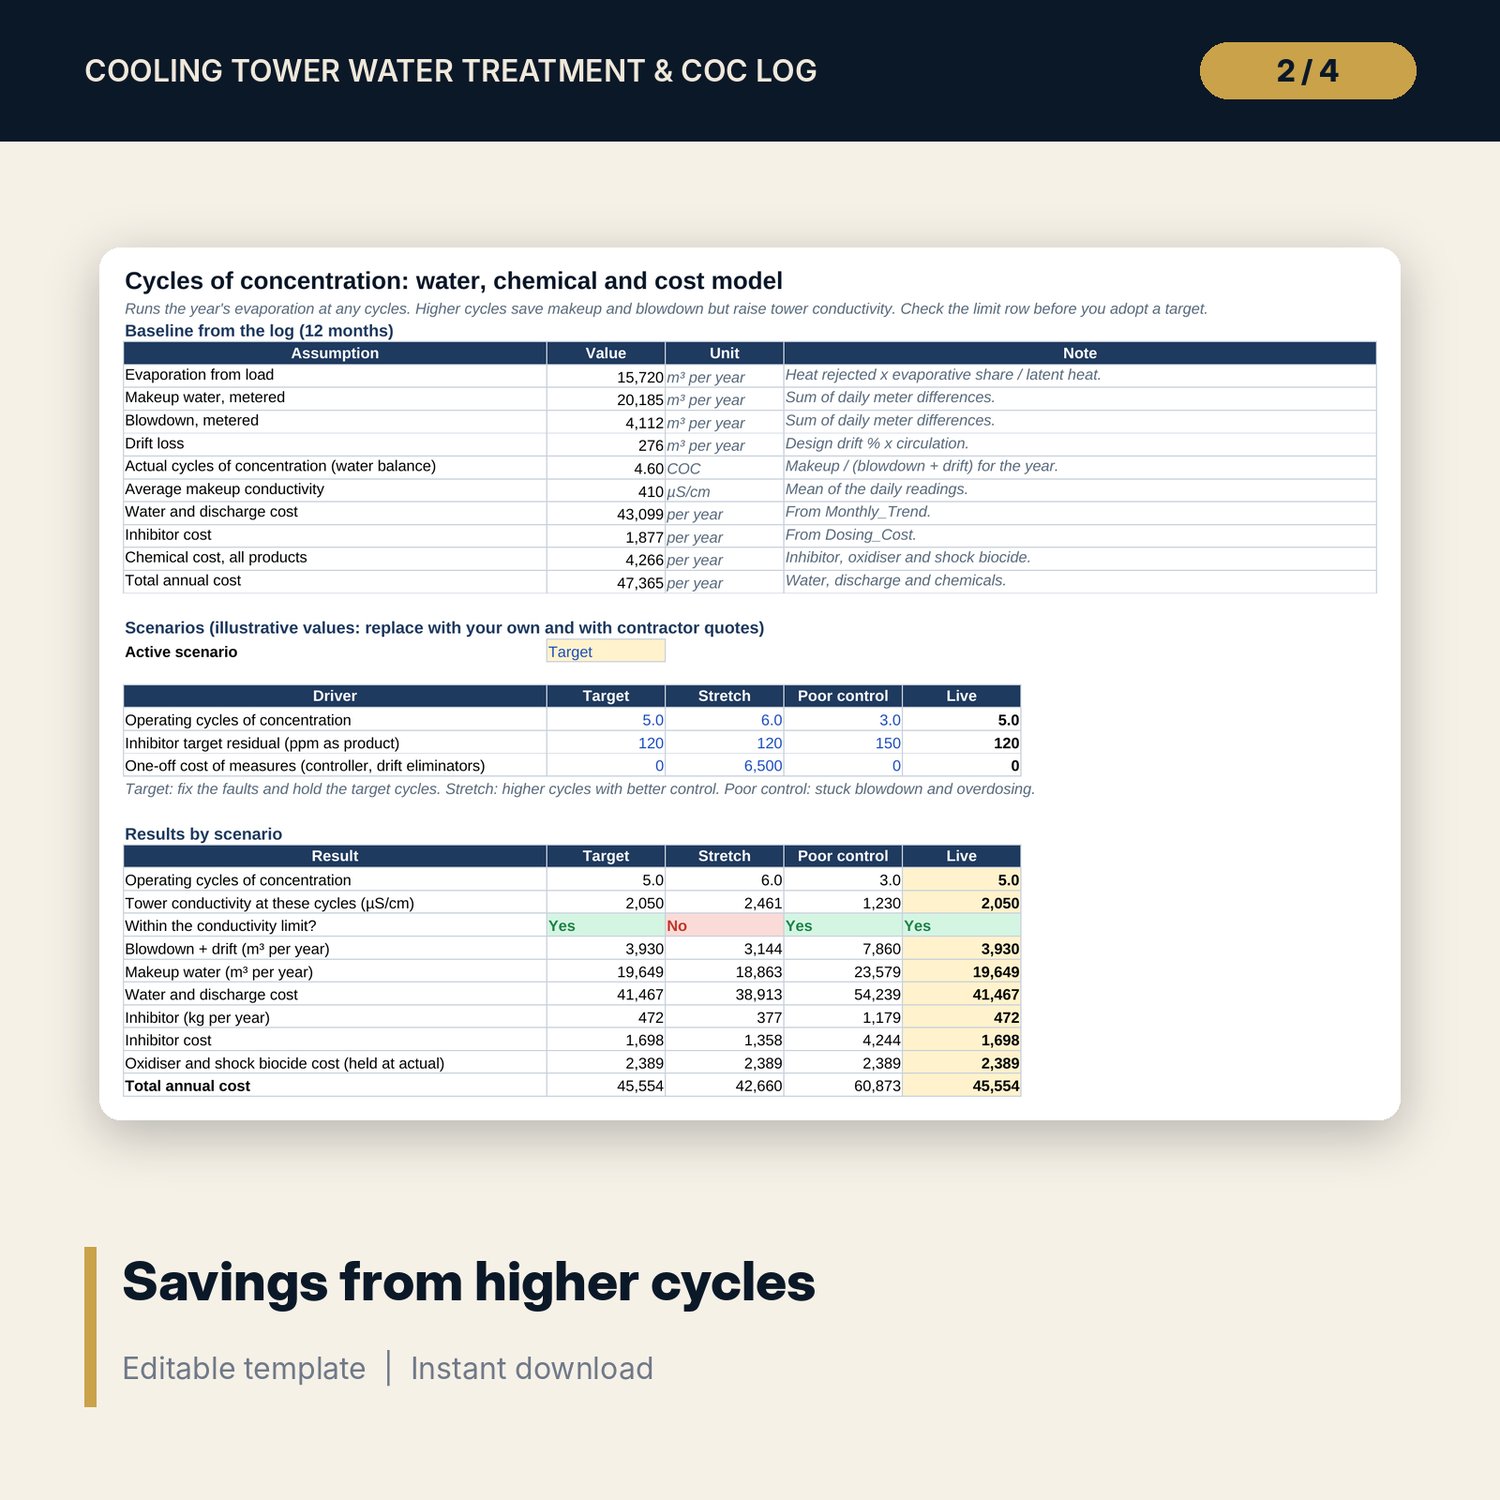
- COC_Savings: 3 scenarios, a cycles ladder of 8 levels and 2 sensitivity grids
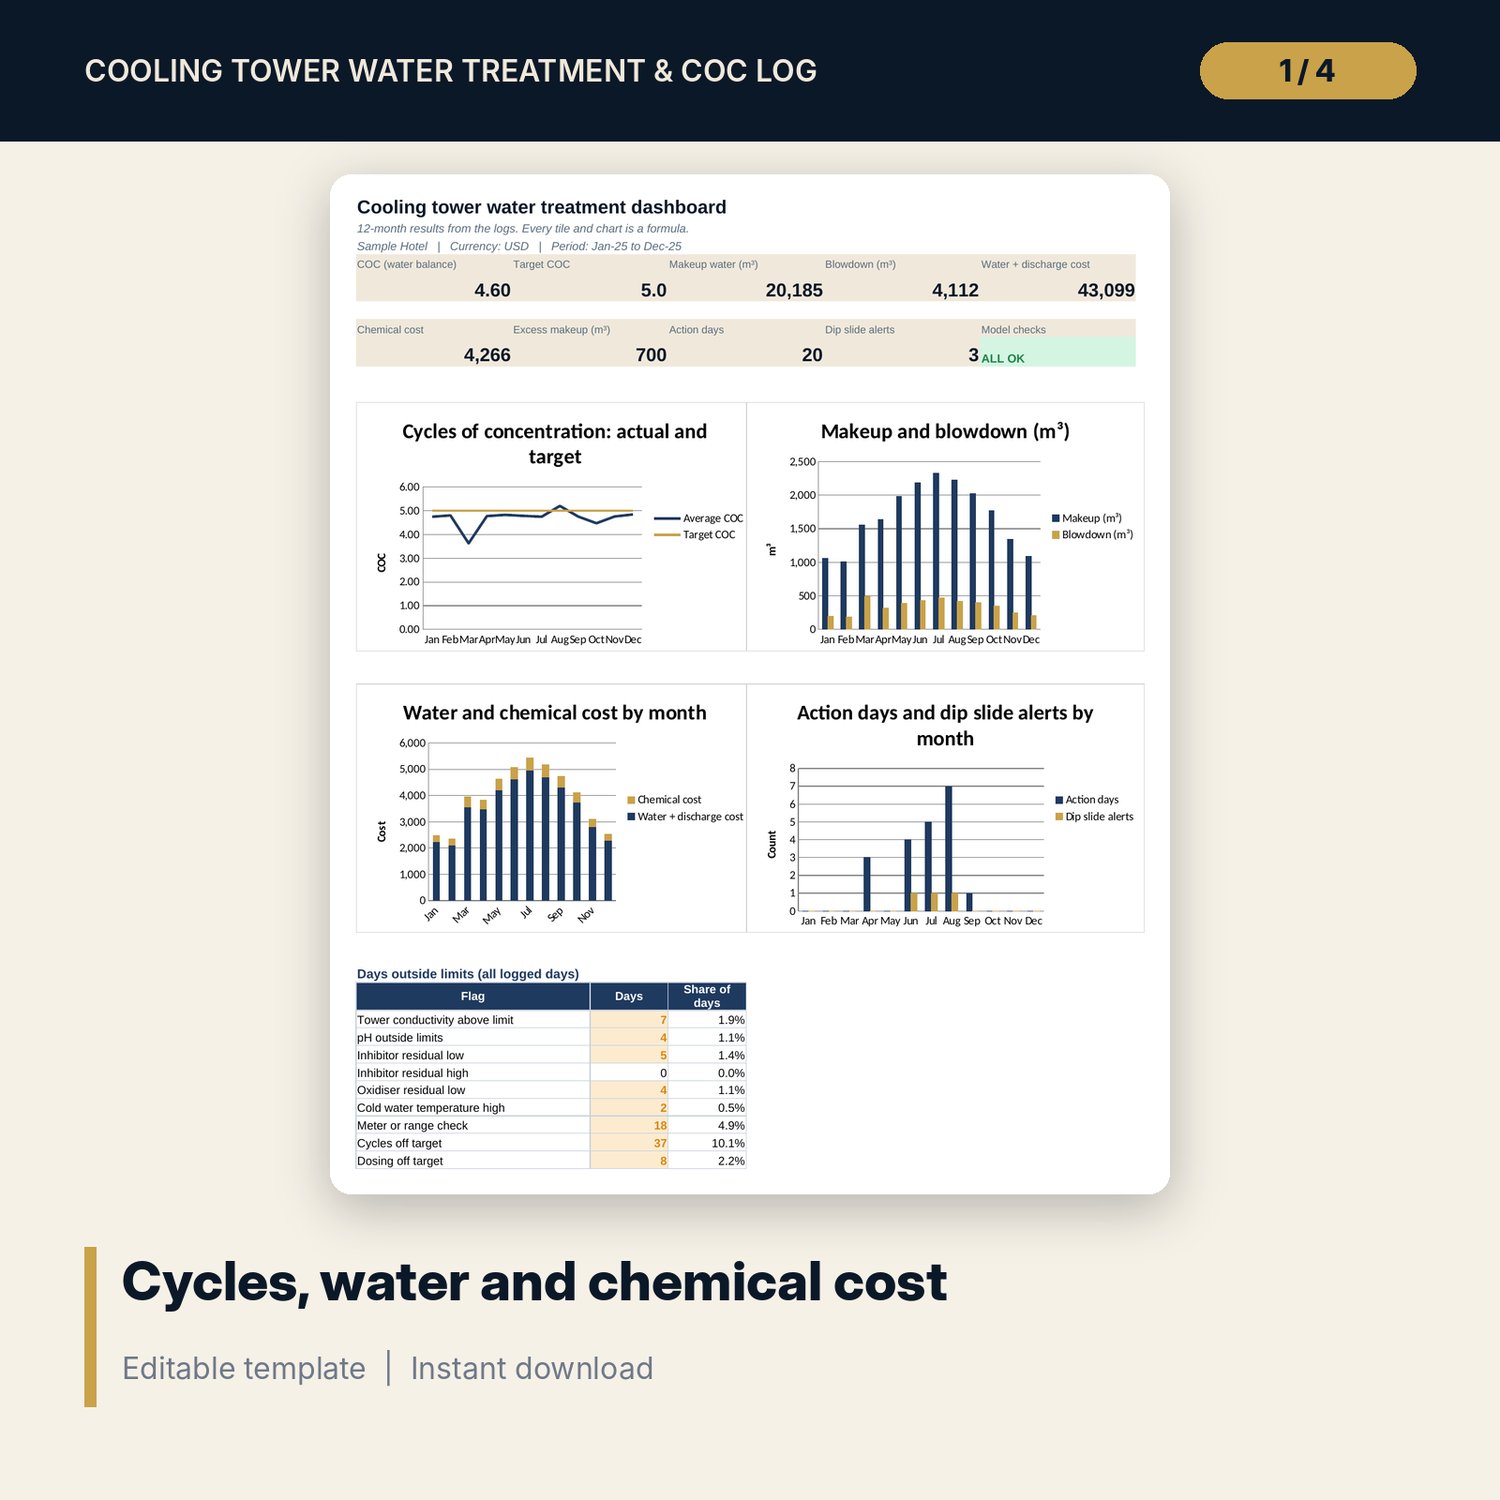
- Dashboard: 9 KPI tiles, the check status, 4 charts and a table of days outside limits
- README.txt and LICENSE-and-Terms.txt
How it works
- Enter the start date, opening meter readings, tower data, target cycles, control limits and prices on Settings.
- Replace the sample rows on Daily_Log and Micro_Log with your own daily readings and weekly dip slide results.
- Read Limit_Flags: each day is OK, Review or Action, with the reason in the flag columns.
- Compare the two cycles figures on Water_Calc and the evaporation by load with the evaporation by water balance to catch meter and probe faults.
- Test a higher cycles target on COC_Savings, check the conductivity limit row, then read the Dashboard.
Details
- Formats: one XLSX workbook
- Language: English
- Units: m³, µS/cm, °C, K, RT, kW, kg of product, ppm as product, cfu/mL
- Software: Excel 2016 or later (Windows or Mac) or LibreOffice Calc
- No macros, no array formulas, no external links
- Delivery: instant download
Good to know
- Sample data is illustrative. Replace it with your own readings.
- Not engineering, water treatment, legal or health advice. Control limits, dosing targets and dip slide levels depend on your water, your treatment programme and local rules: verify them with your water treatment supplier and local requirements.
- Dip slides are a screening tool. They do not replace the Legionella sampling your risk assessment requires.
- The workbook covers one tower system. Use one copy per system.
- Single-user license.
FAQ
Do I need a conductivity controller?
No. Hand readings of conductivity work. The water balance needs a makeup meter and a blowdown meter. Without a blowdown meter, estimate the daily blowdown from valve open time and enter it as a running total.
Which cycles figure should I trust?
Conductivity cycles need a calibrated probe on both waters. Water balance cycles need both meters. When they differ by more than your tolerance, the log flags the day so you can find the faulty meter, probe or leak.
How is evaporation calculated?
Heat rejected equals cooling load times a heat ratio you set. Evaporation is that heat times the evaporative share, divided by the latent heat of water. The water balance gives a second estimate from the meters.
Can I change the limits and the target?
Yes. Every limit, price, constant and target is an input on Settings. Verify them with your supplier.
Can I log two towers?
Use one workbook per tower system, or one workbook for towers that share a basin and meters.