
HVAC Indoor Air Quality & Ventilation Log: indoor air quality log with CO2, humidity and filter schedule
Full description
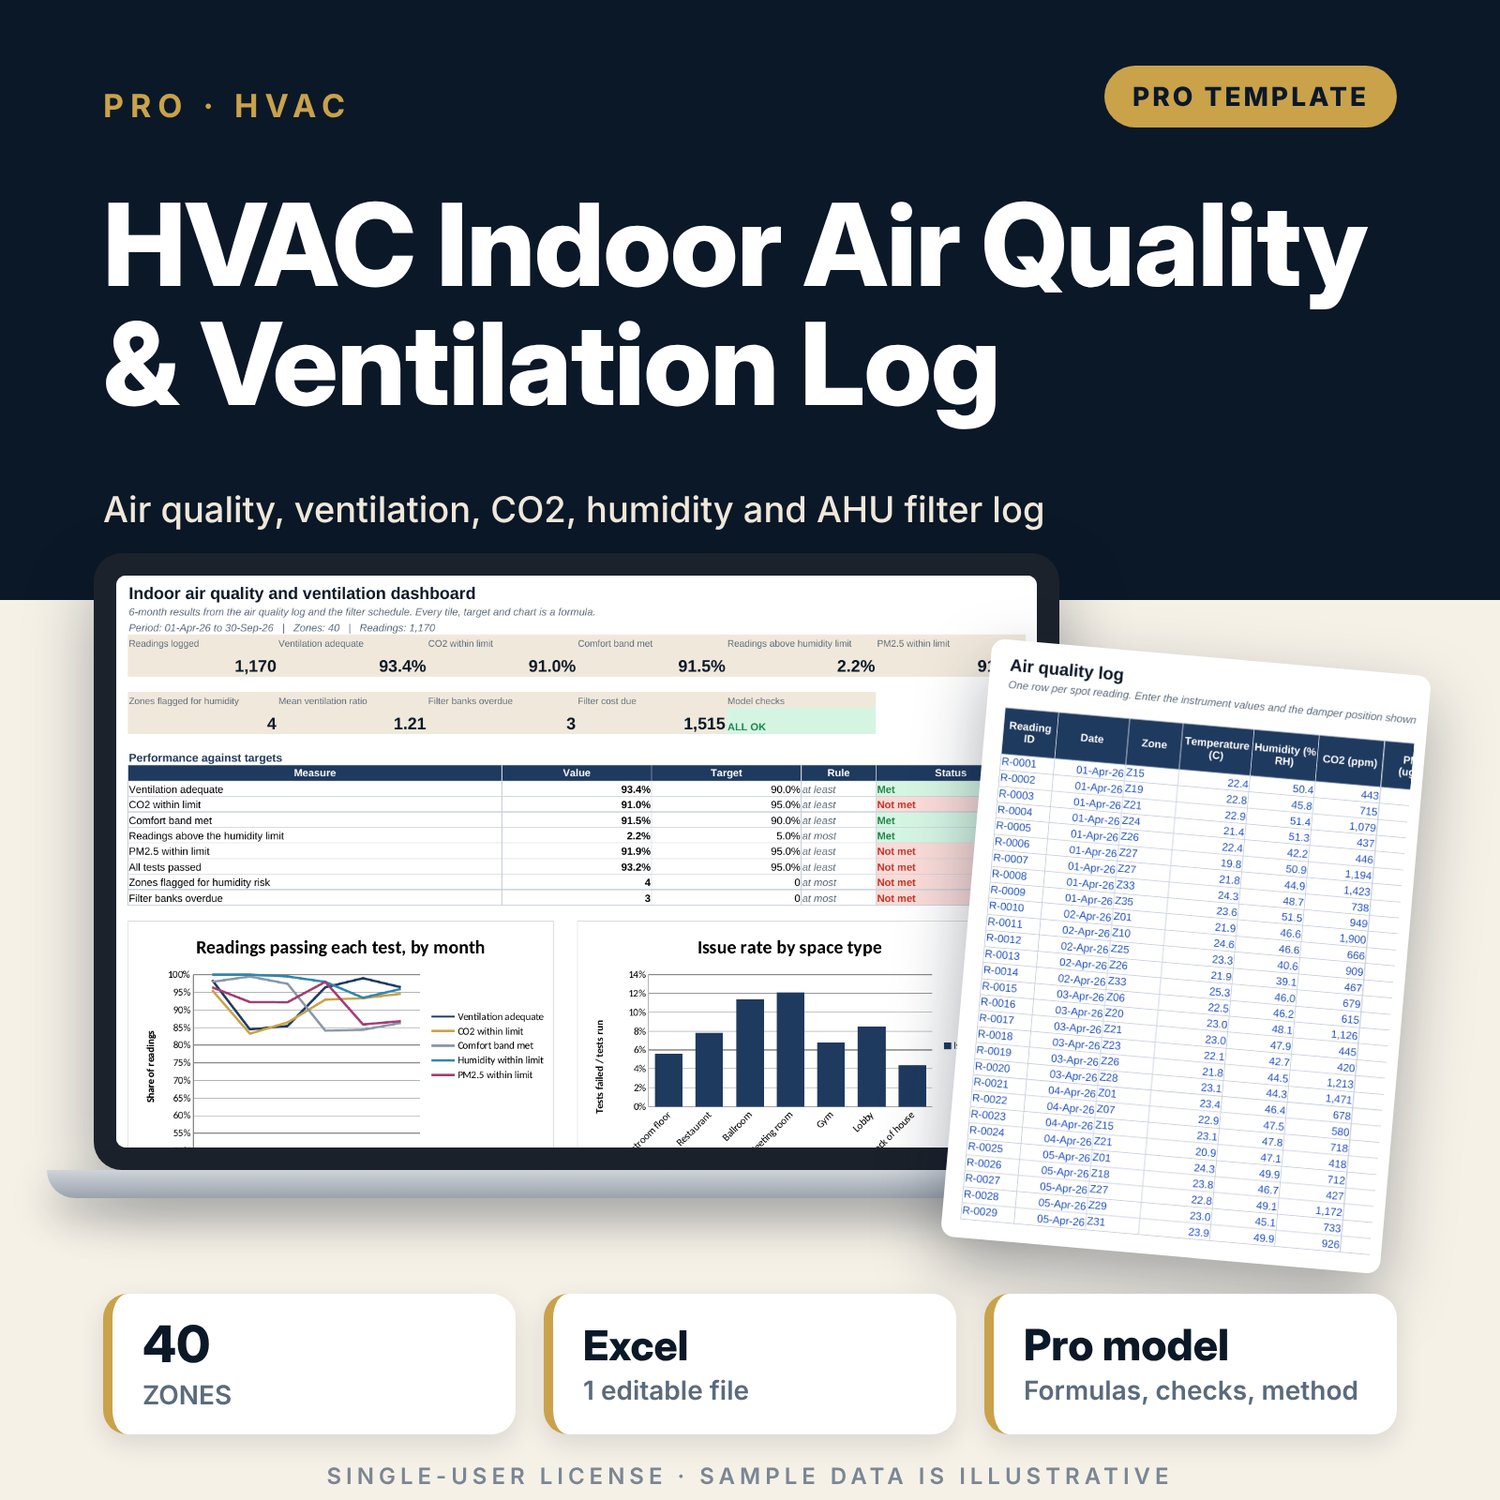
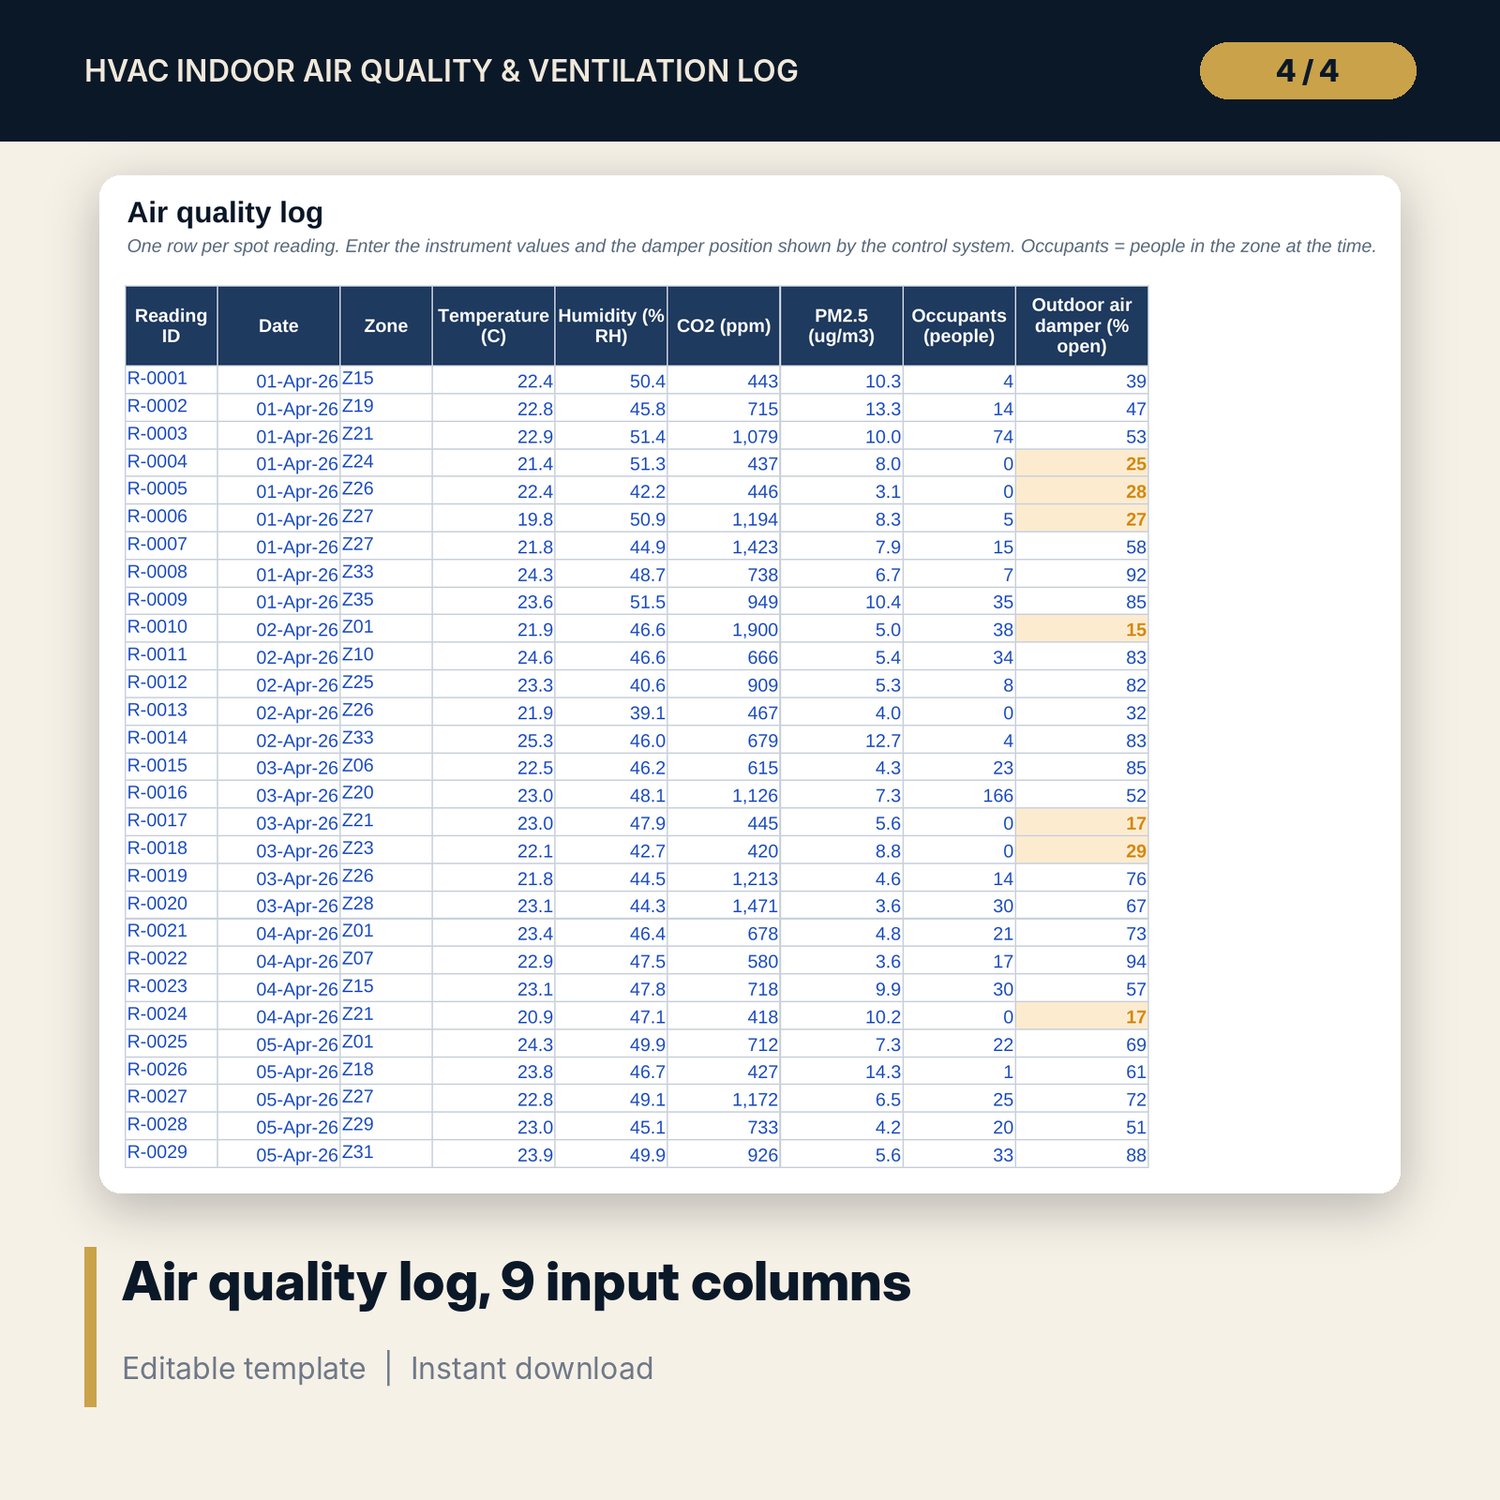
For chief engineers, hotel general managers, facility managers and technical directors who need evidence that guest and staff areas are ventilated properly. You log spot readings for each zone: temperature, humidity, CO2, PM2.5, the number of people present and the outdoor air damper position. The workbook calculates the outdoor air each zone needs from occupancy and floor area, compares it with the air delivered, runs a CO2 test against the rise allowed for the space type, checks the comfort band, flags humidity that supports mould and tests PM2.5 against your limit. It ranks zones each month, shows which AHU serves the worst zones and schedules filter changes from run hours and pressure drop.
Save with a bundle: this workbook is also in the Hotel Engineering & MEP Pro Bundle, 25 workbooks for $59 instead of $319. All 100 Pro workbooks are in the Pro Library for $119, and all 241 templates and workbooks are in the Ultimate Hospitality Library for $149.
What is inside
- HVAC_Air_Quality_Ventilation_Log.xlsx: 11 tabs, 30,624 formulas, 4 native charts, 13 drop-down and input rules, 14 integrity checks, a Method tab with 17 calculation notes.
- Sample data (illustrative): 40 zones (guestroom floors, restaurants, ballrooms, meeting rooms, gym, lobby and back of house), 1,170 readings over 6 months and 16 filter banks on 8 AHUs, with room for 50 zones, 1,400 readings and 24 filter banks.
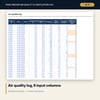
- IAQ_Calc engine: required and delivered outdoor air, ventilation ratio, CO2 rise, implied outdoor air per person, and five pass or fail tests for every reading.
- Zone_Month: monthly trend, results by space type, zone issue rates month by month and the ranking of zones.
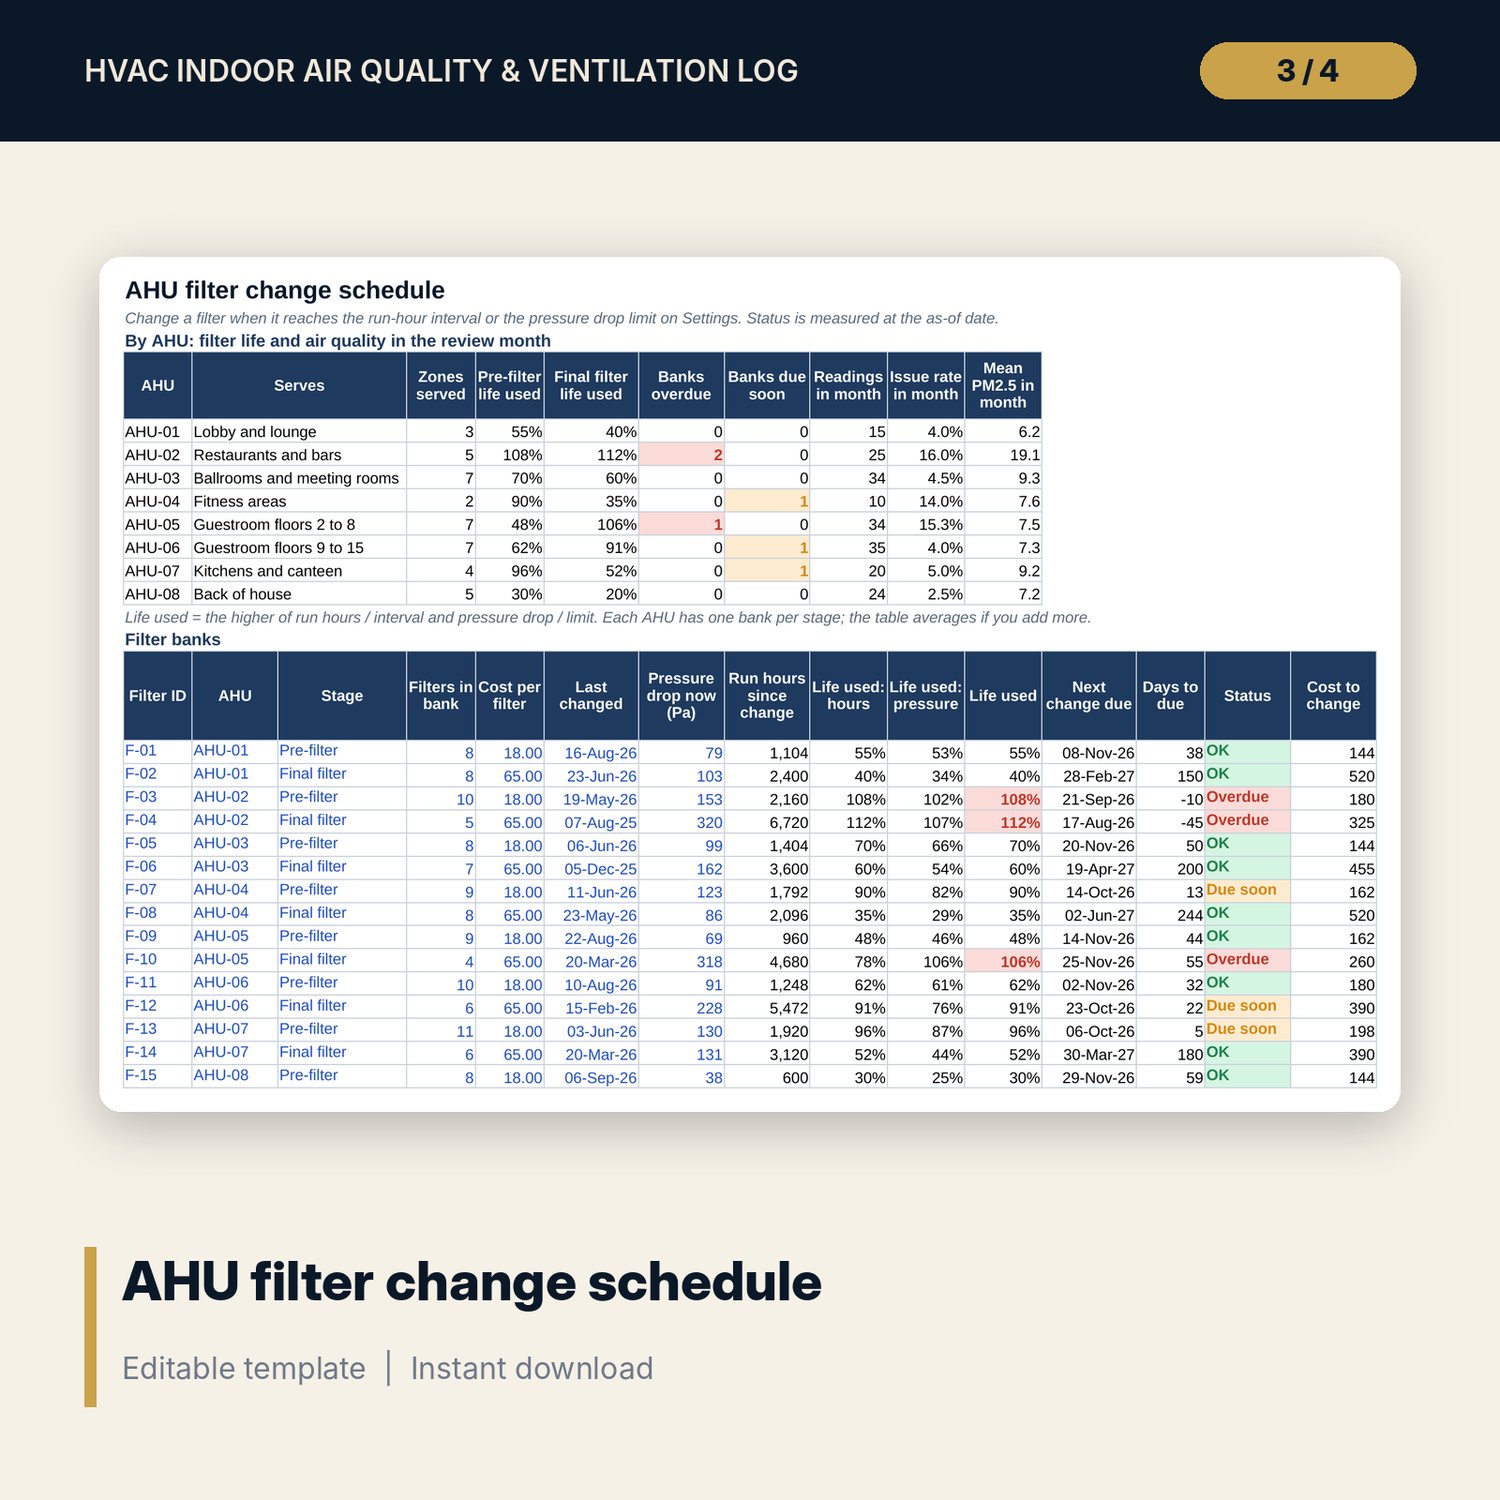
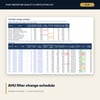
- AHU_Filters: life used by hours and pressure, next change date, status, replacement cost and a summary by AHU.
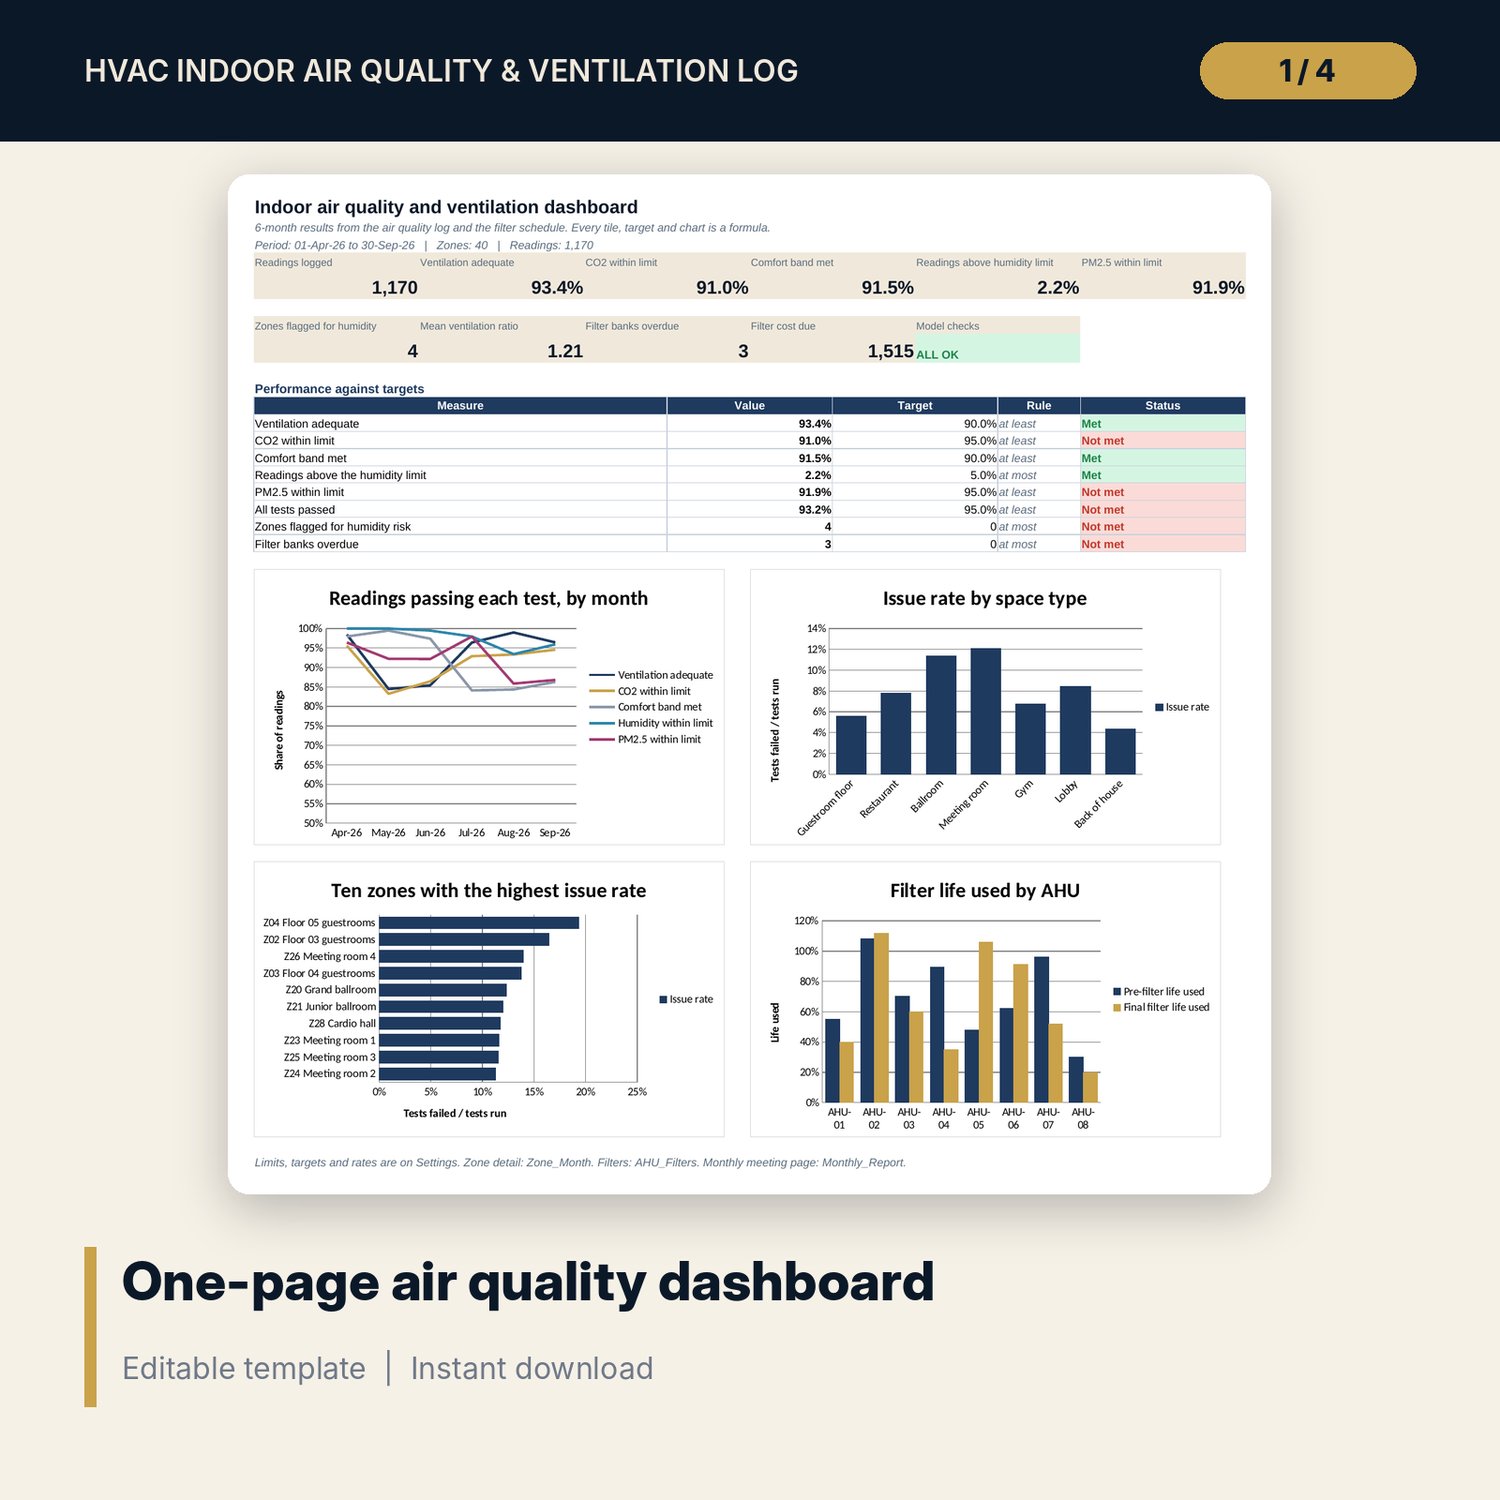
- Dashboard: 10 KPI tiles, a check tile, 8 targets and 4 charts, printable on one page.
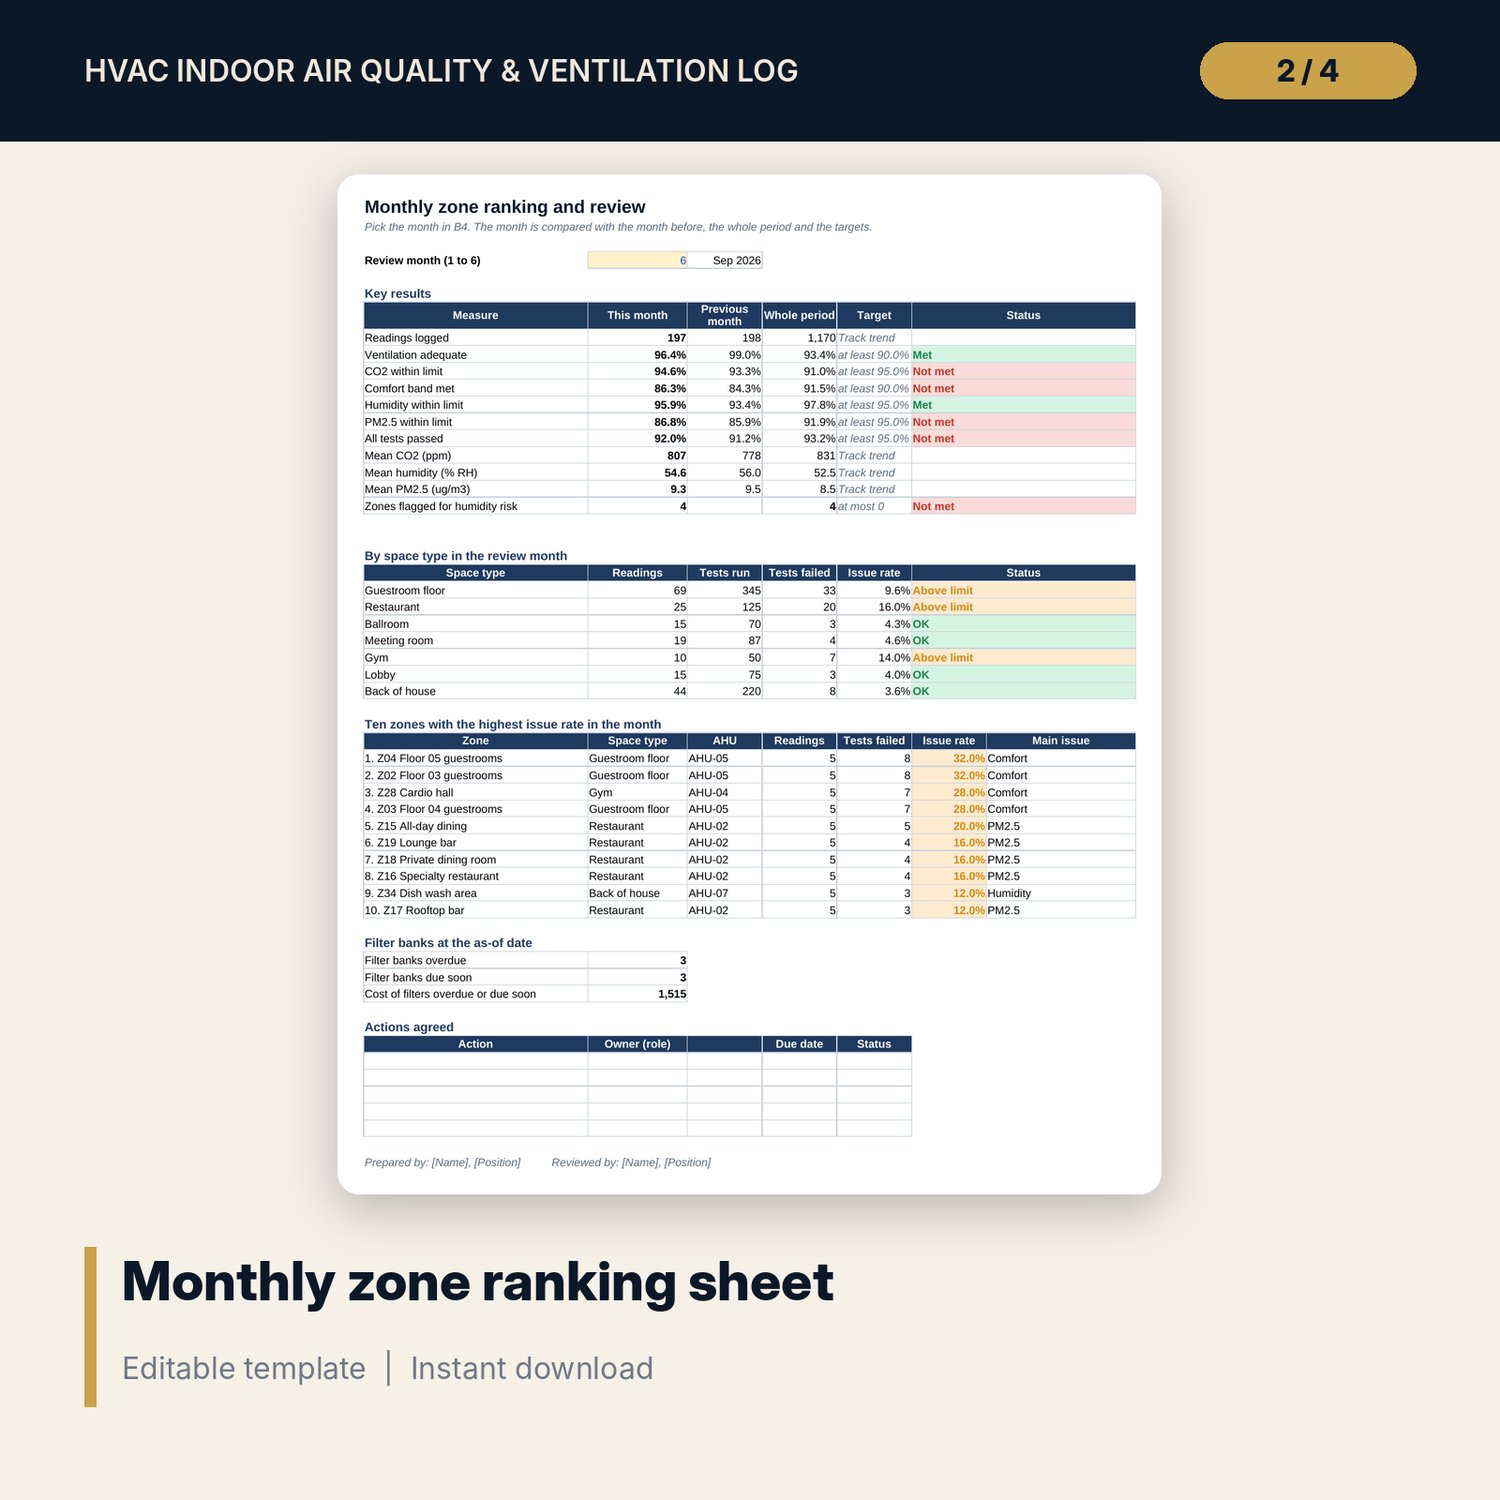
- Monthly_Report: one printable page for any month, with the ten worst zones, space types, filters and an action list.
- README.txt and LICENSE-and-Terms.txt.
How it works
- Enter your limits, targets, space type rates and bands, AHUs and filter stages on Settings.
- List your zones with floor area and the outdoor air flow at full damper opening.
- Replace the sample readings and filter banks with your own records.
- Confirm the Checks tab shows ALL OK, then read Zone_Month, AHU_Filters and the Dashboard.
- Set the month on Monthly_Report before each review, print it and record the actions.
Details
- Format: XLSX workbook, one file.
- Language: English.
- Software: Excel 2016 or later, or LibreOffice Calc. No macros, no data tables, no add-ins.
- One 6-month period per file. Save a copy for each period.
- Delivery: instant download.
Good to know
- Sample data is illustrative and does not describe any property. Replace it with your own readings.
- Ventilation rates, CO2 limits, comfort bands, humidity and PM2.5 limits and filter intervals are examples. Verify local requirements and use the values that apply to your building.
- Not engineering, health or safety advice. The workbook tests what your readings show.
- Single-user license.
FAQ
How is the required outdoor air calculated?
Required outdoor air is occupants times the rate per person plus floor area times the rate per square metre. You set both rates for each space type on Settings.
How does the CO2 test work?
It compares the CO2 rise above your outdoor baseline with the rise allowed for the space type. The workbook also shows the outdoor air per person that the rise implies. The test is not run when nobody was in the zone.
How do I know if a zone has a mould risk?
Each reading above the humidity limit is a failure. A zone is flagged when the share of its readings above the limit is higher than the share you set.
When is a filter due?
A filter is overdue when its change date has passed or its pressure drop has reached the limit. It is due soon when the change date is within the lead time or the pressure reaches the warning level.
Can I monitor more than 40 zones?
Yes, up to 50 zones and 1,400 readings in one file. Use a second copy for more.