
Guestroom Engineering Inspection & Defect Analytics: guestroom preventive maintenance inspection tracker in Excel
Full description
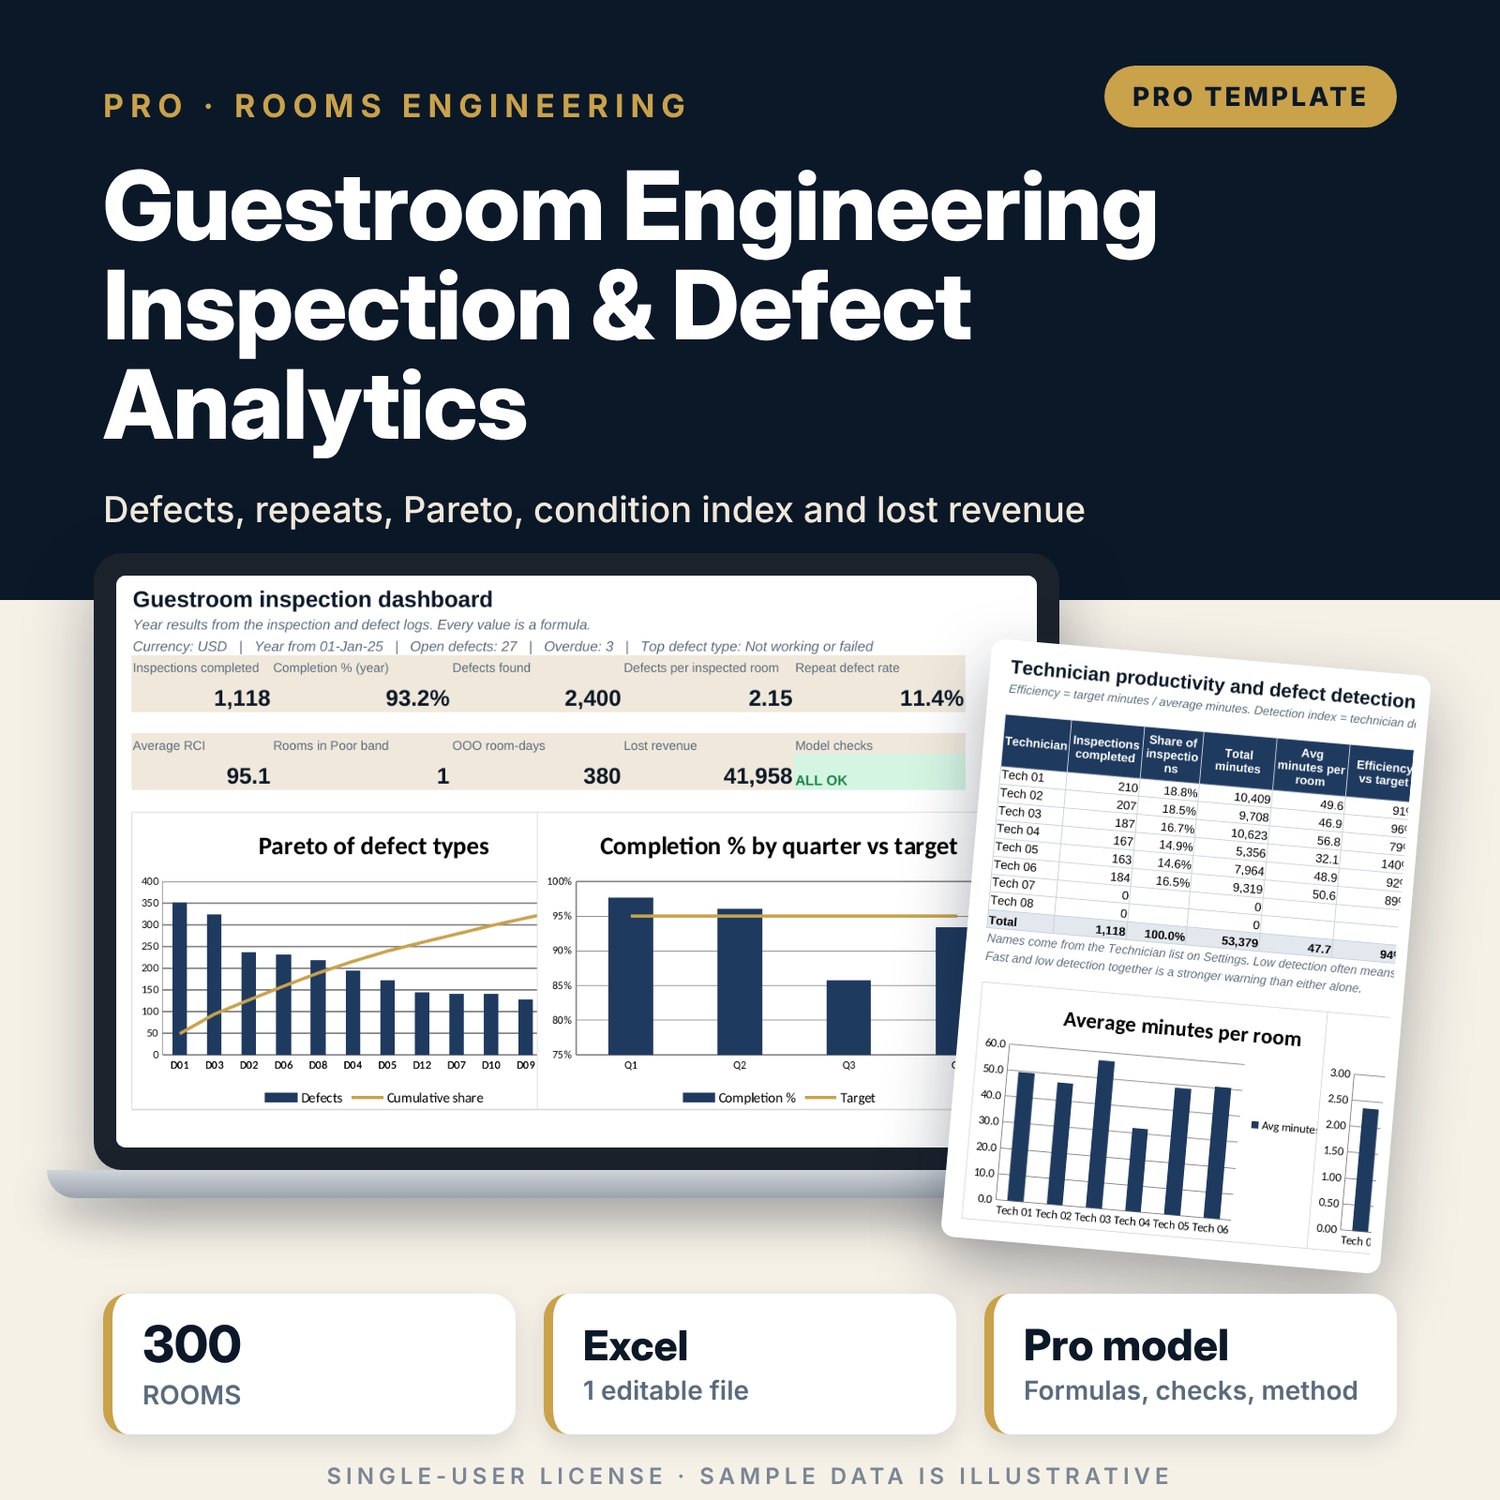
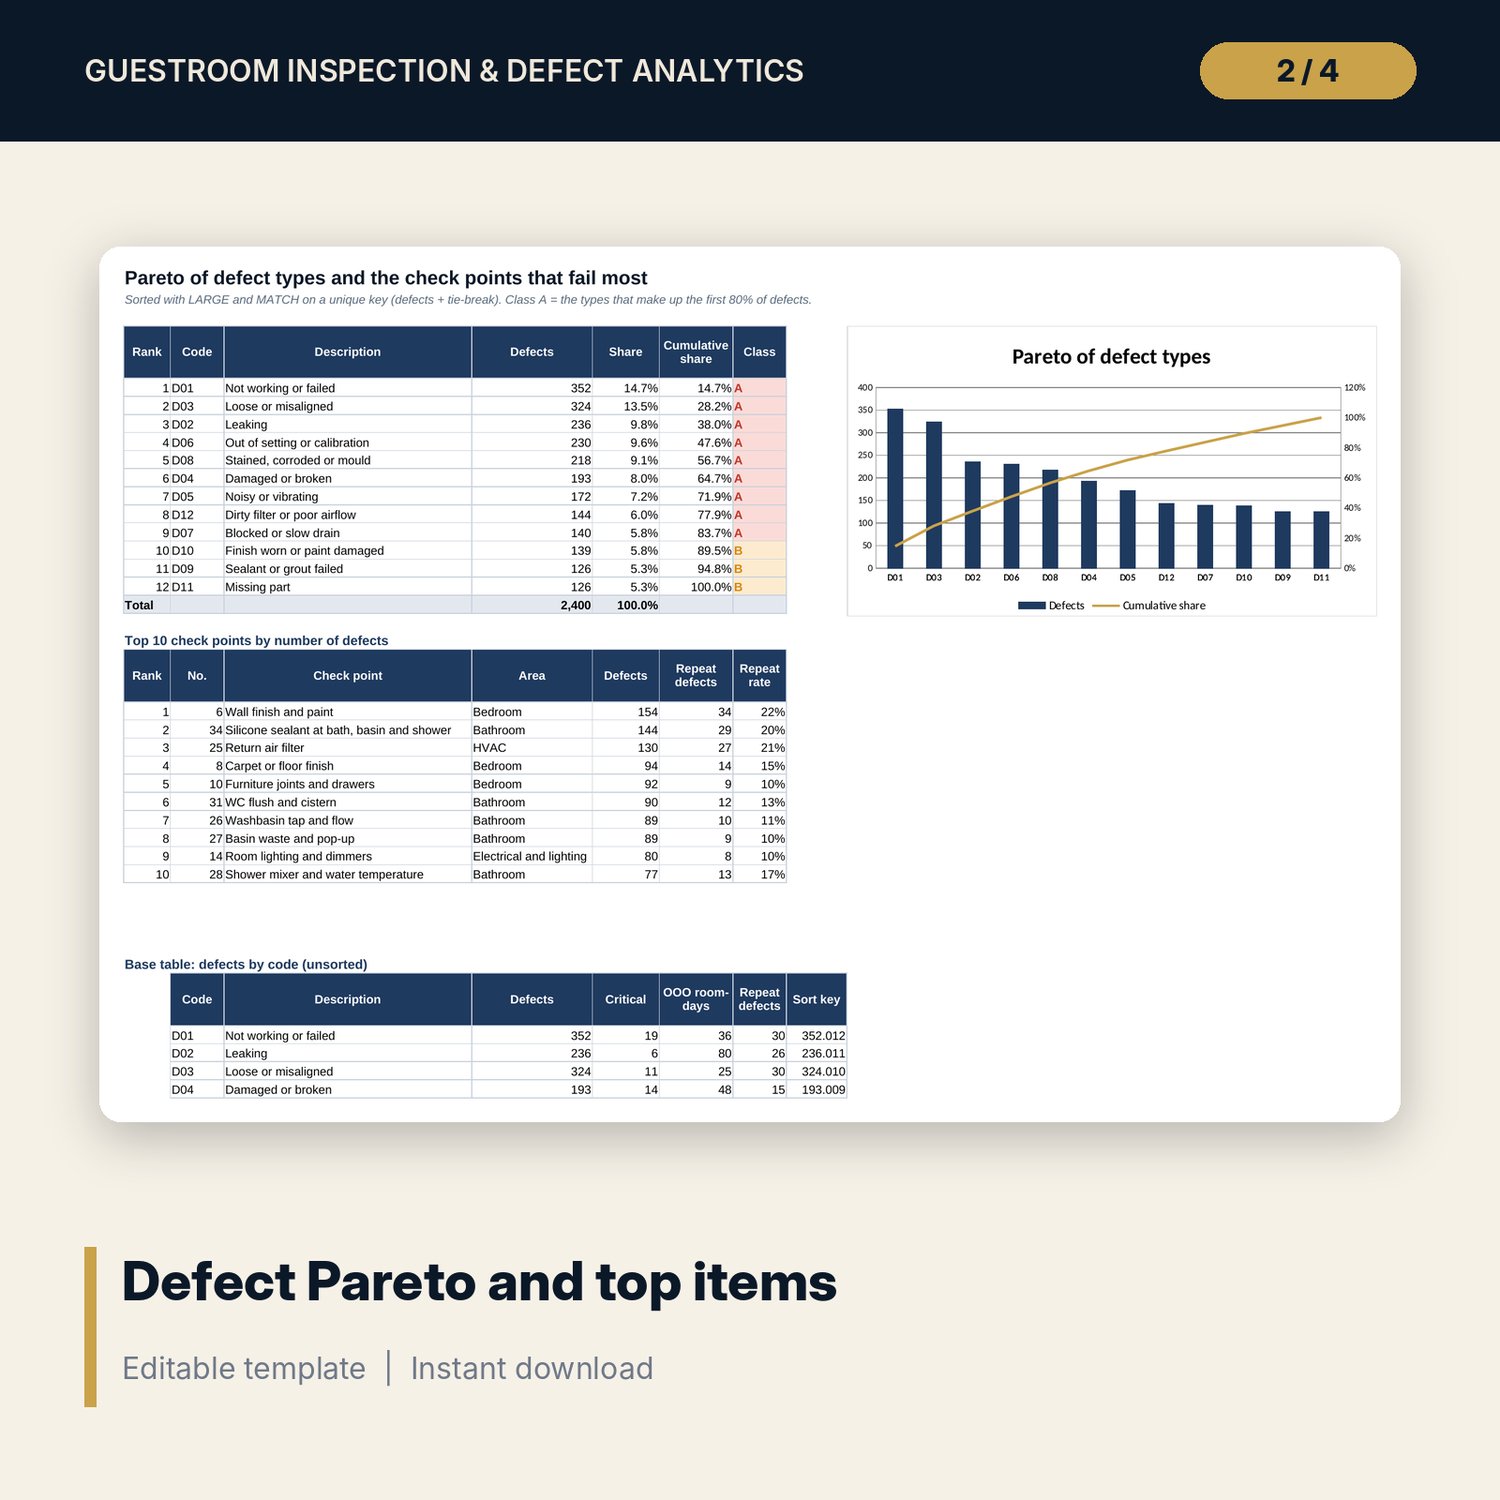
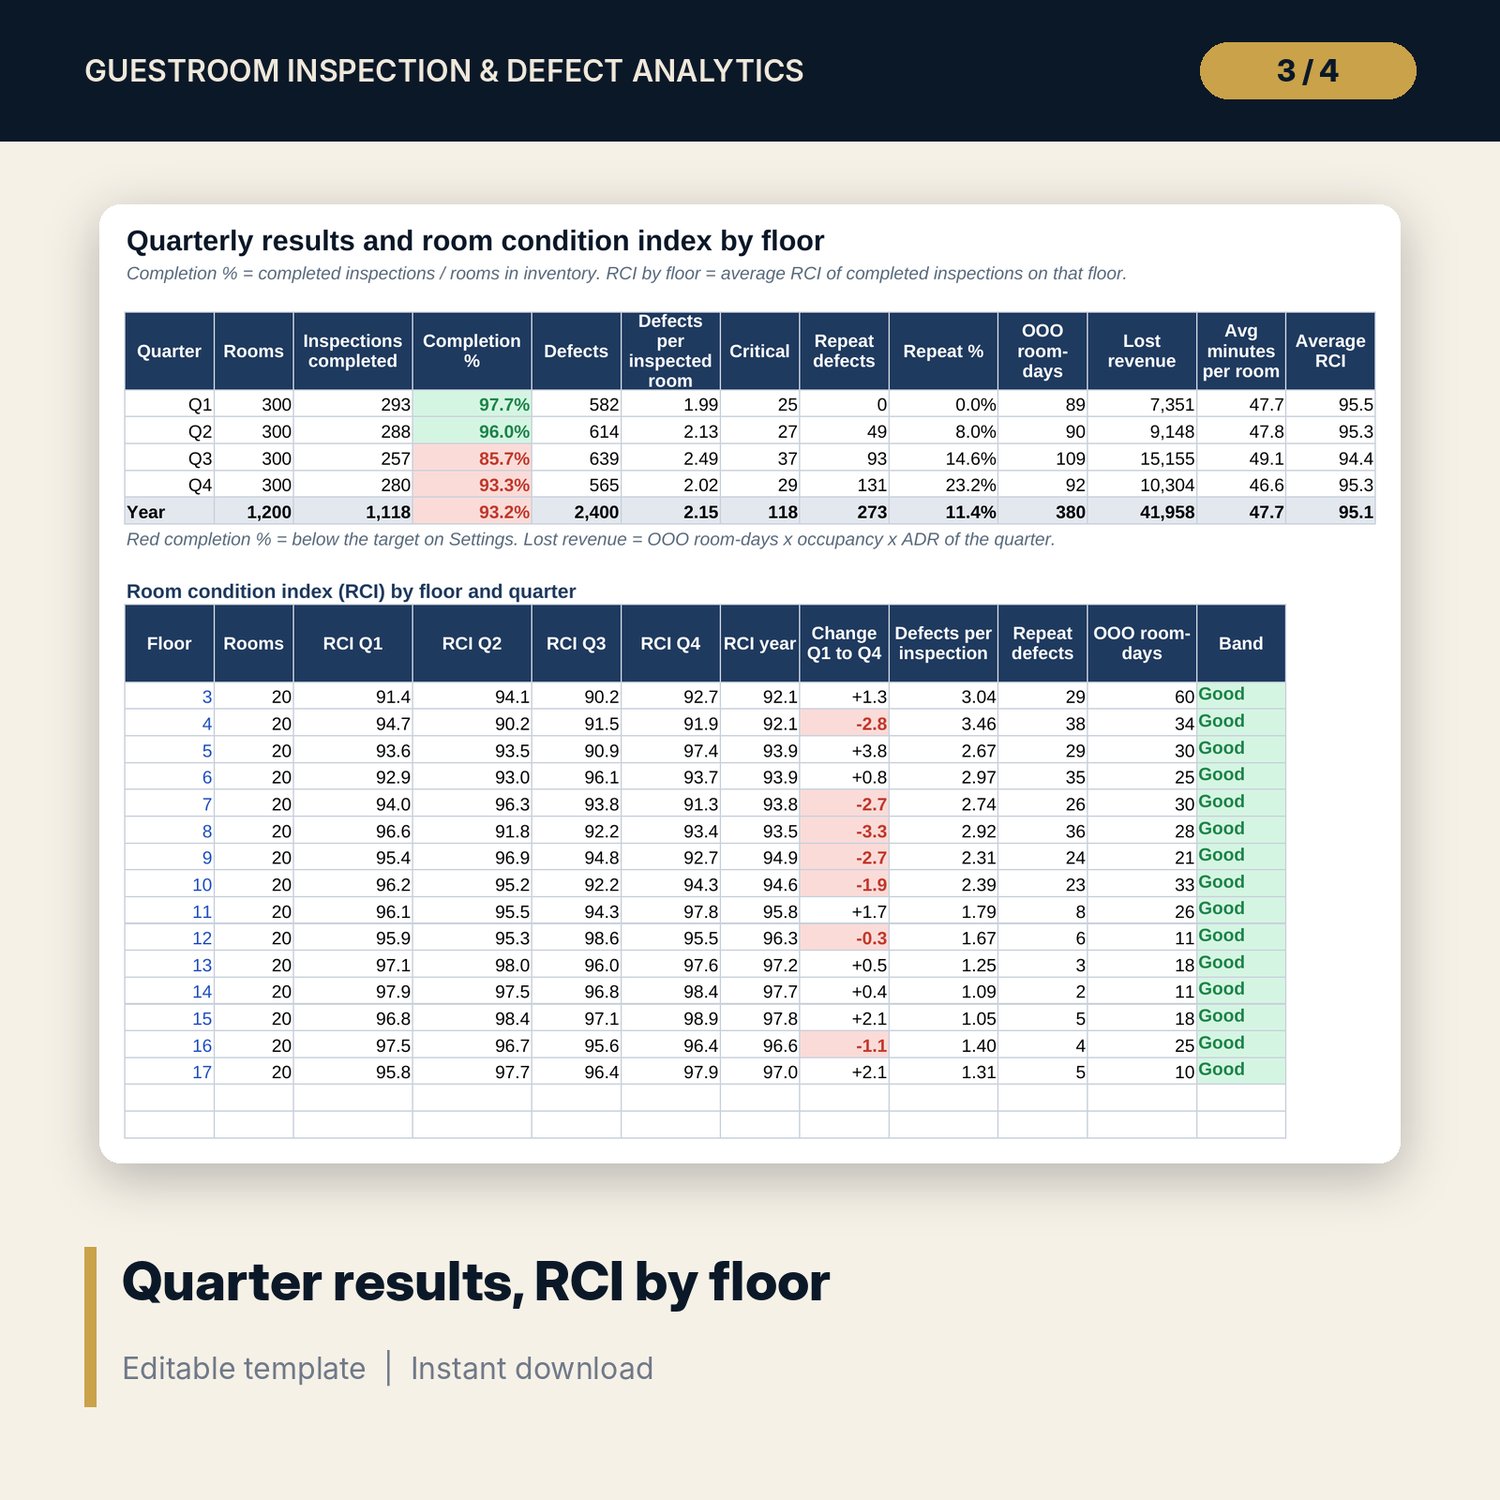
For chief engineers, engineering managers, rooms division managers and general managers who run a quarterly guestroom preventive maintenance programme. Technicians inspect each room against 40 check points; you log one row per inspection (date, technician, minutes, status) and one row per defect (check point, defect code, severity, out-of-order days, closed date). The workbook scores every inspection with a room condition index (100 minus weighted defect points), finds repeat defects (same room and check point in an earlier quarter), ranks defect types in a Pareto with A/B/C classes, and averages the index by floor and quarter. It counts out-of-order room-days and prices them as lost revenue using occupancy and ADR per quarter, tracks completion % against target, and compares technicians on minutes per room, rooms per shift and defect detection, so rushed inspections stand out.
Save with a bundle: this workbook is also in the Hotel Engineering & MEP Pro Bundle, 25 workbooks for $59 instead of $319. All 100 Pro workbooks are in the Pro Library for $119, and all 241 templates and workbooks are in the Ultimate Hospitality Library for $149.
What is inside
- Guestroom_Inspection_Defect_Analytics.xlsx: 12 tabs, 31,695 formulas, 8 native charts, 14 integrity checks, 15-row Method tab
- Inspection_Log: 1,300 rows with 1,200 illustrative inspections (300 rooms x 4 quarters, 1,118 completed)
- Defect_Log: 2,800 rows with 2,400 illustrative defects, each with repeat test, days to close, status and lost revenue
- Checklist: 40 check points in 6 areas with weights, plus defects, critical, repeats and repeat rate per check point
- Room_Analytics: 300-room inventory (320 rows) with defects, repeats, average condition index, OOO days, lost revenue and a flag per room
- Pareto: 12 defect codes ranked with cumulative share and A/B/C class, top 10 check points, Pareto chart
- Trends: 4 quarters of completion %, defects, repeats, OOO days, lost revenue and minutes, plus condition index by floor and quarter
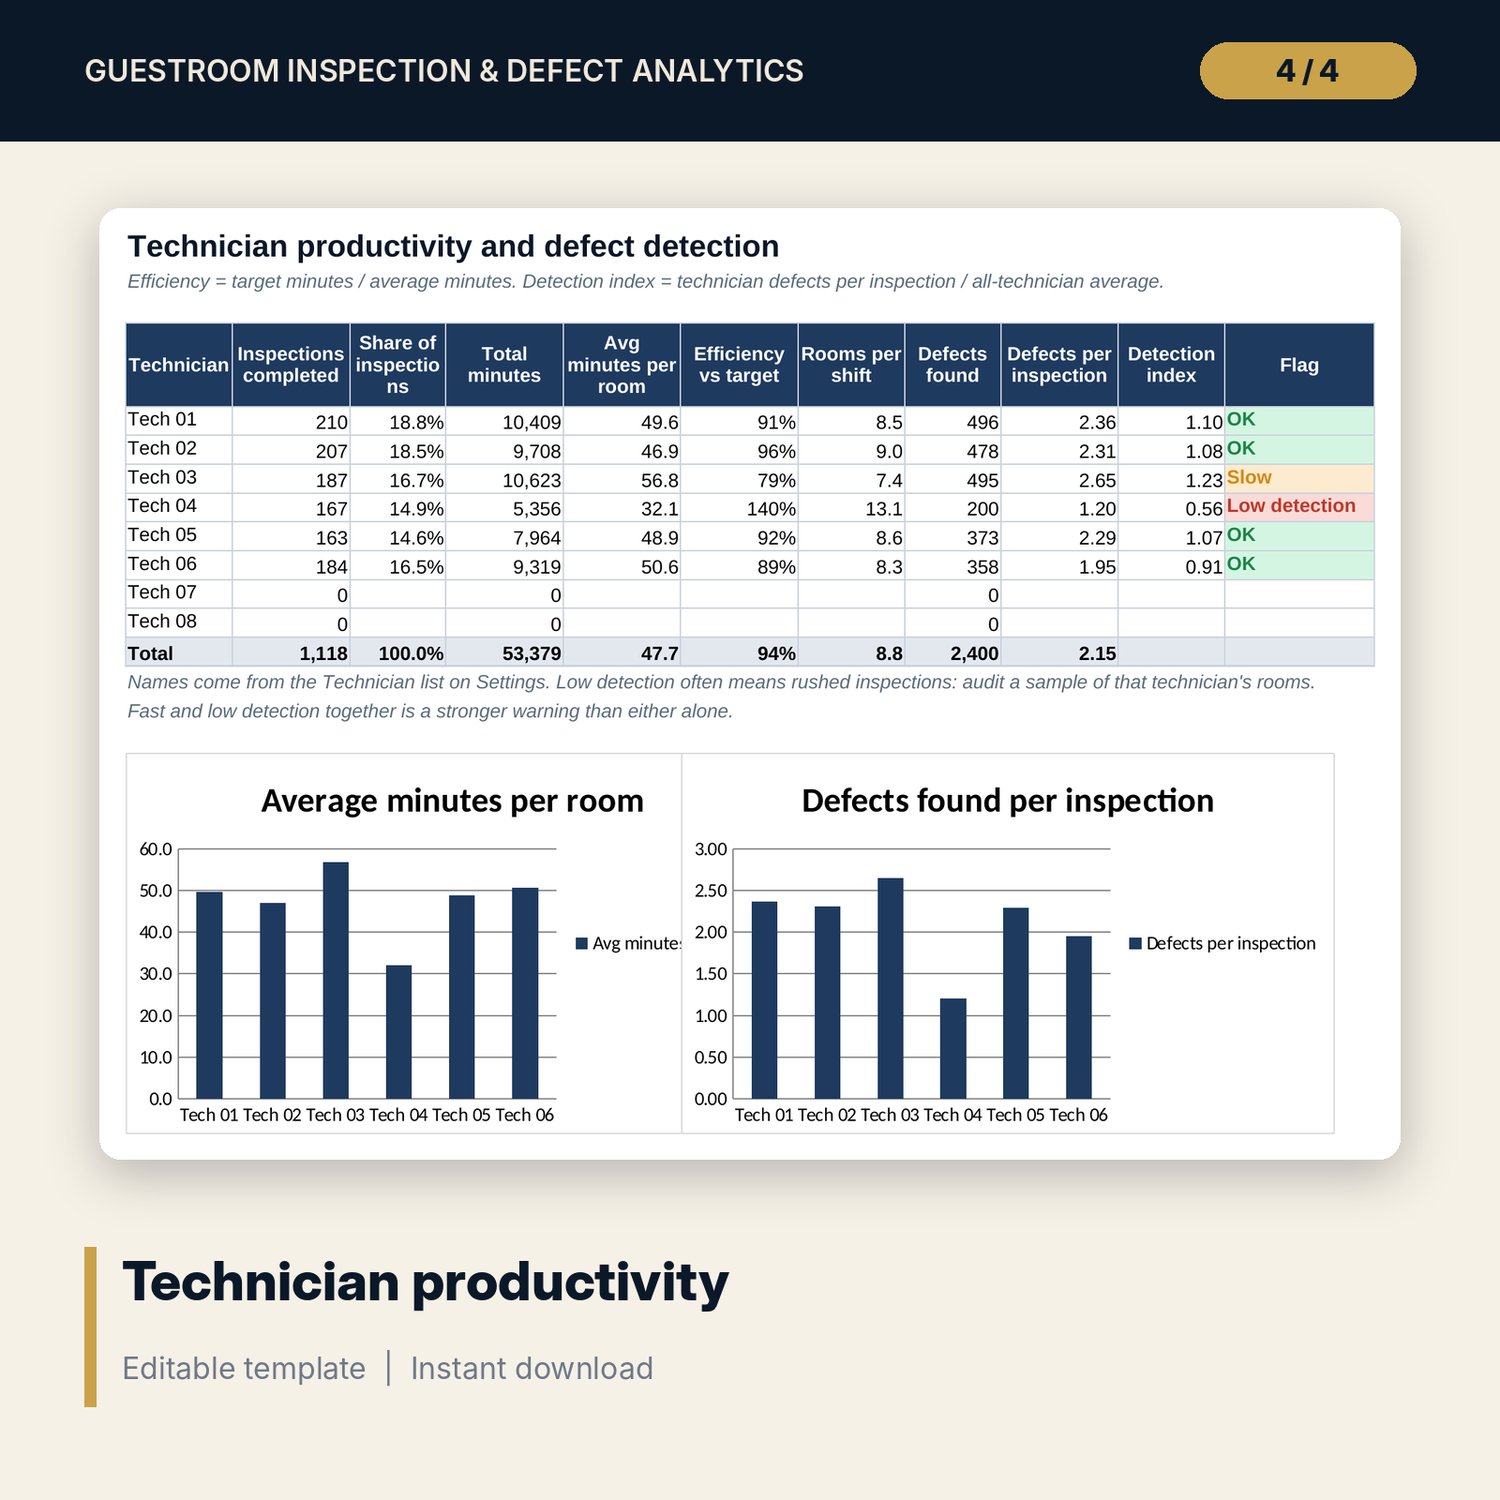
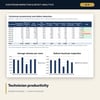
- Technicians: productivity and detection index for up to 8 technicians, 2 charts
- Settings: 13 inputs with units, ADR and occupancy per quarter, severity points, defect code table and drop-down lists
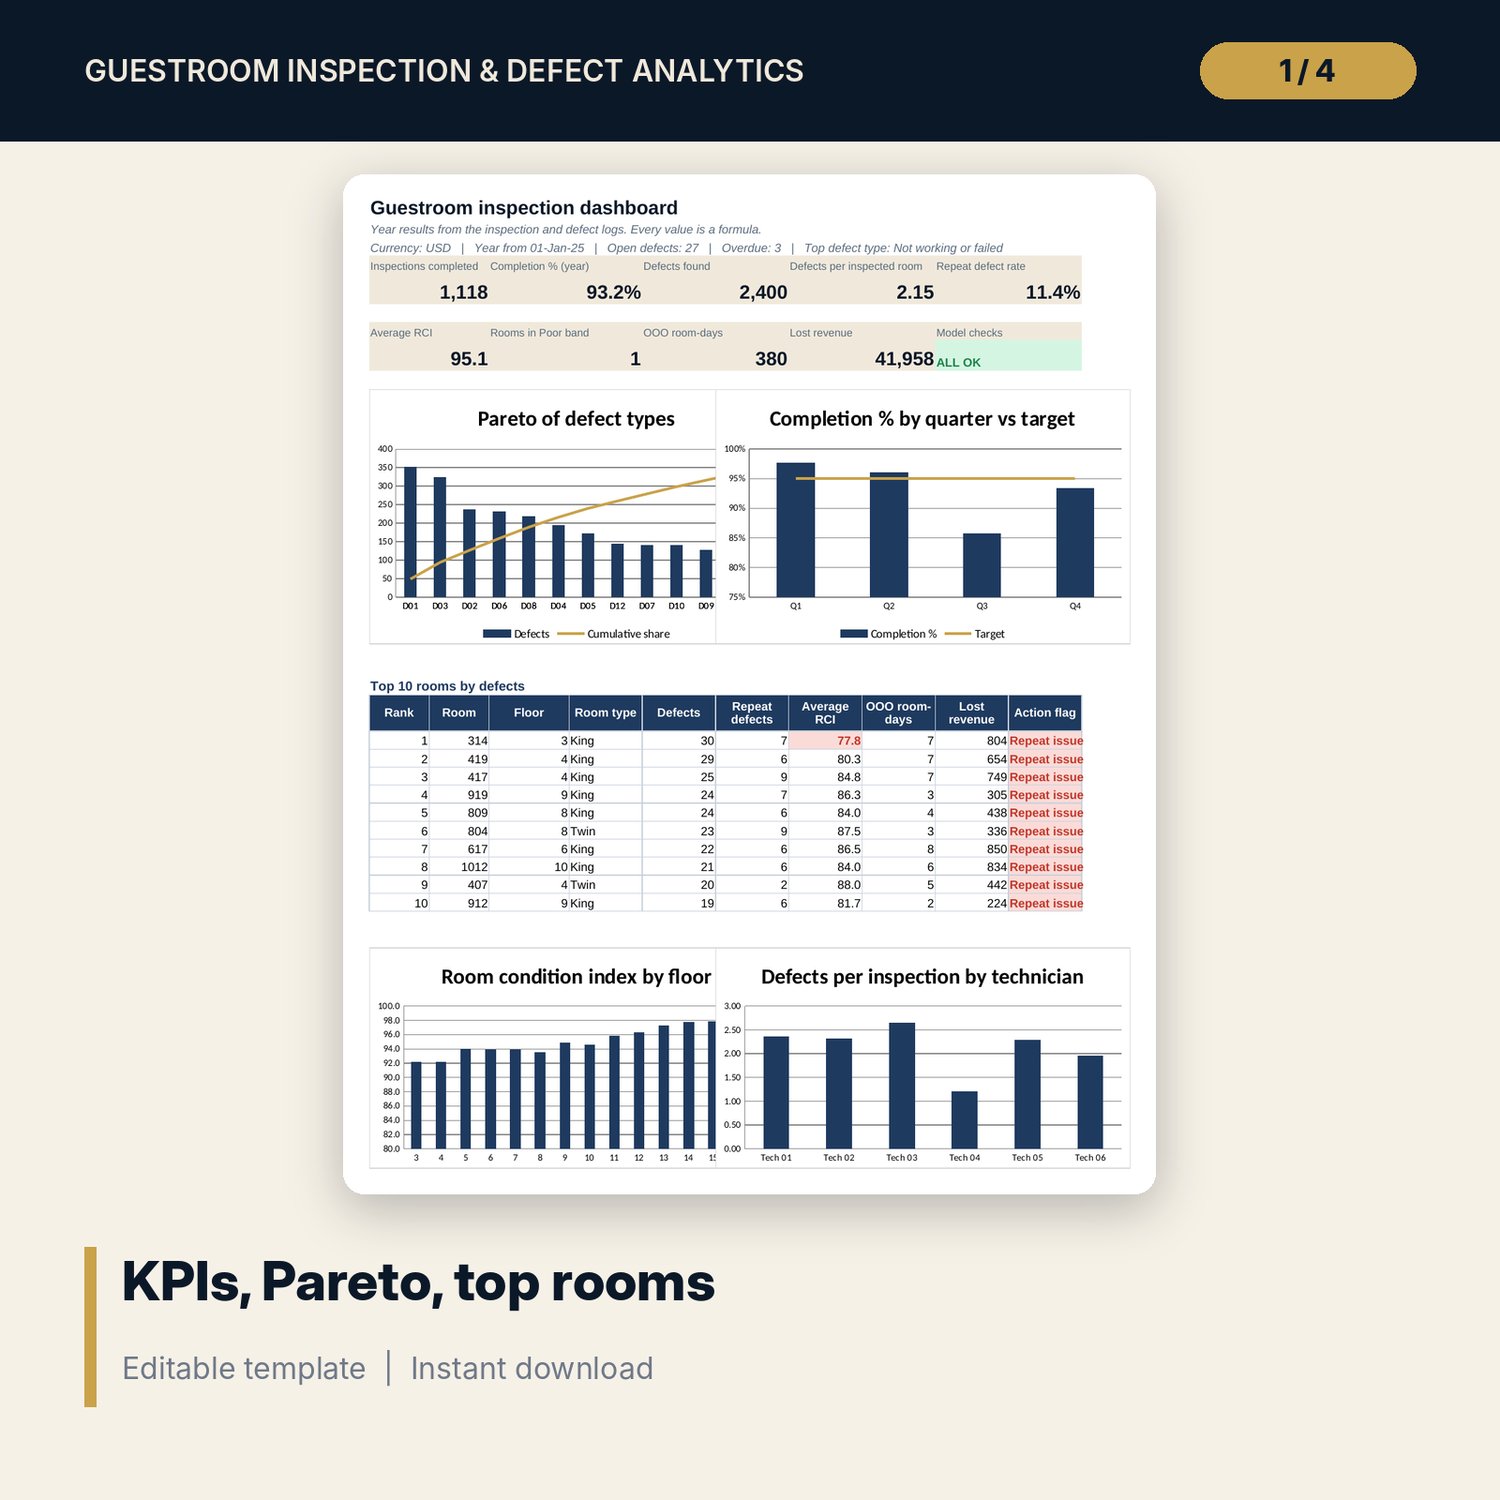
- Dashboard: 9 KPI tiles, check status, 4 charts and the top 10 rooms by defects on one page
- README.txt and LICENSE-and-Terms.txt
How it works
- Set the inspection year, report date, targets, ADR and occupancy per quarter on Settings, and adjust the 40 check points.
- Enter your rooms, floors and room types on Room_Analytics.
- Log every inspection on Inspection_Log and every defect found on Defect_Log.
- Review Pareto, Trends and Technicians each quarter. Fix repeat defects and Poor rooms first.
- Present the Dashboard after Checks shows ALL OK.
Details
- Format: one XLSX workbook
- Language: English
- Units: minutes, days, condition index 0 to 100, money in the currency you set
- Software: Excel 2016 or later (Windows or Mac) or LibreOffice Calc; also opens in Google Sheets, where chart styling may differ
- No macros, no array formulas, no external links
- Delivery: instant download
Good to know
- Sample data is illustrative. Replace it with your own rooms and inspections.
- This is a maintenance management tool, not engineering or safety certification.
- ADR, occupancy, severity points, weights and thresholds are editable inputs. Verify them with your revenue and engineering teams and local requirements.
- The logs use many COUNTIFS formulas, so large pastes take a few seconds to recalculate.
- Single-user license.
FAQ
Can I change the 40 check points?
Yes. Edit the wording, area and weight on Checklist. There are 10 spare rows if you need more points.
How is a repeat defect defined?
The same room and the same check point had a defect in an earlier quarter, within the look-back you set on Settings (4 quarters by default).
How is lost revenue calculated?
Out-of-order room-days on each defect x occupancy x ADR for that quarter. It estimates the room nights you would have sold.
My hotel has more than 300 rooms. Will it work?
Room_Analytics holds 320 rooms and Inspection_Log 1,300 rows. For a larger hotel, copy formula rows down and extend the named ranges.
What does the detection index show?
A technician's defects per inspection divided by the team average. A low value with short inspection times usually means rooms are not being checked properly.