


Chiller Plant Log & Efficiency Calculator: chiller kW per ton and plant efficiency log in Excel
Full description
For chief engineers, engineering managers and general managers of hotels with a water-cooled chiller plant. You enter one row per chiller per day: chilled and condenser water temperatures, flows, compressor kW, refrigerant pressures and run hours. The workbook calculates cooling load as flow x density x specific heat x delta-T, converts it to refrigeration tons (1 RT = 3.517 kW), and gives kW/RT and COP for every reading. Saturation temperatures come from a refrigerant pressure-temperature table by linear interpolation, so you see evaporator and condenser approach, and a condenser heat balance tests your sensors. Each reading is compared with an expected kW/RT built from the design value, a part-load curve and a condenser water correction. Pump and tower fan energy turn chiller results into whole-plant kW/RT and cost per ton-hour by day and month. Flags catch fouled tubes, low refrigerant charge, low delta-T syndrome and meter drift early, and a what-if tab prices the fix.
Save with a bundle: this workbook is also in the Hotel Engineering & MEP Pro Bundle, 25 workbooks for $59 instead of $319. All 100 Pro workbooks are in the Pro Library for $119, and all 241 templates and workbooks are in the Ultimate Hospitality Library for $149.
What is inside
- Chiller_Plant_Log_Efficiency_Calculator.xlsx: 12 tabs, 37,794 formulas, 4 native charts, 14 integrity checks, 20-row Method tab
- Chiller_Log: 1,200 rows, with 797 illustrative sample readings for 4 chillers over 12 months
- Plant_Log: 366 daily rows (365 sample days) for wet-bulb, chilled water pump, condenser water pump and tower fan energy
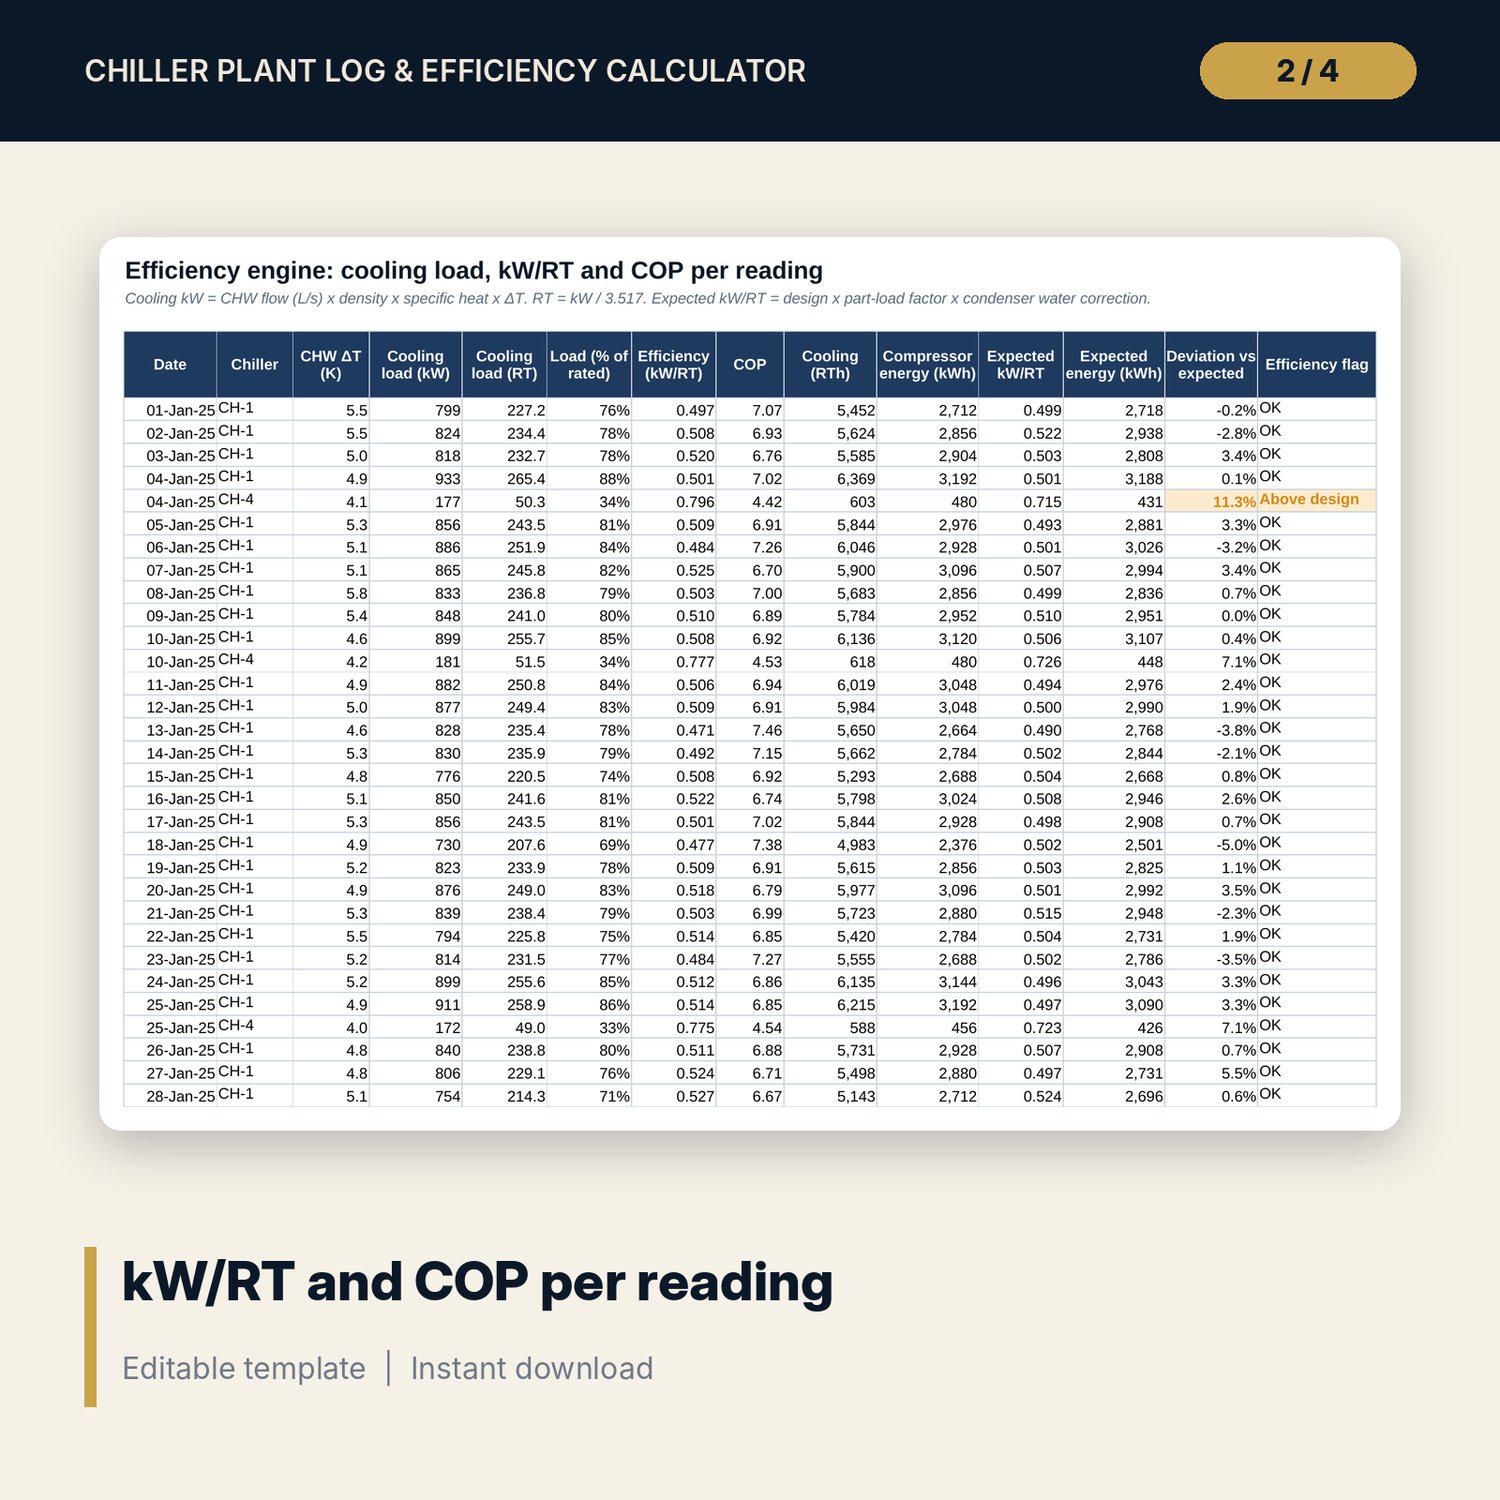
- Chiller_Calc engine: 14 columns per reading (delta-T, kW, RT, load %, kW/RT, COP, ton-hours, kWh, expected kW/RT, deviation, flag)
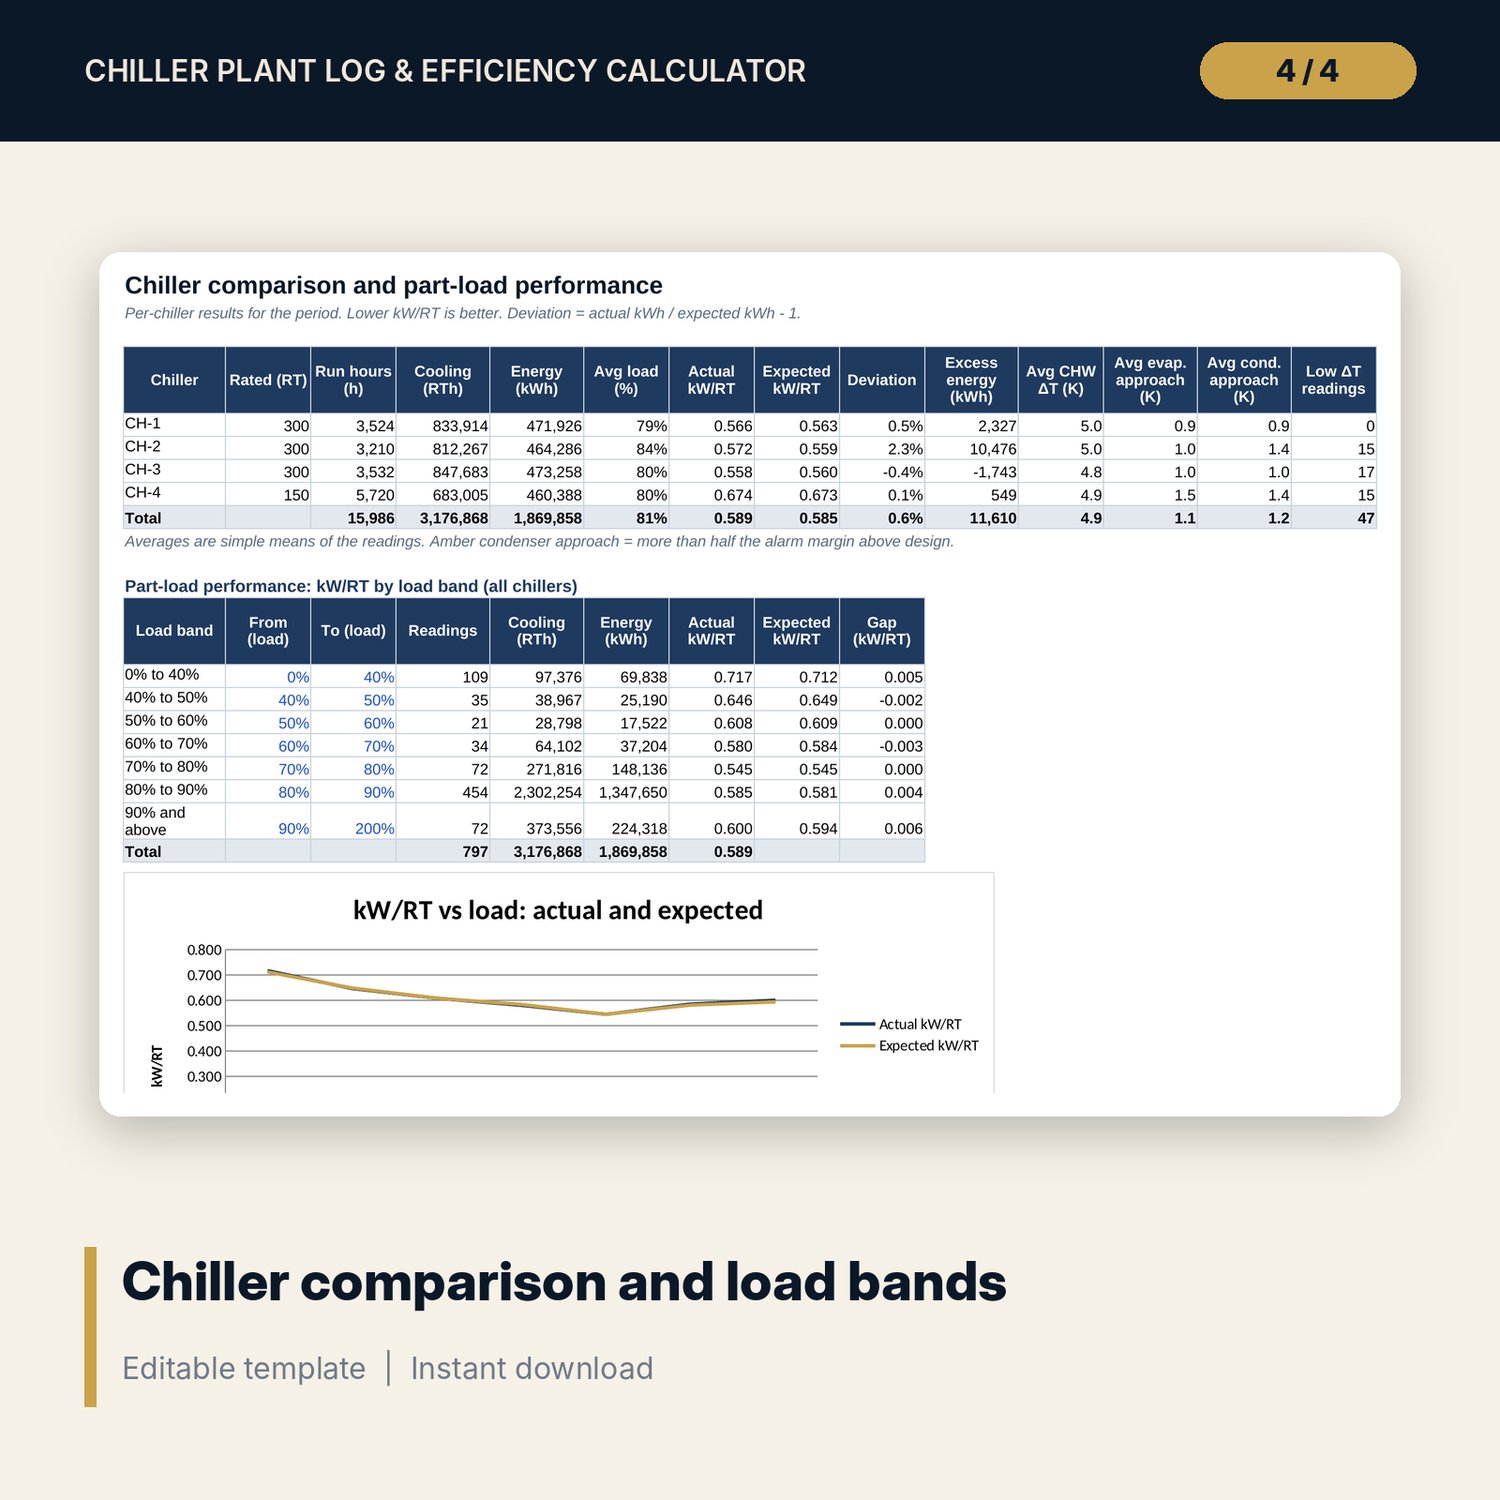
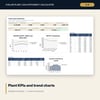
- Diagnostics engine: 14 columns per reading (saturation temperatures, approaches, condenser delta-T, heat balance, 4 flags)
- Settings: 17 editable inputs with units, design data for 4 chillers, 9-point part-load curve, 28-row refrigerant P-T table, 12-month tariff
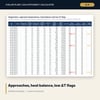
- Monthly_Trend (12 months), Chiller_Summary with 7 load bands, Savings_WhatIf with 3 scenarios and two 6 x 6 sensitivity grids
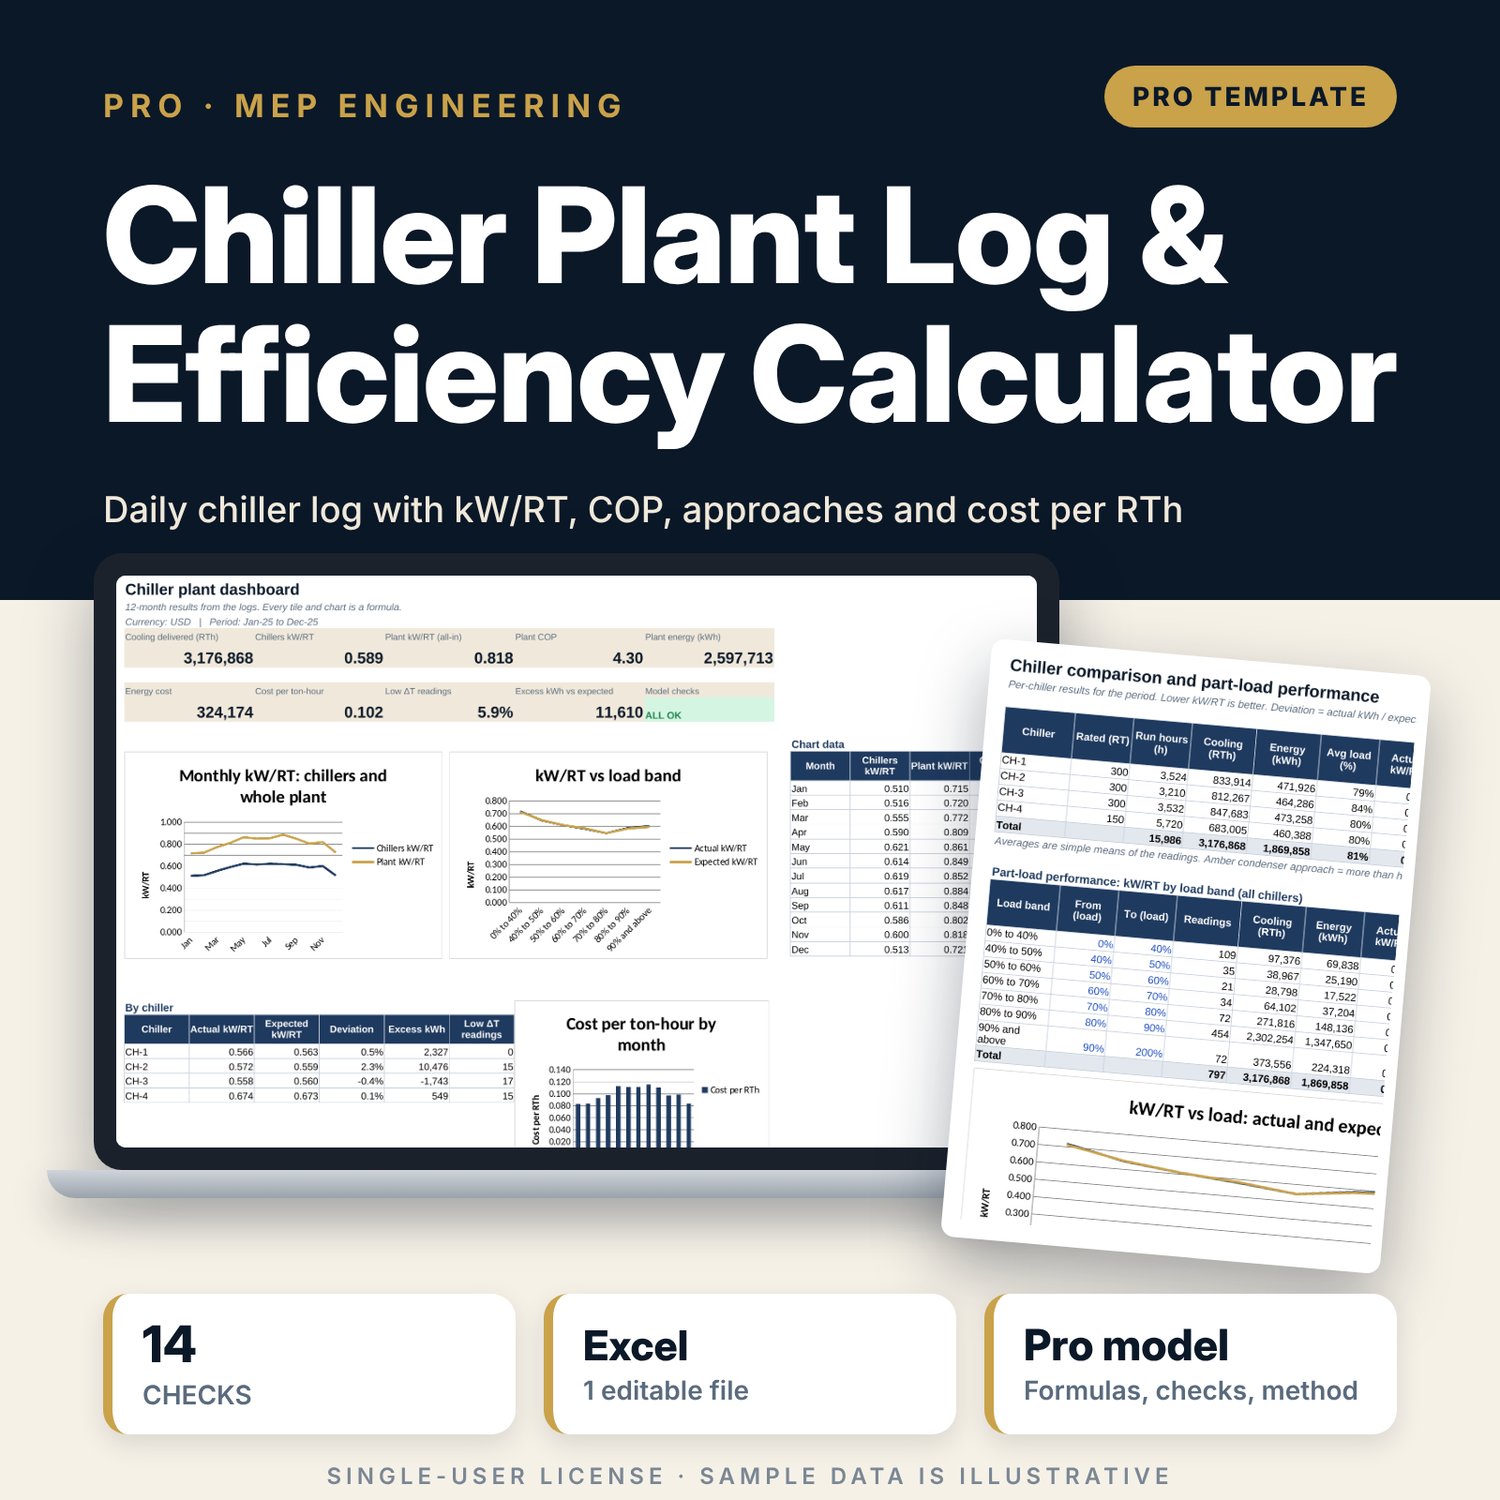
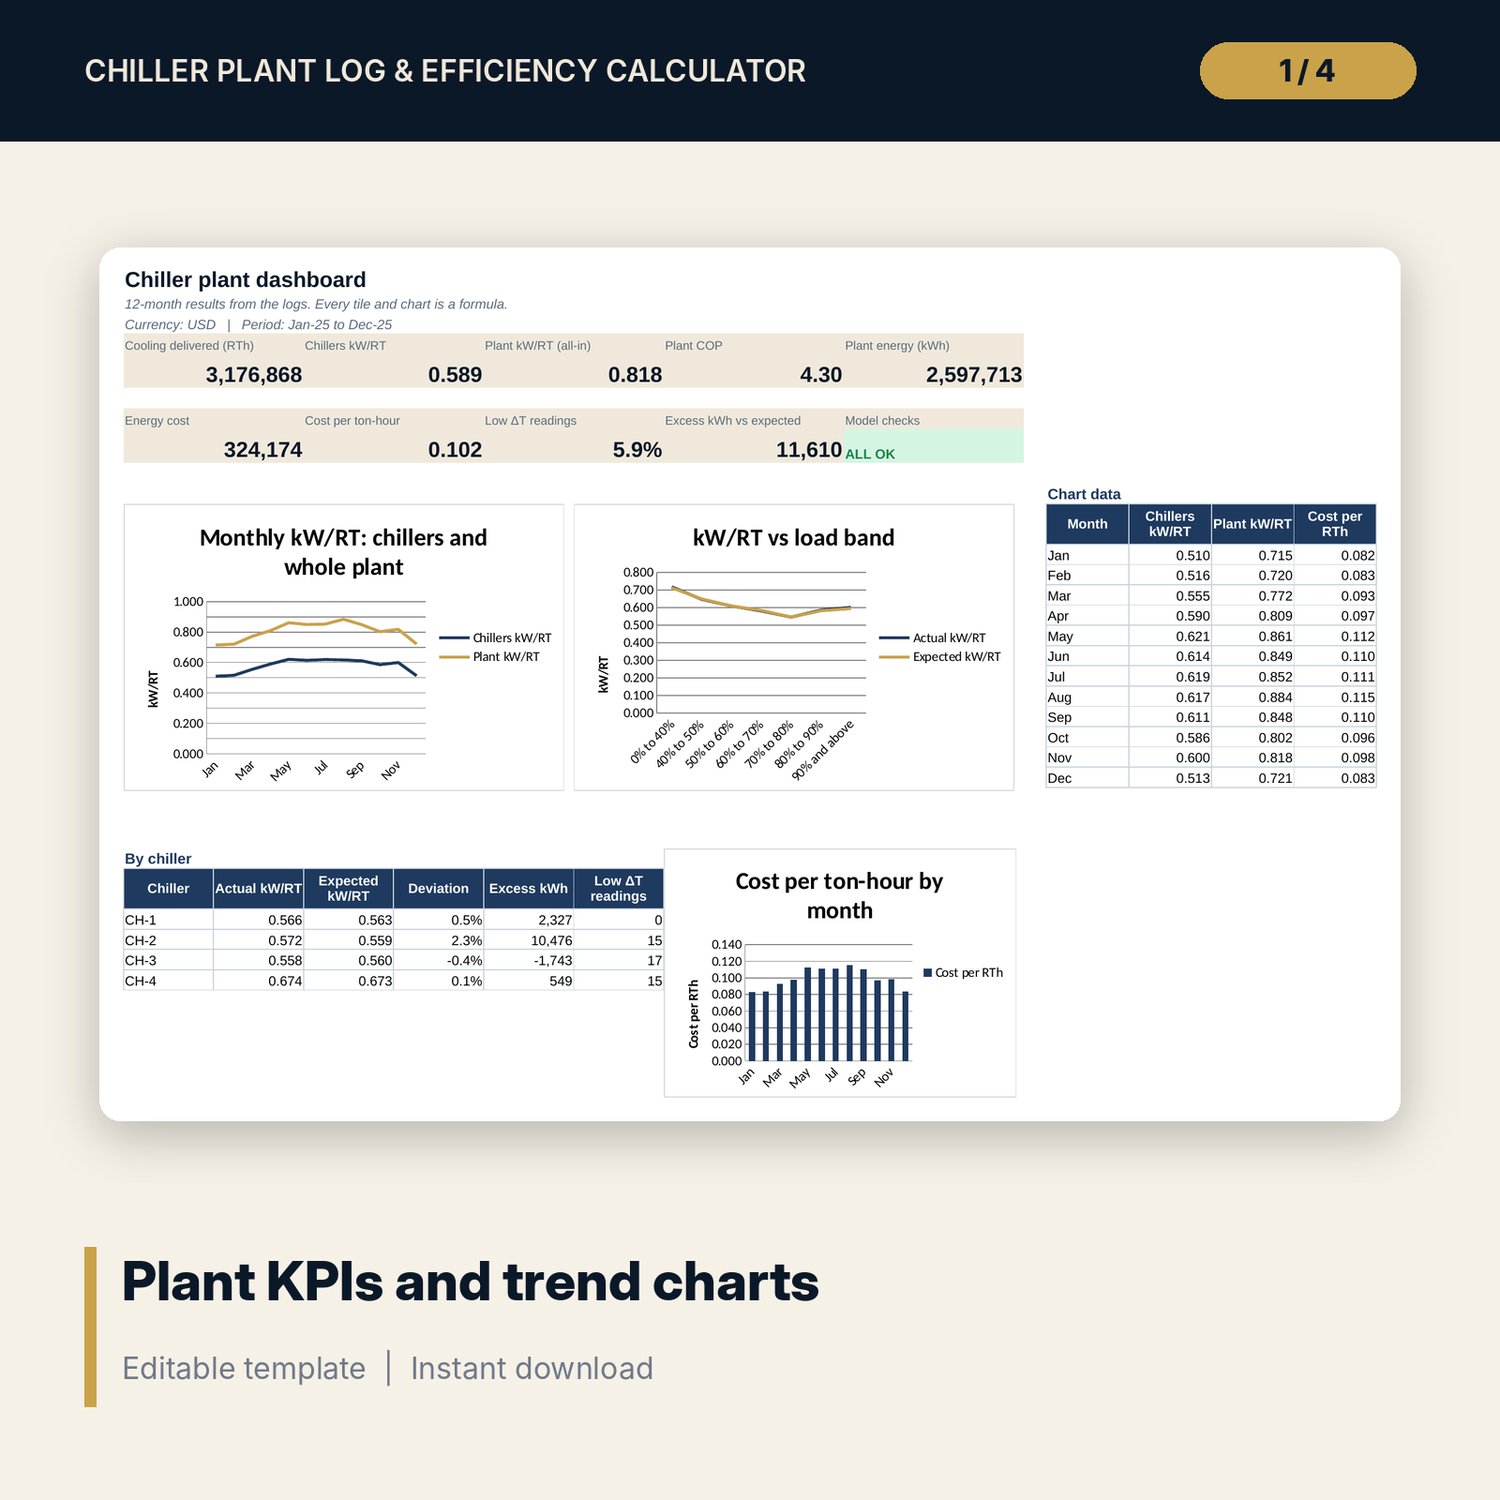
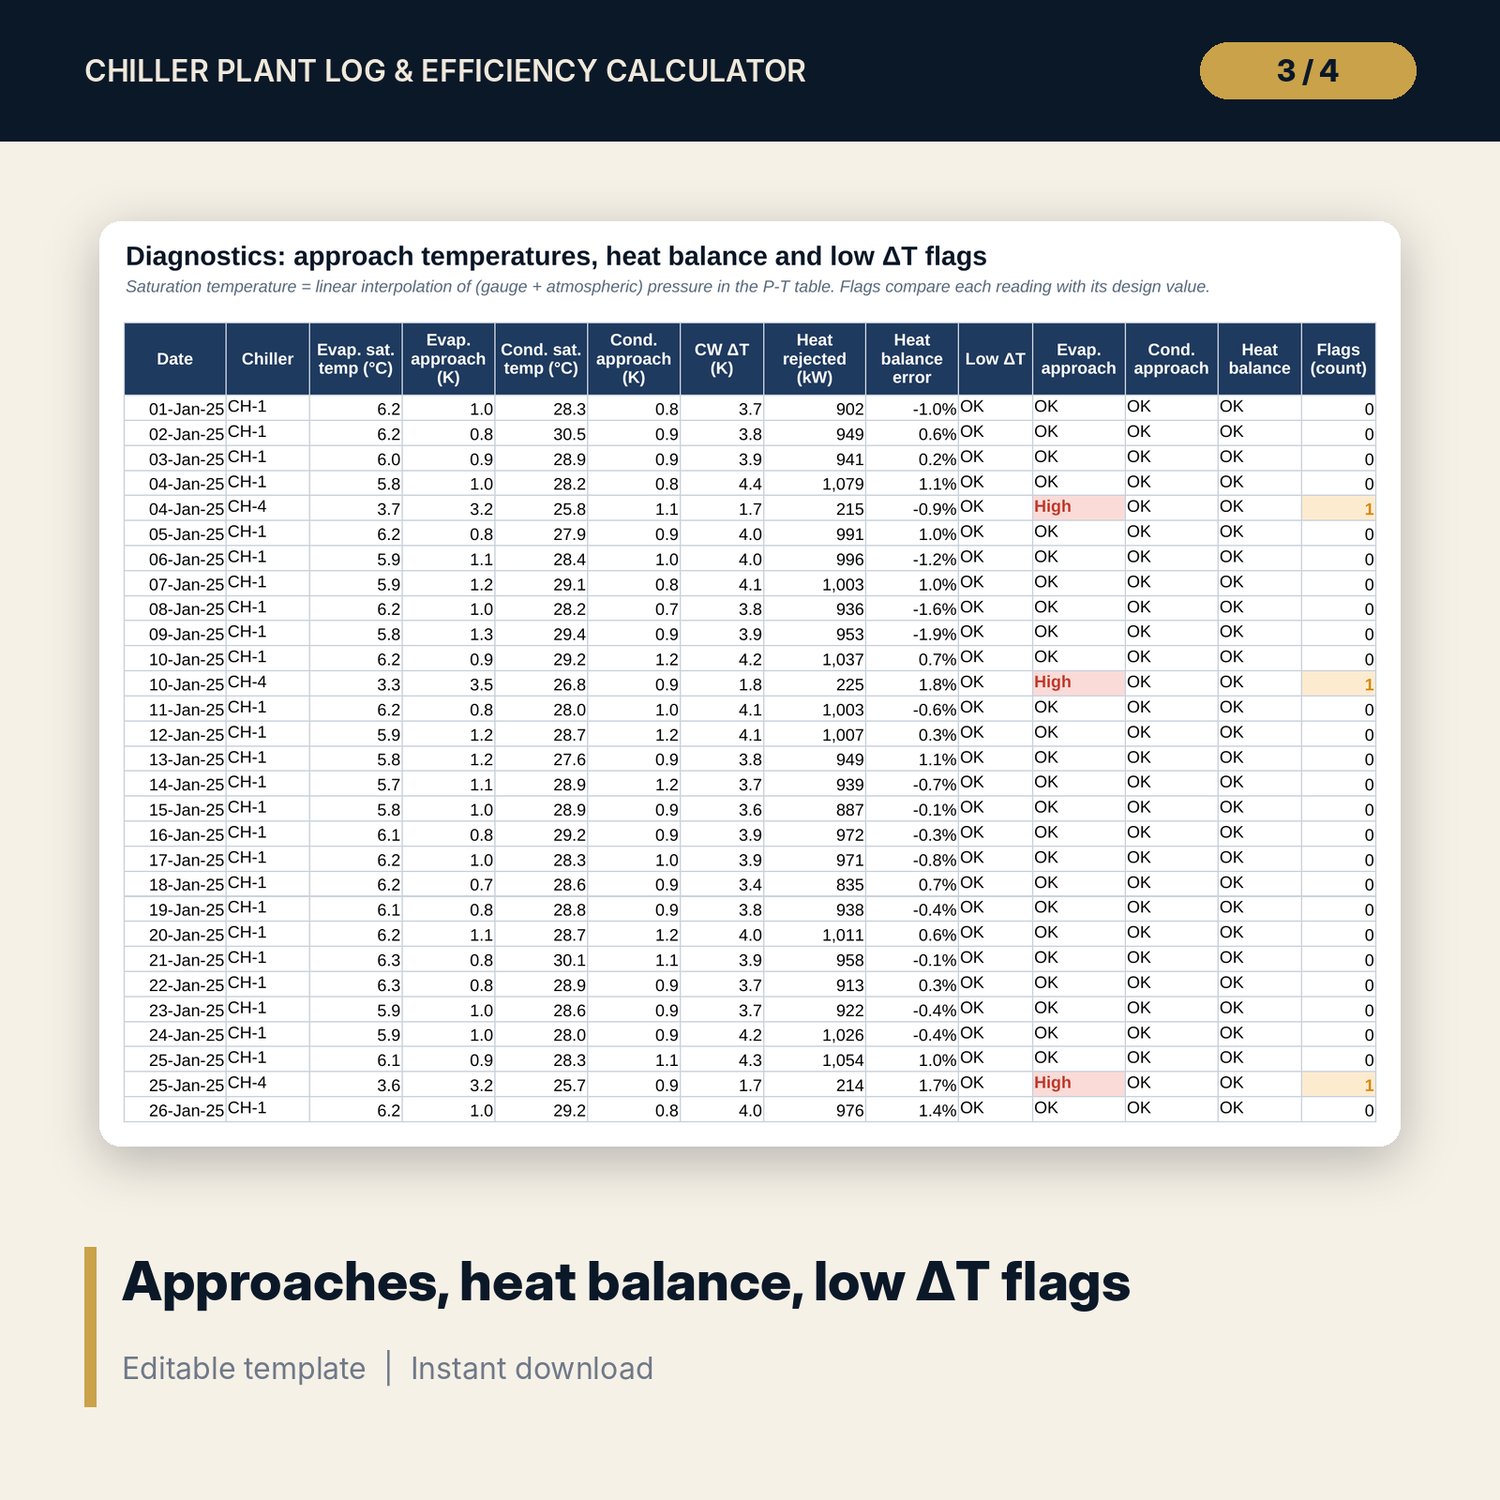
- Dashboard: 9 KPI tiles, check status, 3 charts and a per-chiller table on one page
- README.txt and LICENSE-and-Terms.txt
How it works
- Enter your chillers' design data, tariff, refrigerant P-T table and part-load curve on Settings.
- Log each running chiller every day (or every shift) on Chiller_Log, and pump and tower fan energy on Plant_Log.
- Read the flags on Diagnostics and Chiller_Calc: low delta-T, high approach, heat balance out of tolerance, kW/RT above expected.
- Review the monthly kW/RT trend, cost per ton-hour and the chiller comparison on Monthly_Trend, Chiller_Summary and Dashboard.
- Use Savings_WhatIf to put an annual saving and payback on tube cleaning, set-point resets or equipment upgrades.
Details
- Format: one XLSX workbook
- Language: English
- Units: °C, L/s, kW, kWh, kPa gauge; conversion factors for gpm, psi, bar and °F on the Settings tab
- Software: Excel 2016 or later (Windows or Mac) or LibreOffice Calc; also opens in Google Sheets, where chart styling may differ
- No macros, no array formulas, no external links
- Delivery: instant download
Good to know
- Sample data is illustrative. Replace it with your own readings.
- This is an operating and monitoring tool, not engineering advice or certification. Results depend on sensor accuracy.
- Design values, the refrigerant P-T table, the part-load curve, tariffs and the grid emission factor are editable inputs. Verify them with your supplier, your utility and local requirements.
- Built for water-cooled chiller plants.
- Single-user license.
FAQ
Can I enter readings in °F, gpm and psi?
The workbook calculates in metric units. Convert before entry with the factors on Settings: 1 US gpm = 0.06309 L/s, 1 psi = 6.895 kPa, °C = (°F - 32) / 1.8.
My chillers use a different refrigerant. What do I change?
Replace the P-T table on Settings with the saturation pressure table for your refrigerant in kPa absolute. The approach formulas read the table, so nothing else changes.
Can I log more than one reading per day?
Yes. Enter one row per shift with the hours run in that shift. Daily, monthly and per-chiller totals add up all rows.
Why is the monthly kW/RT not the average of the daily values?
It is energy-weighted: total kWh divided by total ton-hours. A simple average of ratios gives light-load days too much weight.
What does the heat balance check tell me?
Heat rejected at the condenser should equal cooling load plus compressor power within about ±5%. A larger gap usually means a flow meter or temperature sensor is wrong.